- 1The Academy of Medical Engineering and Translational Medicine, Tianjin University, Tianjin, China
- 2The School of Precision Instrument and Opto-Electronics Engineering, Tianjin University, Tianjin, China
- 3Joint Laboratory of Intelligent Medicine, Tianjin 4TH Centre Hospital, Tianjin, China
Background: Bone microstructure is important for evaluating bone strength and requires the support of high-resolution (HR) imaging equipment. Computed tomography (CT) is widely used for medical imaging, but the spatial resolution is not sufficient for bone microstructure. Micro-CT scan data is the gold standard for human bone microstructure or animal experiment. However, Micro-CT has more ionizing radiation and longer scanning time while providing high-quality imaging. It makes sense to reconstruct HR images with less radiation. Image super-resolution (SR) is adapted to the above-mentioned research. The specific objective of this study is to reconstruct HR images of bone microstructure based on low-resolution (LR) images under large-factor condition.
Methods: We propose a generative adversarial network (GAN) based on Res2Net and residual channel attention network which is named R2-RCANGAN. We use real high-resolution and low-resolution training data to make the model learn the image corruption of Micro-CT, and we train six super-resolution models such as super-resolution convolutional neural network to evaluate our method performance.
Results: In terms of peak signal-to-noise ratio (PSNR), our proposed generator network R2-RCAN sets a new state of the art. Such PSNR-oriented methods have high reconstruction accuracy, but the perceptual index to evaluate perceptual quality is very poor. Thus, we combine the generator network R2-RCAN with the U-Net discriminator and loss function with adjusted weights, and the proposed R2-RCANGAN shows the pleasing results in reconstruction accuracy and perceptual quality as compared to the other methods.
Conclusion: The proposed R2-RCANGAN is the first to apply large-factor SR to improve Micro-CT images of bone microstructure. The next steps of the study are to investigate the role of SR in image enhancement during fracture rehabilitation period, which would be of great value in reducing ionizing radiation and promoting recovery.
1 Introduction
Bone strength is determined by the bone microstructure [1]. Low bone strength can increase risk of osteoporosis and fracture, which are major health concerns in the world [2]. It has been estimated that nine million new osteoporotic fractures occur worldwide each year [3]. Computed tomography (CT) is one of the most widely used medical imaging techniques for screening and diagnosis [4]. However, CT is unable to visualize the trabecular bone microstructure due to insufficient resolution and contrast [5]. Micro-CT, which has excellent spatial resolution, has the ability to quantitatively analyze trabecular bone microstructures in clinical research. In translational efforts, Micro-CT has also been used for pre-clinical research to identify effective treatment and pharmacotherapy options [6–8]. Thus, Micro-CT is an essential equipment for imaging human bone microstructure and animal experiments, while it will expose amount of ionizing radiation to the patient or animal when scanning [9]. The higher the resolution of the Micro-CT image, the more radiation is absorbed by patients or animals. According to certain research, high doses x-ray radiation is detrimental to fracture healing whereas low doses help endochondral and intramembranous ossification [10–12]. Thus, it is critical to ensure sufficient image resolution for diagnosis in the case of reducing scanning time and ionizing radiation, which not only enhances the safety of clinical trials and animal experiments, but also their efficacy. Taking into consideration the above scenarios, super-resolution (SR) is the most appropriate approach for obtaining high-resolution (HR) images at low doses of radiation [13].
SR is a challenging task in computer vision, which is to reconstruct HR images from low-resolution (LR) images [14, 15]. With the deepening and development of research, the SR algorithms can be separated into three classes: 1) Interpolation-based methods: These methods are computationally inexpensive, and lose a lot of high frequency texture; 2) Model-based methods [15–17]: These methods are based on a priori information and regularized reconstruction. It has better performance compared to interpolation-based method. However, it relies too much on image prior information, which can lead to very poor results if the input image is small; and 3) Learning-based methods (before deep learning): These methods learn a nonlinear mapping from paired LR and HR images [18]. It can recover missing high-frequency textures and its powerful performance has attracted strong interest from researchers.
With the development of advanced methods and graphics processing units, deep learning (DL) has been regarded as a very promising approach for image processing [19], and it also provides inspiration and innovative ideas for SR [20]. The first DL-based SR application was in 2014 and Dong et al. proposed super-resolution convolutional neural network (SRCNN) with a three-layer convolutional network [21]. Since SRCNN, DL has provided new routes toward the development of high-performance SR. Later, the performance of the SR algorithm became even better with the development of DL, such as the improvement of the upsampling module [22, 23], new backbone proposed [24–28], and modification of the loss function [29]. The above DL-based methods use the mean square error (MSE) or L1 as the loss function to improve the peak signal-to-noise ratio (PSNR), and continuously improve performance. However, some studies pointed out that the PSNR-oriented method results in a loss of high-frequency textures and inconsistency with human visual perception. Recently, the popularity of generative adversarial networks (GAN), which enables CNNs to learn feature representations from complex data distributions, has made it possible to solve the above problem. GAN-based methods have achieved good results [30–32].
In the area of medical imaging, DL has been used successfully in every aspect, such as disease classification, outcome prediction, medical image segmentation and much more [33–36]. DL-based SR algorithms have made progress in several medical imaging modalities. Zhang et al. proposed a hybrid model to improve CT resolution [37]. Chen et al. proposed a 3D densely connected SR model to restore HR features of brain magnetic resonance image (MRI). Dong et al. proposed a multi-encoder structure based on structural loss and adversarial loss to magnetic resonance spectroscopic imaging (MRSI) resolution enhancement [38]. And SR also has made progress in the pre-clinical research. You et al. proposed GAN-CIRCLE to enhance the spatial resolution of Micro-CT scans of bone [39]. Xie et al. developed auto-encoder structure to reconstruct HR bone microstructure [40].
However, there are still the following important challenges and inherent trends: 1) Most of the previous studies focus on the small-factor SR (2× and 4×) [41]. Large-factor image SR is likely to be required in the field of pre-clinical and clinical imaging. However, the smaller the factor, the lower the difficulty for SR. Large-factor image SR requires more effective approaches [19]. 2) The corruption of Micro-CT images is unknown [5]. It is certainly quite different from the LR images which are obtained from HR images downsampling [20]. 3) Reconstruction images require a balance between the accuracy of the reconstructed image and preserving more high frequency textures [19].
Motivated by the aforementioned drawbacks, in this study we made major efforts in the following aspects. First, we determined to use Micro-CT images of the rat fracture models. Previous research has established that Micro-CT images with voxel sizes of 10 µm are sufficient to observe fractures in rats [6, 8]. To achieve the large-factor SR conditions, the HR and LR voxel sizes are 10 μm and 80 µm in this research. Second, Our HR and LR images are real data from Micro-CT, which enables the SR model to learn about the actual corruption of Micro-CT. Finally, we propose a new GAN combining Res2Net [42] and residual channel attention network (RCAN) [28], which named R2-RCANGAN. The generator network R2-RCAN increases the network width and has the ability of multi-scale feature extraction while considering the advantages of each channel. The U-Net discriminator with spectral normalization (SN) has a more stable performance [32]. And we adjust the weight of the loss function, which enable the recovered images have a better perceptual quality and the accuracy of the pre-clinical images. Our R2-RCANGAN achieves the best results over the other classical SR models.
To summarize, the specific objective of this study is to develop an 8×SR model based on Micro-CT images. The following innovative points introduced in the paper are worth mentioning:
1) The large-scale (8×) SR is unusual in pre-clinical imaging or clinical imaging.
2) Our HR and LR images are real data from the device so that the SR model learns about the actual Micro-CT corruption.
3) We propose a new network structure R2-RCANGAN. Our generator network R2-RCAN sets a new state-of-the-art in terms of PSNR. In addition, we combined a stable U-Net discriminator and a loss function with appropriate weights. These significantly improve the perceptual quality of the reconstructed images. R2-RCANGAN maintains as much accuracy as possible in pre-clinical images with good perceptual quality.
2 Methods
2.1 Dataset preparation
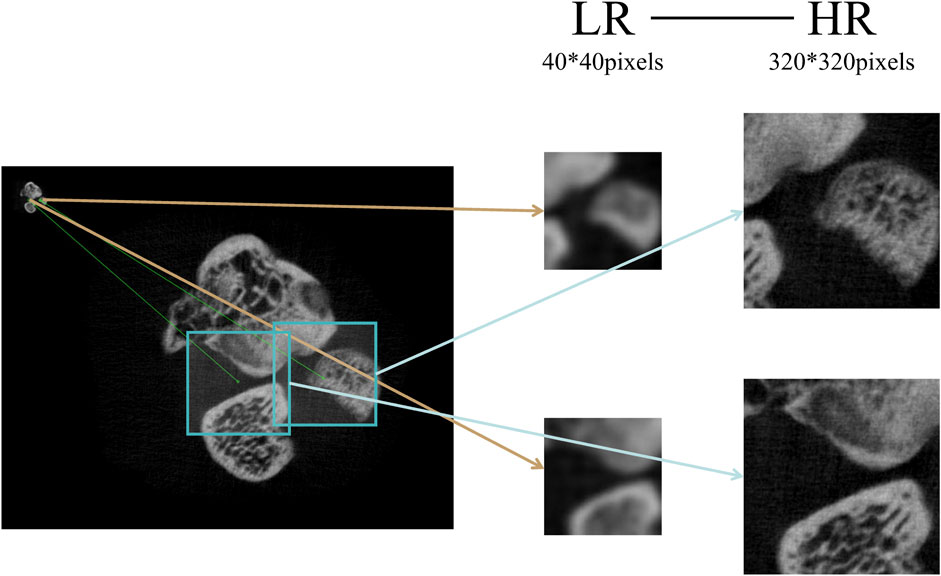
Micro-CT with high spatial resolution offers important support for imaging small animals. However, a major problem with Micro-CT is that it suffers from poor temporal resolution. One Micro-CT scanning cycle is performed throughout numerous respiration cycles for living animal imaging [43]. This study applied live rats, and even when the position of the rats was strictly maintained, the respiratory motor of the rats caused the HR and LR images to mismatch. To solve the problem, this research applies the feature point matching approach to make LR-HR image pairs, as shown in Figure 1.
In this work, we use the A-KAZE algorithm to detect feature points and the Brute-Force approach to match feature points [44]. After matching feature points, we select two pairs of feature points a-A and b-B (points a and b from the LR image, points A and B from the HR image). Connecting ab and calculating the angle with the horizontal direction by Eq. 1:
where (
With the above operations, a 40 × 40 pixels sub-image is cropped from the LR image, and a 320 × 320 pixels sub-image is cropped from the HR image. This not only solves the image motion shift, but also crops the image to optimize deep learning training.
2.2 Generator network
As shown in Figure 2, our generator network named R2-RCAN is an enhanced model of RCAN [28]. While retaining the residual channel attention block (RCAB) of the model, it has introduced the Res2-group based on Res2block. By increasing the model width, the model gains the ability to extract multi-scale features. It includes one convolution layer in shallow feature extraction, several groups (RCAB-group and Res2-group) stacked in deep feature extraction and the image reconstruction layer based on sub-pixel convolution.
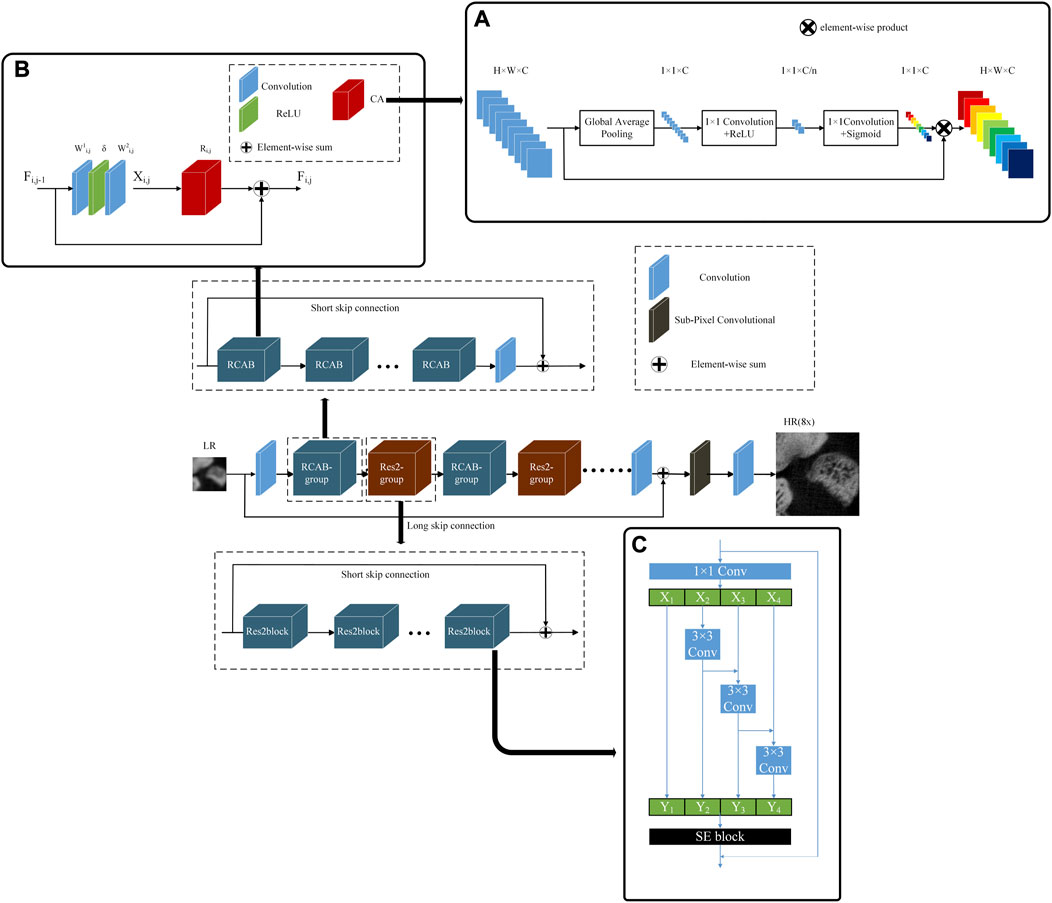
FIGURE 2. The structure of generator network R2-RCAN. (A) The structure of CA, (B) The structure of RCAB, (C) The structure of Res2block.
2.2.1 Channel attention (CA)
CA is an important structure of the RCAB. CA can adaptively adjust the feature weight of each channel to make the network focus on more useful feature channels. The structure of CA is shown in Figure 2A. Initially, CA is a global average pooling layer. Next, two 1 × 1 convolutional layers are down-scaled and up-scaled to obtain the weight of each channel. The last step of CA is to multiply the channel weight with the input feature maps to obtain new feature maps.
2.2.2 RCAB
The principle of RCAB is to add CA to the residual block. The structure of the RCAB is shown in Figure 2B, it contains two convolutional layers and one CA layer. Eq. 2 represents the input after two layers of convolution:
where i and j represent the jth RCAB of the ith group,
where
2.2.3 Res2-group
Res2-group is stacked by Res2block [42]. Rse2block is a novel backbone in Res2Net, and its structure is shown in Figure 2C. It represents multi-scale features and expands the range of receptive fields for each network layer. The Res2block used in this study integrates the Squeeze-and-Excitation (SE) block [45]. The SE block establishes the channel dependency relationship and adaptively recalibrates the channel characteristic response. This is similar to the previous RCAB in terms of channel response, so the Res2-group in this study is suitable for RCAB-group. As the network depth increases, the receptive field of the network expands, multi-scale features are expressed, and the network width expands. Res2-group contains five Res2blocks and SSC.
2.3 Discriminator network
We used the U-Net discriminator with spectral normalization (SN) [32]. The U-Net discriminator structure is shown in Figure 3. It contains convolution layers, SN layers and SSC. SN prevents GAN training instability caused by real CT corruption. Studies have demonstrated that SN is beneficial to alleviate the over-sharp and annoying artifacts introduced by GAN training.
2.4 Loss function
Our loss function contains three parts: L1 loss, GAN loss and perceptual loss. L1 loss is the content loss that evaluates the 1-norm distance between the recovered SR image and the HR image, which is as in Eq. 4:
where n is the number of samples, H and W are the length and width of the image, respectively. I is the image pixel value.
GAN loss needs to calculate discriminator loss, and the discriminator loss is as in Eq. 5:
where we used the relative discriminator [46],
In addition to the above two loss functions, there is also a perceptual loss function
where α, β, and δ are constants.
3 Experiments
3.1 Datasets
All procedures performed in studies involving animals were in accordance with the ethical standards of the national research committee and with the 1964 Helsinki declaration and its later amendments or comparable ethical standards.
The data (HR and LR) used in this study were derived from 10 living rat fracture models (with a median age of 55 days and a median body weight of 200 g). All rat models for ankle fracture were established by professional operators (The depth of the fracture reached the trabecular bone, but the medial malleolus artery was not damaged.), and scanned the tibia to the ankle bone. We use the same scanner (Micro-CT: Bruker SkyScan 1276) with two scanning protocols. The Micro-CT parameters are as follows: 1) HR: X-ray source circular scanning, tube current 200μA, tube voltage 85 kVp and filtration 0.5 mm(AI), 900 projections over a range of 360°, exposure 464 ms per projection. 2) LR: X-ray source circular scanning, tube current 200μA, tube voltage 85 kVp and filtration 0.5 mm(AI), 225 projections over a range of 360°, exposure 40 ms per projection.
The Micro-CT projections were reconstructed using the Feldkamp-Davis-Kress (FDK) algorithm based on NRecon (Burker’s reconstruction program: Program Version = 1.7.3.1, Reconstruction engine = InstaRecon, Engine version = 2.0.4.6, Smoothing kernel = Gaussian, Filter type = Hamming): the HR image size 1280 × 1280 pixels, 4,000 slices at 10 μm voxel size, and the LR image size 160 × 160 pixels, 500 slices at 80 μm voxel size. So we select one HR image for every eight HR images to match the LR image (500 pairs). By making LR-HR image pairs in Section 2.1, HR images and LR images are cropped to 320 × 320 pixels and 40 × 40 pixels. We screened 1279 LR-HR image pairs (2–three pairs of LR-HR images were cropped out of each of the 500 pairs), of which 1000 have good image quality. And the data were split into training set (80%), validation set (10%) and test set (10%), where the training and test sets are from different rat models.
3.2 Training settings
The generation network R2-RCAN is made up of 10 RCAB-groups and 10 Res2-groups that are interconnected alternately. Each RCAB-group contains 20 RCAB layers, and each Res2-group contains five Res2blocks. The convolution kernels size for adjusting the channel scale are 1 × 1, while other convolution kernels are all 3 × 3.
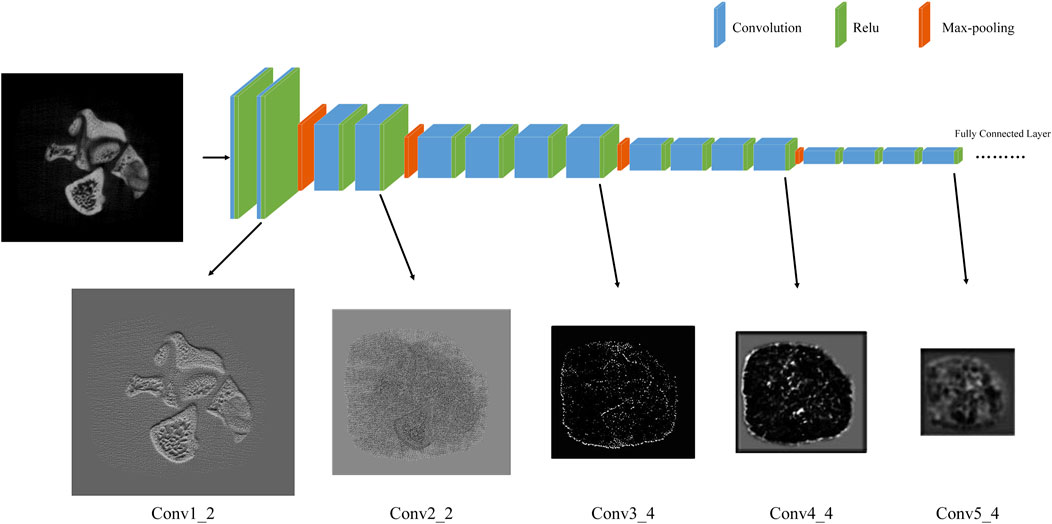
We perform carefully designed data augmentation during training, which are randomly rotated (90°, 180° and 270°) and flipped. In each training batch, 64 LR images are extracted as inputs. The total loss function 7) weight {α, β, δ} is {1, 0.1, 0.5}. We use the {conv1_2, conv2_2, …, conv5_4} feature maps (with weights {1, 0.5, 0.1, 0.1, 0.1}) before activation in the pre-trained VGG19 network as the perceptual loss. As shown in Figure 4, there are feature maps for each block of VGG19. The feature maps of the conv1_2 and conv2_2 contains a large number of high frequency textures such as bone trabeculae, which is important high frequency information needed for our SR model. Thus, we attribute a higher weight to the first two feature maps.
Our network is trained by Adam optimizer with β1 = 0.9 and β2 = 0.999. The initial learning rate is set to 1 × 10⁻⁴ and then decreases to half every 105 iterations of back-propagation. We train R2-RCAN for 300 K iterations while training R2-RCANGAN for 150 K iterations. Our model is trained by a GeForce RTX 2080 Ti.
3.3 Performance comparison
We trained R2-RCAN (generative networks with L1 loss as loss function) and R2-RCANGAN. At the same time, we compared the classic PSNR-oriented methods (SRCNN [21], EDSR [29], RRDB [31], and RCAN [28]) and GAN-based ESRGAN [31].
To ensure the accuracy of pre-clinical images while getting a better perceived quality. We validated the SR performance in terms of two widely-used image quality metrics: PSNR and perceptual index (PI) [47]. PSNR as a typical distortion measure is used to evaluate the reconstruction accuracy of SR. A higher PSNR means better reconstruction accuracy. The calculation of PSNR is based on Eq. 8.
where the PSNR is derived from MSE between the HR image
Table 1 and Figure 5 show the summary of PSNR and PI for each method. In terms of PSNR, our proposed R2-RCAN sets a new state of the art in the rat fracture dataset. In terms of PI, ESRGAN gets the best score.
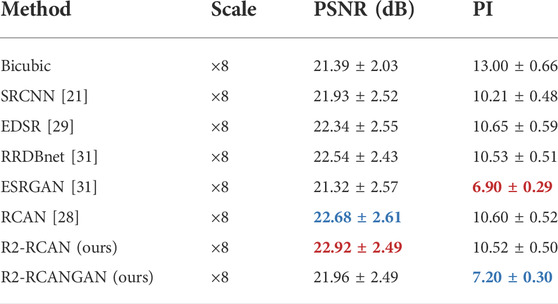
TABLE 1. Quantitative results of different methods on the test set (PSNR/PI). Red and blue indicate the best and the second best performance, respectively.
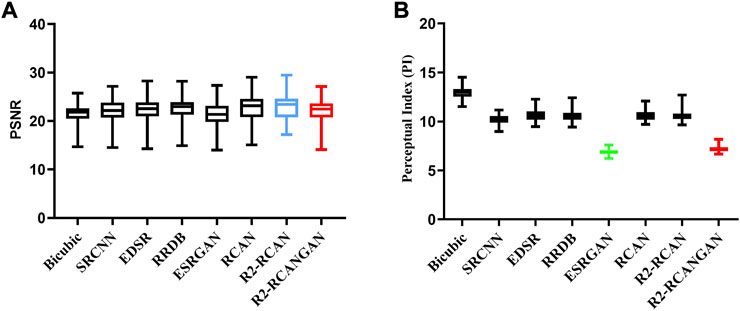
FIGURE 5. Box plot of PSNR and PI on the test set. The R2-RCANGAN (red) has good reconstruction accuracy and perceptual quality. In terms of PSNR, R2-RCAN (blue) is the best, but it has a poor PI performance. In terms of PI, ESRGAN (green) is the best, but its PSNR is too low. (A) PSNR on the test set, (B) PI on the test set.
But the above does not mean that they are the best algorithms, because reconstruction accuracy and perceptual quality are at odds with each other. As shown in Figure 6, PSNR-PI plane allows a better weighing of reconstruction accuracy and perceptual quality. The PSNR-oriented methods have very high reconstruction accuracy but very poor perceptual quality. ESRGAN has the best perceptual quality, but the reconstruction accuracy is very low (PSNR is even lower than the bicubic interpolation in Table 1). Only our proposed R2-RCANGAN achieves the not bad scores in terms of PSNR and second best values in terms of PI. It maintains as much accuracy as possible in pre-clinical images, while having a good perceptual quality. R2-RCANGAN loses 4 percent of PSNR while improving PI by 32 percent compared to R2-RCAN.
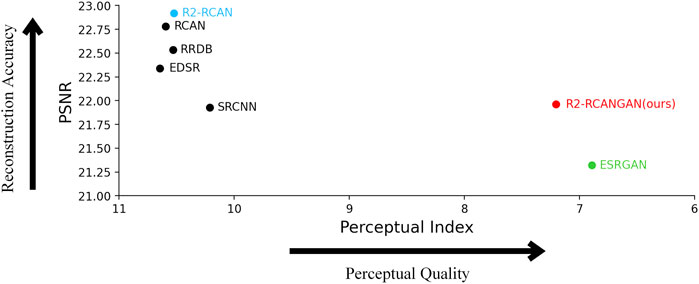
FIGURE 6. PSNR-PI plane on the test set. The PSNR-oriented methods such as R2-RCAN (blue) have very high reconstruction accuracy but very poor perceptual quality. ESRGAN (green) has the best perceptual quality, but the reconstruction accuracy is too low. Only R2-RCANGAN (red) does not fall into either extreme in the scatter plot, balancing reconstruction accuracy and perceptual quality.
In this study, several samples were selected to compare the SR results of different methods. Figure 7 confirms that the PSNR-oriented methods (SRCNN, EDSR, RRDB, RCAN, and R2-RCAN) produced blurry results, while the GAN-based methods (ESRGAN and R2-RCANGAN) restored more anatomical contents and was suitable for human perception. PSNR-oriented methods may fail to recover some fine structure for fracture evaluation, such as shown by blue boxes in Figure 7A. In Figures 7B,C, green boxes mark trabeculae bone. These results indicate that PSNR-oriented methods can significantly suppress the noise and artifacts. However, it has poor image quality as judged by a human observer because it implies that noise impact is independent of local image properties, whereas the human visual system’s sensitivity to noise is reliant on local contrast, intensity, and structural variations. Most importantly the texture of the bone trabeculae has been smoothed out as noise during this large-factor SR reconstruction. It can also be observed that the GAN-based models introduce false textures and strong noise. In particular, in Figure 7B, the trabecular is incorrect (green box) and generates additional noise (yellow arrow) on the result of ESRGAN. And our proposed R2-RCANGAN is capable of maintaining high-frequency features to recover more realistic images with lower noise compared with ESRGAN. In terms of PSNR, R2-RCANGAN is also not significantly lower than the PSNR-oriented methods, and it both obtains the pleasing results in terms of PSNR and PI. R2-RCANGAN generates more visually pleasant results with high reconstruction accuracy than the other methods.
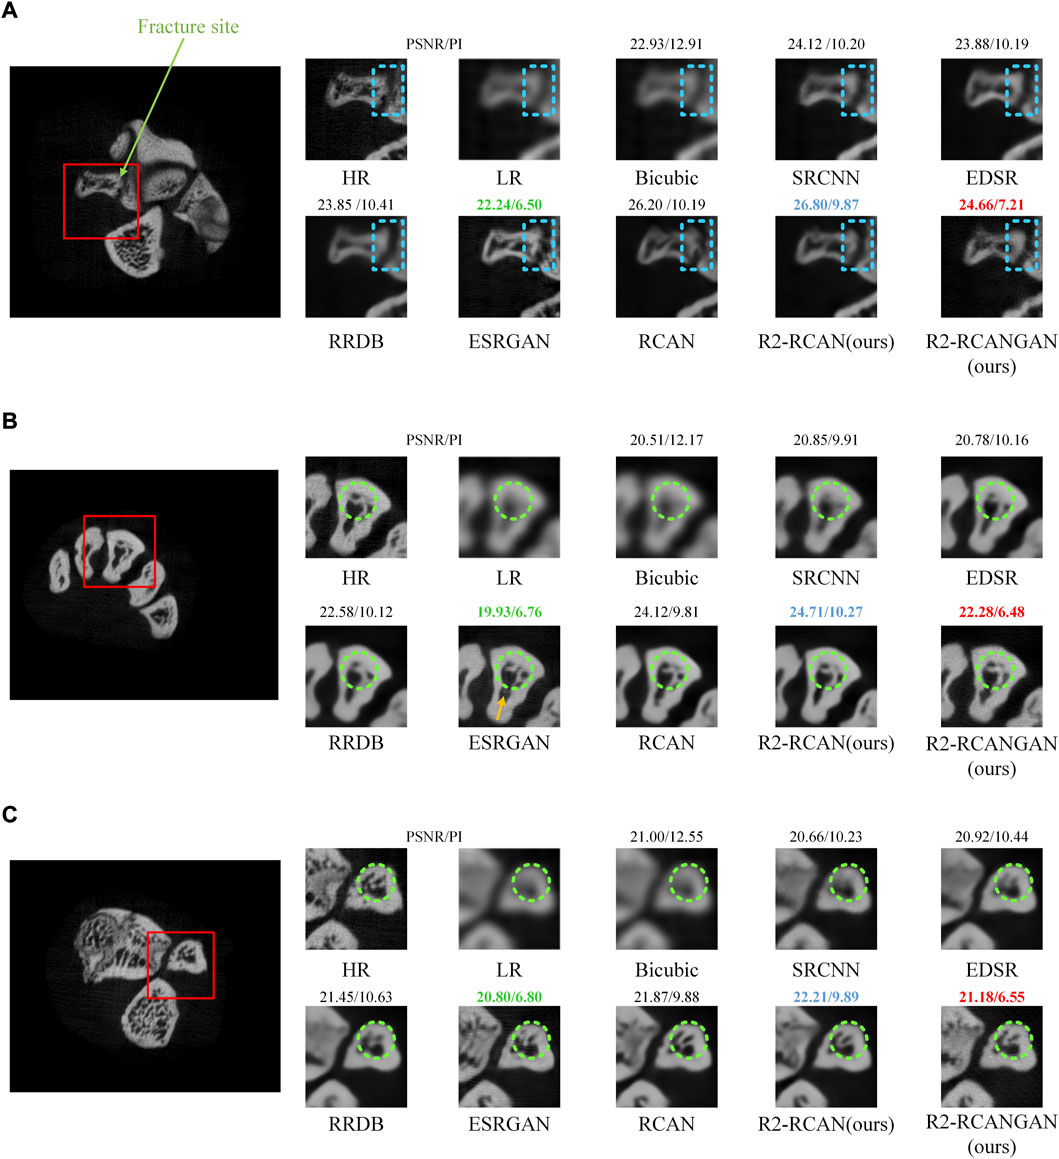
FIGURE 7. Visual comparison of different methods. R2-RCAN (blue) has the highest reconstruction accuracy, but loses a lot of image texture. ESRGAN (green) had the best perceptual quality, but showed many erroneous textures and the worst reconstruction accuracy. R2-RCANGAN (red) has a good performance in both reconstruction accuracy and perceptual quality. (A) Sample of the fracture site. (B,C) Sample of the trabeculae bone.
3.4 Model performance based different training data
We analysed the performance of R2-RCANGAN based on different training datasets. There are two groups of paired LR and HR images: 1) LR and HR images are real data scanned from Micro-CT. 2) LR image is bicubic downsampled version of HR image. This downsampling approach to obtain paired data commonly used in the SR studies. We trained R2-RCANGAN with the same hyperparameter settings using the two training sets described above. We compared the performance of the two models on the test set. The quantitative results are in Table 2. The results demonstrate that the R2-RCANGAN trained on real data achieves the higher scores using the evaluation metrics. We present typical results in Figure 8, which contains the trabeculae and the fracture site. These results demonstrate that model based on downsampled data perform much less well than model based on real data. The quality of the reconstructed images of both the trabeculae (green box in Figure 8A) and the fracture sites (blue box in Figure 8B) is very bad, even similar to LR images. Surprisingly, the difference in the PSNR values in Table 2 is not as pronounced as shown in Figure 8. The above scenario could be attributed to LR-HR image pairs based downsampled are better matched and the do not suffer from errors in the position of the real LR-HR image pairs. This makes it easier to compare reconstruction results to show the difference between the two LR-HR image pairs. In summary, for the informants in this study, the commonly SR models used downsampled training data are not suitable for medical imaging devices. In the field of medical research, realistic paired images are essential.

TABLE 2. Quantitative results (on the test set) based on training with different paired LR and HR images.
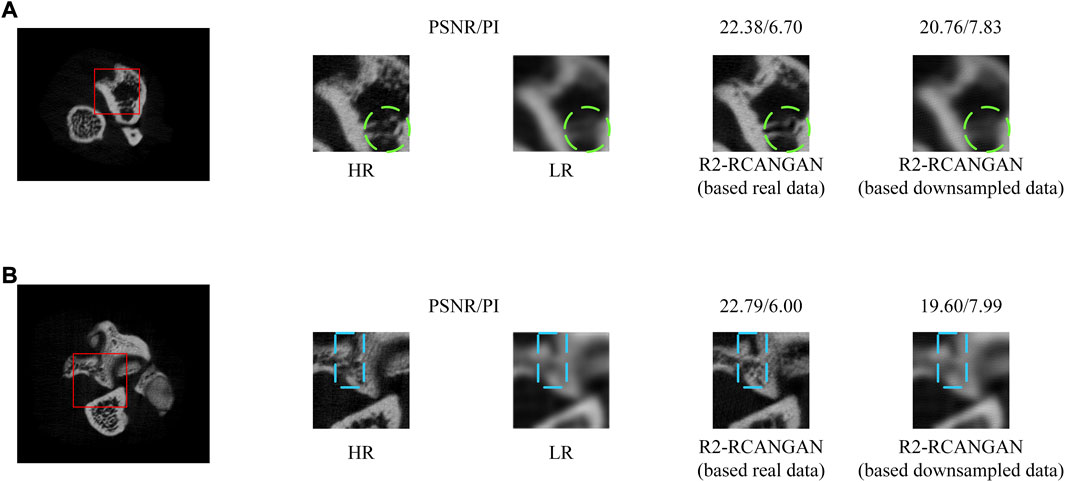
FIGURE 8. Visual comparison of the models based on different training datasets. (A) Sample of the trabeculae bone. (B) Sample of the fracture site.
4 Discussions
Prior studies that have noted the bone microstructure is a significant predictor of osteoporosis and fracture risk [1, 50, 51]. However, The spatial resolution of the best CT imaging technologies is only comparable to or slightly higher than human trabecular bone thickness [52], resulting in fuzzy representations of individual trabecular bone microstructure with significant partial volume effects, which add significant errors in measurements and interpretations. Thus, Micro-CT is suitable for imaging bone microstructure. And it is well known that ionizing radiation is harmful to animals and humans [10, 11, 53]. Even so, for a more accurate medical diagnosis, we need imaging equipment that can cause damage to the body. We are committed to reducing ionizing radiation while maintaining the resolution of Micro-CT images. The first question in this study is determining the SR factor. Previous pre-clinical or clinical image studies have focused on small-factor SR [39, 40]. Thus, the specific objective of this study is to establish an ×8 SR model and it contributes to the development of the large-factor SR for medical imaging.
In previous SR studies, LR image is downsampled version generated from HR image [19–21]. In order for our SR model to learn the real corruption of Micro-CT, LR images are obtained from the equipment scans. Given that our samples are live rats, the LR and HR images do not match due to the offset position of the samples. We use feature point detection and matching algorithms to create LR-HR image pairs. The above image pairs support our model to learn the real Micro-CT image corruption. And we also trained a model based on downsampled data, which was much less effective than the model trained on real data. These results further support the importance of real data for medical SR.
Our SR model focuses not only on image reconstruction accuracy, but also on perceptual quality. A negative relationship between reconstruction accuracy and perceptual quality has been reported in the literature [54]. In this study, the PSNR is used to assess accuracy and the PI to assess perceptual quality. R2-RCANGAN combines Res2Net, RCAN, and U-Net discriminators. Its generator R2-RCAN has the advantage of adaptive channel attention while increasing the network width, making the network deep enough and increasing the multi-scale feature extraction capability. In terms of PSNR, the generator R2-RCAN sets a new state of the art. But these PSRN-oriented SR models share the same problem: they tend to output over-smoothed results without sufficient high-frequency details. Simply, it is poorly related to the human subjective evaluation and low perceptual quality. So R2-RCANGAN incorporates a stable U-Net discriminator and adjusted loss function, which increases the perceptual quality substantially with a small loss of reconstruction accuracy. It is only a little lower than the PI of ESRGAN, but the reconstruction accuracy is much higher than that of ESRGAN. Thus, we have designed an effective SR model. R2-RCANGAN satisfies the accuracy reconstruction of pre-clinical images and matches the perceptual quality of the human visual system.
Despite these advances, several outstanding questions remain to be addressed. Firstly, GAN training produces some unpleasant error textures and requires much longer training time [31, 32]. The more efficient architectures should be further investigated. Optimizing the model structure can increase model training efficiency and save computational resources. Secondly, the technical route of this research is applicable to various medical imaging fields such as X-ray, CT, and MRI. We may create a personalized SR model for a specific medical scene by obtaining LR-HR datasets from different scanning devices. The limitation of this study is that all of the data are scanned from a single device, and applying images from other devices to this model may lead to bias. The accuracy, stability, robustness and extensibility of the R2-RCANGAN should be further assessed and validated. Thirdly, there is abundant room for further progress in determining more suitable measures for evaluating SR results. Several researches have proposed that PSNR cannot capture and accurately assess the image quality associated with the human visual system [31, 47, 54]. A further study with more focus on more scientific evaluation metrics is therefore suggested. Finally, CT imaging assessment during rehabilitation is also critical, both for fracture rehabilitation in humans and for assessing fracture healing in animal experiments. The assessment of post-fracture rehabilitation relies on post-operative radiographs or CT [55], so that multiple radiological examinations will bring a large amount of ionizing radiation. Further work is necessary to establish the viability of R2-RCANGAN in evaluating the degree of healing during fracture recovery.
5 Conclusion
The purpose of the research is to perform a large-factor SR (8×) reconstruction of Micro-CT images. The difference is that previous SR researches get LR images through HR image downsampling, while our HR and LR images are real data obtained from Micro-CT. The SR model can learn the real corruption process of Micro-CT imaging. The LR-HR image pairs are made with the image processing technology of image feature point matching. We propose the new network R2-RCANGAN, which is based on Res2Net, RCAN, and U-Net. Its generator network R2-RCAN maintains the depth of the model while enhancing the model’s ability for multi-scale feature extraction. In terms of PSNR, R2-RCAN sets a new state of the art compared to other methods. Adding a more stable U-net discriminator and adjusting the weights of the loss function to fit this experimental dataset. These enable R2-RCANGAN to generate reconstructed images that combine reconstruction accuracy and perceptual quality. Our R2-RCANGAN is the first attempt at large-factor pre-clinical image SR reconstruction and produces promising results. Further research should be undertaken to verify the effectiveness of SR during fracture rehabilitation, which has important clinical implications.
Data availability statement
The raw data supporting the conclusions of this article will be made available by the authors, without undue reservation.
Ethics statement
The animal study was reviewed and approved by The Animal Ethical and Welfare of Tianjin University.
Author contributions
HY designed the project and revised the manuscript. SW performed data analysis, wrote the programs and drafted the manuscript. YF, GW and JL analyzed and interpreted the data. CL and ZL helped with some animal experiments. JS helped with all animal experiments and guided the study. All authors contributed to the article and approved the submitted version.
Funding
This work was supported in part by Major Science and Technology Projects of Tianjin, China under Grant No.18ZXZNSY00240 and Independent innovation fund of Tianjin University, China under Grant No.2021XYZ-0011.
Conflict of interest
The authors declare that the research was conducted in the absence of any commercial or financial relationships that could be construed as a potential conflict of interest.
Publisher’s note
All claims expressed in this article are solely those of the authors and do not necessarily represent those of their affiliated organizations, or those of the publisher, the editors and the reviewers. Any product that may be evaluated in this article, or claim that may be made by its manufacturer, is not guaranteed or endorsed by the publisher.
References
1. Legrand E, Chappard D, Pascaretti C, Duquenne M, Krebs S, Rohmer V, et al. Trabecular bone microarchitecture, bone mineral density, and vertebral fractures in male osteoporosis. J Bone Miner Res (2000) 15:13–9. doi:10.1359/jbmr.2000.15.1.13
3. Silva BC, Leslie WD, Resch H, Lamy O, Lesnyak O, Binkley N, et al. Trabecular bone score: A noninvasive analytical method based upon the dxa image. J Bone Miner Res (2014) 29:518–30. doi:10.1002/jbmr.2176
4. Brenner DJ. Computed tomography — an increasing source of radiation exposure. New Engl J Med (2007) 8.
5. Rytky SJ, Finnilä MA, Karhula SK, Valkealahti M, Lehenkari P, Joukainen A, et al. Super-resolution and learned perceptual loss allows high-resolution imaging of trabecular bone with clinical cone beam computed tomography. Osteoarthritis and Cartilage (2021) 29:S338–S339. doi:10.1016/j.joca.2021.02.441
6. Helbig L, Omlor GW, Ivanova A, Guehring T, Sonntag R, Kretzer JP, et al. Bone morphogenetic proteins − 7 and − 2 in the treatment of delayed osseous union secondary to bacterial osteitis in a rat model. BMC Musculoskelet Disord (2018) 19:261. doi:10.1186/s12891-018-2203-7
7. Wehrle E, Tourolle né Betts DC, Kuhn GA, Scheuren AC, Hofmann S, Müller R. Evaluation of longitudinal time-lapsed in vivo micro-CT for monitoring fracture healing in mouse femur defect models. Sci Rep (2019) 9:17445. doi:10.1038/s41598-019-53822-x
8. Fiset S, Godbout C, Crookshank MC, Zdero R, Nauth A, Schemitsch EH. Experimental validation of the radiographic union score for tibial fractures (RUST) using micro-computed tomography scanning and biomechanical testing in an in-vivo rat model. J Bone Jt Surg (2018) 100:1871–8. doi:10.2106/JBJS.18.00035
9. Morgan DJ, Dhruva SS, Coon ER, Wright SM, Korenstein D. 2017 update on medical overuse. JAMA Intern Med (2017) 178:110. doi:10.1001/jamainternmed.2017.4361
10. Chen M, Huang Q, Xu W, She C, Xie Z-G, Mao Y-T, et al. Low-dose X-ray irradiation promotes osteoblast proliferation, differentiation and fracture healing. PLoS ONE (2014) 9:e104016. doi:10.1371/journal.pone.0104016
11. Donneys A, Ahsan S, Perosky JE, Deshpande SS, Tchanque-Fossuo CN, Levi B, et al. Deferoxamine restores callus size, mineralization, and mechanical strength in fracture healing after radiotherapy. Plast Reconstr Surg (2013) 131:711e–719e. doi:10.1097/PRS.0b013e3182865c57
12. Jegoux F, Malard O, Goyenvalle E, Aguado E, Daculsi G. Radiation effects on bone healing and reconstruction: Interpretation of the literature. Oral Surg Oral Med Oral Pathol Oral Radiol Endodontology (2010) 109:173–84. doi:10.1016/j.tripleo.2009.10.001
13. Greenspan H. Super-resolution in medical imaging. Comp J (2008) 52:43–63. doi:10.1093/comjnl/bxm075
14. Keys R. Cubic convolution interpolation for digital image processing. IEEE Trans Acoust Speech, Signal Process (1981) 29:1153–60. doi:10.1109/TASSP.1981.1163711
15. Purkait P, Chanda B. Super resolution image reconstruction through bregman iteration using morphologic regularization. IEEE Trans Image Process (2012) 21:4029–39. doi:10.1109/TIP.2012.2201492
16. Yu Z, Thibault J-B, Bouman CA, Sauer KD, Hsieh J. Fast model-based X-ray CT reconstruction using spatially nonhomogeneous ICD optimization. IEEE Trans Image Process (2011) 20:161–75. doi:10.1109/TIP.2010.2058811
17. Ruoqiao Zhang R, Thibault J-B, Bouman CA, Sauer KD, Jiang Hsieh H. Model-based iterative reconstruction for dual-energy X-ray CT using a joint quadratic likelihood model. IEEE Trans Med Imaging (2014) 33:117–34. doi:10.1109/TMI.2013.2282370
18. Jianchao Yang J, Wright J, Huang TS, Ma Y. Image super-resolution via sparse representation. IEEE Trans Image Process (2010) 19:2861–73. doi:10.1109/TIP.2010.2050625
19. Yang W, Zhang X, Tian Y, Wang W, Xue J-H, Liao Q. Deep learning for single image super-resolution: A brief review. IEEE Trans Multimedia (2019) 21:3106–21. doi:10.1109/TMM.2019.2919431
20. Wang Z, Chen J, Hoi SCH. Deep learning for image super-resolution: A survey. IEEE Trans Pattern Anal Mach Intell (2021) 43:3365–87. doi:10.1109/TPAMI.2020.2982166
21. Dong C, Loy CC, He K, Tang X. Learning a deep convolutional network for image super-resolution. In: D Fleet, T Pajdla, B Schiele, and T Tuytelaars, editors. Computer vision – ECCV 2014 lecture notes in computer science. Cham: Springer International Publishing (2014). p. 184–99. doi:10.1007/978-3-319-10593-2_13
22. Shi W, Caballero J, Huszar F, Totz J, Aitken AP, Bishop R, et al. Real-time single image and video super-resolution using an efficient sub-pixel convolutional neural network. In: 2016 IEEE Conference on Computer Vision and Pattern Recognition (CVPR). NV, USA: Las VegasIEEE (2016)–18741883. doi:10.1109/CVPR.2016.207
23. Lai W-S, Huang J-B, Ahuja N, Yang M-H. Deep laplacian pyramid networks for fast and accurate super-resolution. In: 2017 IEEE Conference on Computer Vision and Pattern Recognition (CVPR). Honolulu, HI: IEEE (2017). p. 5835–43. doi:10.1109/CVPR.2017.618
24. Tong T, Li G, Liu X, Gao Q. Image super-resolution using dense skip connections. In: 2017 IEEE International Conference on Computer Vision (ICCV). Venice: IEEE (2017). p. 4809–17. doi:10.1109/ICCV.2017.514
25. Tai Y, Yang J, Liu X. Image super-resolution via deep recursive residual network. In: 2017 IEEE Conference on Computer Vision and Pattern Recognition (CVPR). Honolulu, HI: IEEE (2017). p. 2790–8. doi:10.1109/CVPR.2017.298
26. Mao X-J, Shen C, Yang Y-B. Image restoration using very deep convolutional encoder-decoder networks with symmetric skip connections. In: Proceedings of the 30th International Conference on Neural Information Processing Systems NIPS’16. NY, USA: Red HookCurran Associates Inc. (2016). p. 2810–8.
27. Kim J, Lee JK, Lee KM. Accurate image super-resolution using very deep convolutional networks. In: 2016 IEEE Conference on Computer Vision and Pattern Recognition (CVPR). NV, USA: Las VegasIEEE (2016). p. 1646–54. doi:10.1109/CVPR.2016.182
28. Zhang Y, Li K, Li K, Wang L, Zhong B, Fu Y. Image super-resolution using very deep residual channel attention networks. In: V Ferrari, M Hebert, C Sminchisescu, and Y Weiss, editors. Computer vision – ECCV 2018 lecture notes in computer science. Cham: Springer International Publishing (2018). p. 294–310. doi:10.1007/978-3-030-01234-2_18
29. Lim B, Son S, Kim H, Nah S, Lee KM. Enhanced deep residual networks for single image super-resolution. In: 2017 IEEE Conference on Computer Vision and Pattern Recognition Workshops (CVPRW). Honolulu, HI, USA: IEEE (2017). p. 1132–40. doi:10.1109/CVPRW.2017.151
30. Ledig C, Theis L, Huszar F, Caballero J, Cunningham A, Acosta A, et al. Photo-realistic single image super-resolution using a generative adversarial network. In: 2017 IEEE Conference on Computer Vision and Pattern Recognition (CVPR). Honolulu, HI: IEEE (2017). p. 105–14. doi:10.1109/CVPR.2017.19
31. Wang X, Yu K, Wu S, Gu J, Liu Y, Dong C, et al. Esrgan: Enhanced super-resolution generative adversarial networks. In: L Leal-Taixé, and S Roth, editors. Computer vision – ECCV 2018 workshops lecture notes in computer science. Cham: Springer International Publishing (2019). p. 63–79. doi:10.1007/978-3-030-11021-5_5
32. Wang X, Xie L, Dong C, Shan Y. Real-ESRGAN: Training real-world blind super-resolution with pure synthetic data. In: 2021 IEEE/CVF International Conference on Computer Vision Workshops (ICCVW). Montreal, BC, Canada: IEEE (2021). p. 1905–14. doi:10.1109/ICCVW54120.2021.00217
33. Liu S, Wang Y, Yang X, Lei B, Liu L, Li SX, et al. Deep learning in medical ultrasound analysis: A review. Engineering (2019) 5:261–75. doi:10.1016/j.eng.2018.11.020
34. Litjens G, Kooi T, Bejnordi BE, Setio AAA, Ciompi F, Ghafoorian M, et al. A survey on deep learning in medical image analysis. Med Image Anal (2017) 42:60–88. doi:10.1016/j.media.2017.07.005
35. Shen D, Wu G, Suk H-I. Deep learning in medical image analysis. Annu Rev Biomed Eng (2017) 19:221–48. doi:10.1146/annurev-bioeng-071516-044442
36. Anwar SM, Majid M, Qayyum A, Awais M, Alnowami M, Khan MK. Medical image analysis using convolutional neural networks: A review. J Med Syst (2018) 42:226. doi:10.1007/s10916-018-1088-1
37. Zhang Z, Yu S, Qin W, Liang X, Xie Y, Cao G. Self-supervised CT super-resolution with hybrid model. Comput Biol Med (2021) 138:104775. doi:10.1016/j.compbiomed.2021.104775
38. Dong S, Hangel G, Bogner W, Trattnig S, Rossler K, Widhalm G, et al. High-resolution magnetic resonance spectroscopic imaging using a multi-encoder attention U-net with structural and adversarial loss. In: 2021 43rd Annual International Conference of the IEEE Engineering in Medicine & Biology Society (EMBC). Mexico: IEEE (2021). p. 2891–5. doi:10.1109/EMBC46164.2021.9630146
39. You C, Cong W, Vannier MW, Saha PK, Hoffman EA, Wang G, et al. CT super-resolution GAN constrained by the identical, residual, and cycle learning ensemble (GAN-CIRCLE). IEEE Trans Med Imaging (2020) 39:188–203. doi:10.1109/TMI.2019.2922960
40. Xie X, Wang Y, Li S, Lei L, Hu Y, Zhang J. Super-resolution reconstruction of bone micro-structure micro-CT image based on auto-encoder structure. In: 2019 IEEE International Conference on Robotics and Biomimetics (ROBIO) (Dali, China: IEEE) (2019). p. 1568–75. doi:10.1109/ROBIO49542.2019.8961676
41. Huang B, Xiao H, Liu W, Zhang Y, Wu H, Wang W, et al. MRI super-resolution via realistic downsampling with adversarial learning. Phys Med Biol (2021) 66:205004. doi:10.1088/1361-6560/ac232e
42. Gao S-H, Cheng M-M, Zhao K, Zhang X-Y, Yang M-H, Torr P. Res2Net: A new multi-scale backbone architecture. IEEE Trans Pattern Anal Mach Intell (2021) 43:652–62. doi:10.1109/TPAMI.2019.2938758
43. Ertel D, Kyriakou Y, Lapp RM, Kalender WA. Respiratory phase-correlated micro-CT imaging of free-breathing rodents. Phys Med Biol (2009) 54:3837–46. doi:10.1088/0031-9155/54/12/015
44. Alcantarilla P, Nuevo J, Bartoli A. Fast explicit diffusion for accelerated features in nonlinear scale spaces. In: Procedings of the British Machine Vision Conference 2013. Bristol: British Machine Vision Association (2013). p. 1–13. doi:10.5244/C.27.13
45. Hu J, Shen L, Albanie S, Sun G, Wu E. Squeeze-and-Excitation networks. IEEE Trans Pattern Anal Mach Intell (2020) 42:2011–23. doi:10.1109/TPAMI.2019.2913372
46. Rabbi J, Ray N, Schubert M, Chowdhury S, Chao D. Small-object detection in remote sensing images with end-to-end edge-enhanced GAN and object detector network. Remote Sensing (2020) 12:1432. doi:10.3390/rs12091432
47. Blau Y, Mechrez R, Timofte R, Michaeli T, Zelnik-Manor L. The 2018 PIRM challenge on perceptual image super-resolution. In: L Leal-Taixé, and S Roth, editors. Computer vision – ECCV 2018 workshops lecture notes in computer science. Cham: Springer International Publishing (2019). p. 334–55. doi:10.1007/978-3-030-11021-5_21
48. Ma C, Yang C-Y, Yang X, Yang M-H. Learning a no-reference quality metric for single-image super-resolution. Computer Vis Image Understanding (2017) 158:1–16. doi:10.1016/j.cviu.2016.12.009
49. Mittal A, Soundararajan R, Bovik AC. Making a “completely blind” image quality analyzer. IEEE Signal Process Lett (2013) 20:209–12. doi:10.1109/LSP.2012.2227726
50. Parfitt AM, Mathews CH, Villanueva AR, Kleerekoper M, Frame B, Rao DS. Relationships between surface, volume, and thickness of iliac trabecular bone in aging and in osteoporosis. Implications for the microanatomic and cellular mechanisms of bone loss. J Clin Invest (1983) 72:1396–409. doi:10.1172/JCI111096
51. Kleerekoper M, Villanueva AR, Stanciu J, Rao DS, Parfitt AM. The role of three-dimensional trabecular microstructure in the pathogenesis of vertebral compression fractures. Calcif Tissue Int (1985) 37:594–7. doi:10.1007/BF02554913
52. Ding M, Hvid I. Quantification of age-related changes in the structure model type and trabecular thickness of human tibial cancellous bone. Bone (2000) 26:291–5. doi:10.1016/S8756-3282(99)00281-1
53. Jiang B, Li N, Shi X, Zhang S, Li J, de Bock GH, et al. Deep learning reconstruction shows better lung nodule detection for ultra-low-dose chest CT. Radiology (2022) 303:202–12. doi:10.1148/radiol.210551
54. Blau Y, Michaeli T. The perception-distortion tradeoff. In: 2018 IEEE/CVF Conference on Computer Vision and Pattern Recognition (2018). p. 6228–37. doi:10.1109/CVPR.2018.00652
Keywords: bone microstructure, large-factor, super-resolution (SR), Micro-CT (computed tomography), general adversarial network
Citation: Yu H, Wang S, Fan Y, Wang G, Li J, Liu C, Li Z and Sun J (2022) Large-factor Micro-CT super-resolution of bone microstructure. Front. Phys. 10:997582. doi: 10.3389/fphy.2022.997582
Received: 19 July 2022; Accepted: 27 September 2022;
Published: 13 October 2022.
Edited by:
Renmin Han, Shandong University, ChinaReviewed by:
Jinghao Duan, Shandong First Medical University and Shandong Academy of Medical Sciences, ChinaXibo Ma, Institute of Automation (CAS), China
Copyright © 2022 Yu, Wang, Fan, Wang, Li, Liu, Li and Sun. This is an open-access article distributed under the terms of the Creative Commons Attribution License (CC BY). The use, distribution or reproduction in other forums is permitted, provided the original author(s) and the copyright owner(s) are credited and that the original publication in this journal is cited, in accordance with accepted academic practice. No use, distribution or reproduction is permitted which does not comply with these terms.
*Correspondence: Jinglai Sun, c3VuamluZ2xhaUB0anUuZWR1LmNu
 Hui Yu
 Shuo Wang
 Yinuo Fan
 Guangpu Wang2
 Chong Liu