- 1State Key Laboratory of Water Resources and Hydropower Engineering Science, Wuhan University, Wuhan, China
- 2Key Laboratory of Rock Mechanics in Hydraulic Structural Engineering of the Ministry of Education, Wuhan University, Wuhan, China
The displacement of immiscible fluids in porous media is common in many natural processes and engineering applications. Under quasi-static conditions, the displacement is affected by the geometry of the porous media and wetting condition. In an ordered porous medium, i.e., the pore size is maintained constant in the transverse direction and changes monotonously from the inlet to the outlet; previous works always focused on pore size gradient, but the role of wettability is not well-understood. Here, we investigate the pattern transition in ordered porous media with positive and negative pore size gradients under the wetting condition from imbibition to drainage. We first study the onsets of pore-filling events and then establish a link between these events and the local invasion morphologies at multiple pores under quasi-static conditions. We show that the burst and touch events, previously recognized to destabilize the displacement front, can cause a stable front in the negative and positive gradient porous media. We then link the local invasion morphologies to the displacement patterns, including the compact pattern, taper shape pattern, kite shape pattern, and single-fingering pattern. We propose a model to predict the transitions of these four patterns directly. The model prediction shows that the decreases in contact angles would destabilize the displacement front in the negative gradient porous media and stabilize the displacement front in the positive gradient porous media. We evaluate the predictive model using pore network simulations in this work and experiments in the literature, confirming that it can reasonably predict the pattern transition for immiscible displacements in ordered porous media under quasi-static conditions. Our work extends the classic phase diagram in ordered porous media and is of practical significance for multiphase flow control.
1 Introduction
The flow of immiscible fluids in porous media is a common process in many natural and engineering settings, such as geological carbon sequestration [1, 2], enhanced oil recovery [3, 4], and groundwater contamination [5, 6]. Understanding and controlling the instability of the fluid–fluid interface are beneficial for increasing the efficiency of oil recovery and CO2 sequestration [7–13]. Under quasi-static conditions, the geometry of the porous media is one of the key factors that control fluid invasion. The disorder effect has been sufficiently studied, and we now have a good understanding of the invasion process in disordered porous media [14–24]. Generally, decreasing disorder stabilizes the invasion front for drainage and imbibition conditions [17, 22, 24, 25]. In addition to the disordered porous media, fluid invasion in ordered porous media is also common in many practical applications, such as the removal of water in gradient gas diffusion layers for PEM fuel cells [26, 27] and flow in multi-layered soils [28]. The ordered porous medium signifies that the pore size remains constant in the transverse direction and changes linearly along the flow direction. In such a porous medium, it has been proven that the monotonous change of the pore size along the flow direction can suppress the viscous fingering and capillary fingering or trigger a single fingering [29–32]. The displacement patterns in the ordered porous media are remarkably different from those in the disordered porous media.
Wettability also significantly impacts the displacement pattern and is denoted by the contact angle θ of the invading phase [33–36]. To unravel the fundamentals of the invasion processes under various wetting conditions, Cieplak and Robbins [37, 38] proposed three instability events (burst, touch, and overlap) that describe the pore-scale meniscus motion. Generally, the burst and touch events solely depend on the local geometry of a single throat and are regarded as destabilizing the invasion front, while the overlap event involving the merging of the neighboring menisci suppresses branching of the fluid–fluid interface, thus stabilizing the invasion front [30, 39–45]. However, in an ordered porous medium with decreasing pore size, the burst event is reported to stabilize the invasion front and lead to a compact pattern [31]. This dramatic difference is due to the monotonical decrease of the pore size, which causes the burst event to be more likely to occur near the inlet. In addition, studies on the wettability effect provide a basic understanding that decreasing the contact angle of the invading phase in the range of 45°<θ < 180° will smooth the fluid–fluid interface [46–51]. However, for invasion in the narrow space with decreasing thickness between two parallel plates (a Hele–Shaw cell), inversely, decreasing contact angles will destabilize the invasion front [29]. Again, the impact of wettability on the invasion process in ordered porous media is significantly different from that in disordered porous media, which has not been well-understood.
In this study, we propose a phase diagram to directly predict displacement patterns with different pore size gradients and contact angles. For an ordered porous medium, the pore size remains constant in the same column and changes monotonously from the inlet to the outlet. This change in the pore size leads to the transition of the pore-filling events and eventually affects the displacement pattern. First, we calculate the transition of pore-filling events with different pore sizes and contact angles; second, we link the pore-filling events to local invasion morphologies and observe that, in the negative gradient porous media, the burst and overlap events lead to the compact front and tapered front, respectively. In the positive gradient porous media, however, the burst and touch events lead to the single finger or compact front, and the overlap event leads to the tapered front or widened fingering; third, the displacement patterns are obtained based on the combination of local invasion morphologies, and the theoretical model that predicts the phase diagram of displacement patterns is developed. The theoretical model is evaluated using pore network simulations in this work and experiments in the literature, proving that the theoretical model can reasonably predict displacement patterns in ordered porous media. Finally, we extend the predictive method to square-arranged porous media, indicating that this method can be extended to predict the displacement patterns in different lattice structures. This work improves the understanding of how pore size gradient and wettability impact the fluid invasion in ordered porous media and is of practical significance for multiphase flow control.
2 Transition of pore-filling events
The pore-filling events proposed by Cieplak and Robbins [37, 38] can capture the meniscus motion in porous media and are the basis of the derivation of the theoretical model in this work. These modes are significantly affected by the geometry of porous media. For the ordered porous media considered in this work, the pore size remains constant in the same column and changes monotonously from the inlet to the outlet. This change in the pore size leads to the transition of the pore-filling events and eventually affects the displacement pattern.
Figure 1 shows the transition of pore-filling events and their critical radii of curvature on the d-θ plane; the derivation is shown in Supplementary Text S1. Here, we consider a simple three-post system with the same radius r0, which ranges from 0.1a to 0.4a, where a is the distance between the center of the neighboring posts. Therefore, the normalized pore size d = (a-2r0)/a ranges from 0.2 to 0.8. When the neighboring menisci form an angle with Φ = 180°, the burst event occurs at high contact angles, and the touch event and overlap event occur at low contact angles, where the touch event occupies the small pore size region and the overlap event occupies the large pore size region (Figure 1A). When the neighboring menisci form an angle with Φ = 120°, the touch event is completely covered by the overlap event since the overlap event always has a larger curvature radius. In this case, only the burst and overlap events occur (Figure 1B). To link pore-filling events to fluid invasion, we consider three specific contact angles θ = 50°, 90°, and 150° (dashed lines in Figure 1). For an ordered porous medium with a given pore size gradient along the flow direction, the pore size in each column can be obtained. If the contact angle is also determined, the type of the pore-filling events and their critical radius of curvature can be determined in each column, as shown in Figures 2A, 3A, 4A. Then, by analyzing the effect of pore-filling events on fluid invasion, the local invasion morphologies in each column can be determined, which will be discussed in the next subsection.
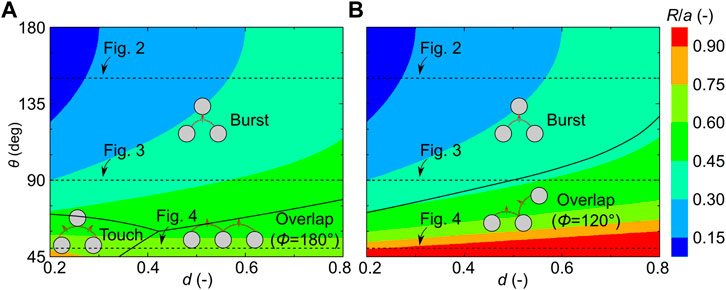
FIGURE 1. Transition of pore-filling events and their critical radii of curvature on the d-θ plane, with d ranging from 0.2 to 0.8 and θ ranging from 45° to 180°. We consider cooperative pore-filling events with Φ = 180° (A) and Φ = 120° (B). Regions of pore-filling events are separated by black lines. The normalized critical radii of curvature R/a are presented with red for a higher value and with blue for a lower value. We present the transition of pore-filling events and their critical radii of curvature in detail at θ = 50°, 90°, and 150° (dash lines), as shown in Figures 2–4.
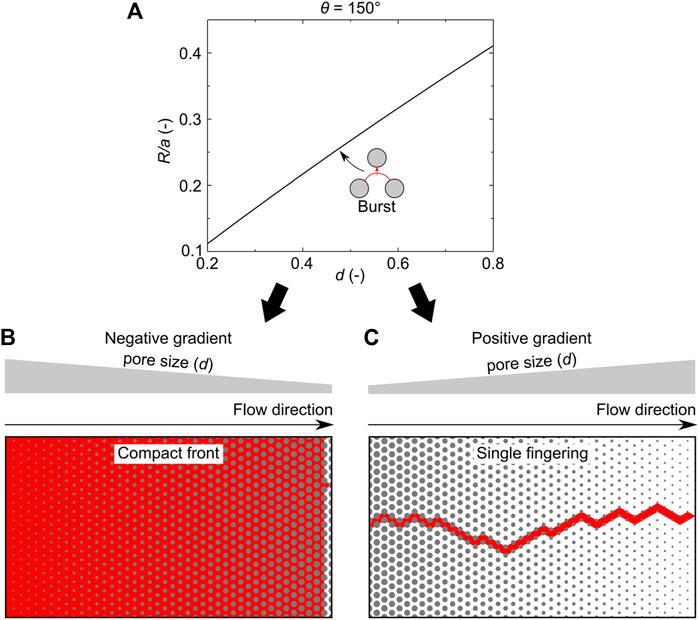
FIGURE 2. Linking pore-filling events to local invasion morphologies at θ = 150°. (A) Normalized critical radius of curvature R/a of the burst event increases with the pore size. (B) In negative gradient porous media, the curvature radius of the burst event decreases along the flow direction, leading to a compact front. (C) In positive gradient porous media, the curvature radius of the burst event increases along the flow direction, leading to a single fingering.
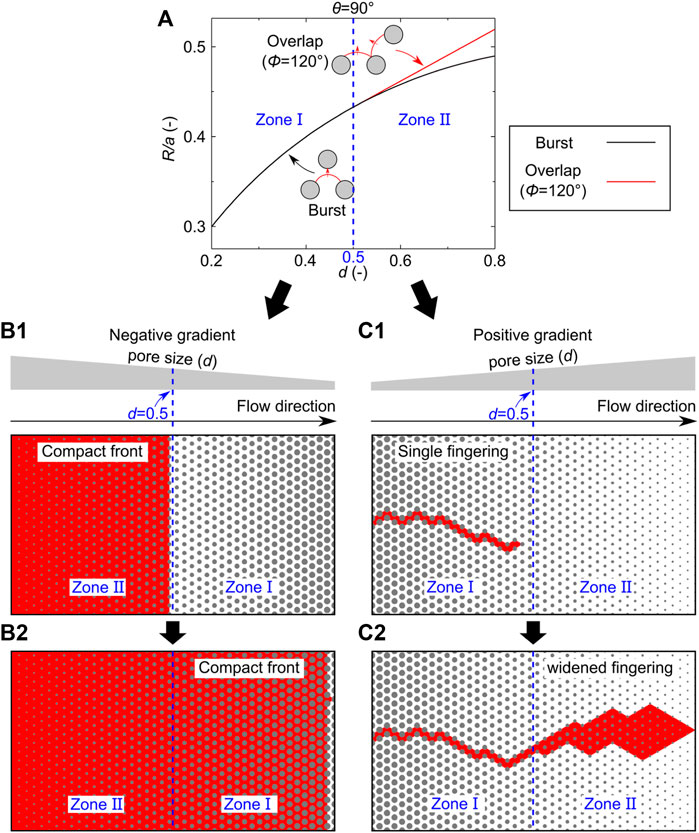
FIGURE 3. Linking pore-filling events to local invasion morphologies at θ = 90°. (A) Critical radius of curvature of pore-filling events varies with pore size. The black line represents the burst event, and the red line represents the overlap event. Only the burst event occurs in zone Ⅰ (0.2 ≤ d ≤ 0.5), and both the burst event and overlap event occur in zone Ⅱ (0.5 < d ≤ 0.8). (B) In negative gradient porous media, the invading phase invades from zone Ⅱ to zone Ⅰ. The invasion in both zones forms a compact invaded region. (C) In positive gradient porous media, the invading phase invades from zone Ⅰ to zone Ⅱ. (C1) In the beginning, a single fingering is obtained. (C2) After the invading phase reaches zone Ⅱ, the fingering is widened by the overlap event.
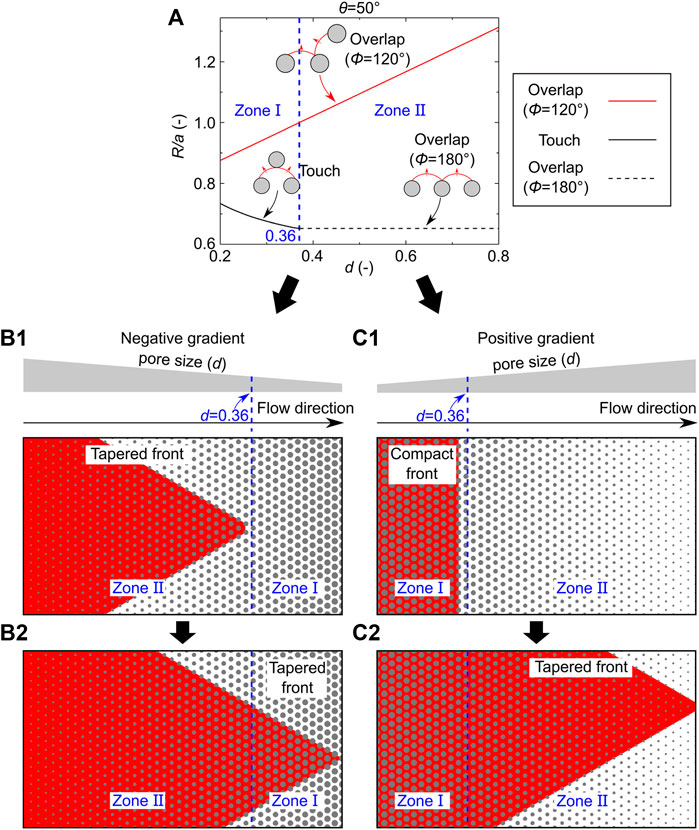
FIGURE 4. Linking pore-filling events to local invasion morphologies at θ = 50°. (A) Critical radius of curvature of pore-filling events varies with pore size. The red line represents the overlap event with Φ = 120°, and the black solid and dashed line represent the touch event and overlap event (Φ = 180°), respectively. The overlap event with Φ = 120° and the touch event occurs in zone Ⅰ (0.2 ≤ d ≤ 0.36), and the overlap events with Φ = 120° and 180° occur in zone Ⅱ (0.36 < d ≤ 0.8). (B) In negative gradient porous media, the invading phase invades from zone Ⅱ to zone Ⅰ. The overlap event with Φ = 120° dominates the fluid invasion, leading to a tapered front in both zones Ⅰ and Ⅱ. (C) In positive gradient porous media, the invading phase invades from zone Ⅰ to zone Ⅱ. (C1) In the beginning, a compact front is obtained. (C2) After the invading phase reaches zone Ⅱ, the overlap event (Φ = 120°) leads to a tapered front.
3 Link pore-filling events to local invasion morphologies
Since the pore size of ordered porous media remains constant in the same column, the same pore-filling events would occur in the local region and have similar impacts on local invasion morphologies. These impacts would change with the pore size from the inlet to the outlet. By analyzing the transition of pore-filling events and their impacts, the local invasion morphologies can be obtained.
We first link pore-filling events to local invasion morphologies at θ = 150°, where only the burst event occurs. Based on the contour plots in Figure 1, the variation of the normalized critical radius of curvature with the pore size is obtained (Figure 2A). Here, the critical radius of curvature of the burst event is calculated using Supplementary Equation S1, with r1 = r2 = a (1-d)/2. For a negative gradient porous medium, as shown in Figure 2B, the pore size decreases along the flow direction. Here, the decreasing radius of curvature causes the invading phase to fill all pores in a column before proceeding to the next column. Therefore, a compact front is obtained. For a positive gradient porous medium, as shown in Figure 2C, the pore size increases along the flow direction. In contrast, the critical radius of curvature of the meniscus increases from the inlet to the outlet, the invading phase preferentially filling the pore in the next column, leading to a single fingering.
We then link pore-filling events to local invasion morphologies at θ = 90°. Based on the contour plots in Figure 1, the pore-filling events can be divided into two zones. As Figure 3A shows, only the burst event occurs in zone Ⅰ (0.2 ≤ d ≤ 0.5), and both the burst event and overlap event occur in zone Ⅱ (0.5 < d ≤ 0.8). The critical radius of curvature of the burst event (black line in Figure 3A) and overlap event (red line in Figure 3A) can be determined using Supplementary Equations S1, S4, respectively. For a negative gradient porous medium, as Figure 3B shows, the invading phase invades from zone Ⅱ to zone Ⅰ. In the beginning, the fluid invasion is dominated by the burst event and overlap event, in which the overlap event always has a larger radius of curvature and will, therefore, occur first (Figure 3A). However, the overlap event needs the neighboring menisci to form an angle with Φ = 120°. This mechanism cannot solely cause the invading phase to proceed to the next column. When there is only one pore left in the given column, the burst event fills the last pore and leads to a compact front (Figure 3B1). Although both the burst event and overlap event can occur simultaneously, the local invasion morphology is determined by the burst event. After the invading phase reaches zone Ⅱ, only the burst event occurs. Again, the decreasing radius of curvature of the burst event leads to a compact front (Figure 3B2).
For a positive gradient porous medium, the invading phase invades from zone Ⅰ to zone Ⅱ. In the beginning, the increasing radius of curvature of the burst event leads to a single fingering (Figure 3C1). After the invading phase reaches zone Ⅱ, the occurrence of the overlap event widens the fingering, leading to a widened fingering (Figure 3C2). In contrast to negative gradient porous media, the impact of the burst event is covered by the overlap event in positive gradient porous media.
Finally, we link pore-filling events to local invasion morphologies at θ = 50°. In this case, the invasion can also be divided into two zones. As Figure 4A shows, the touch event and overlap event (Φ = 120°) occur in zone Ⅰ (0.2 ≤ d ≤ 0.36), and the overlap events with Φ = 120° and 180° occur in zone Ⅱ (0.36 < d ≤ 0.8). Here, the critical radius of curvature of the touch event (black solid line in Figure 4A) and overlap event (red line and black-dashed line in Figure 4A) can be determined using Supplementary Equations S2, S4, respectively. In negative gradient porous media, the invading phase invades from zone Ⅱ to zone Ⅰ. In the beginning, the invasion is dominated by the overlap events with Φ = 120° and 180°. For multiphase flow in the porous media, there are many menisci at the fluid–fluid interface. When the adjacent menisci in some places form an angle with Φ = 180°, the adjacent meniscus in other places may form an angle with Φ = 120°. Therefore, the Φ = 120° and Φ = 180° cases can simultaneously exist at the fluid–fluid interface. Since the overlap events (Φ = 120°) need the neighboring menisci to form an angle with Φ = 120°, it leads to a tapered front of decreasing width (Supplementary Figure S3). On the other hand, the radius of curvature of the overlap event with Φ = 180° does not change with the pore size (Figure 4A), which will not affect the tapered front determined by the overlap event with Φ = 120° (Figure 4B1). When the invading phase reaches zone Ⅰ, the fluid invasion is dominated by the touch event and overlap event. Since the overlap event has a larger radius of curvature than the touch event (Figure 4A), the pores are filled by the overlap event, leading to a tapered front (Figure 4B2). As a result, the overlap event with Φ = 120° can suppress the impacts of both the touch event and overlap event with Φ = 180° in negative gradient porous media.
In positive gradient porous media, the invading phase invades from zone Ⅰ to zone Ⅱ. In zone Ⅰ, the fluid invasion is dominated by the touch event and overlap event. Similar to the invasion process in Figure 3B1, the pores are first filled by the overlap event, and then the touch event fills the last pore, leading to a compact front (Figure 4C1). Therefore, the impact of the overlap event with Φ = 120° is covered by the touch event. After the invading phase reaches zone Ⅱ, again, the overlap event with Φ = 180° does not affect the local invasion morphology and the overlap event with Φ = 120° leads to a tapered front (Figure 4C2).
In summary, the local invasion morphologies in ordered porous media follow the following two rules:
1) The local invasion morphologies are determined by the pore-filling events. When the corresponding pore-filling events can occur at a given contact angle, first, the burst event leads to a compact front in negative gradient porous media (Figures 2B, 3C) and single fingering in positive gradient porous media (Figures 2D, 3C1). This dramatic change in the local invasion morphology is due to the opposite variation of the radius of curvature along the flow direction. Second, the touch event is suppressed by the overlap event (Φ = 120°) in negative gradient porous media. However, in positive gradient porous media, the touch event leads to a compact front (Figure 4C1). Finally, the overlap event (Φ = 120°) has similar impacts in both negative and positive gradient porous media. It leads to a tapered front when adjacent to a compact front and a widened fingering when adjacent to a single fingering channel.
2) When more than one pore-filling events occur simultaneously, the local invasion morphology is determined by a dominant pore-filling event. In negative gradient porous media, the local invasion morphology is first determined by the burst event (Figure 3B1) and then by the overlap event (Φ = 120°) (Figure 4B2). In contrast, in positive gradient porous media, it is first determined by the touch event (Figure 4C1), then by the overlap event (Φ = 120°) (Figure 3C2), and finally by the burst event (Figures 2C, 3C1).
Based on the aforementioned two conclusions and the transition of pore-filling events on the d-θ plane (Figure 1), the transition of the local invasion morphology on the d-θ plane is obtained, as shown in Figure 5. In negative gradient porous media, the burst event leads to a compact front (zone Ⅰ), and the overlap event leads to a tapered front (zone Ⅱ) (Figure 5A). In positive gradient porous media, however, the burst event leads to a single fingering (zone Ⅴ), while the touch event leads to a compact front (zone Ⅲ) (Figure 5B). For the overlap event, it leads to a tapered front or a widened fingering, depending on which local invasion morphology it is adjacent to (zone Ⅳ). Moreover, the displacement patterns in ordered porous media can be determined based on the combination of the local invasion morphologies, which will be discussed in the next section.
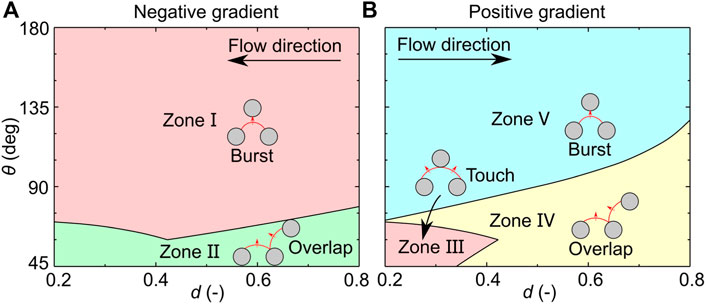
FIGURE 5. Transition of local invasion morphologies on the d-θ plane in negative gradient porous media (A) and positive gradient porous media (B). Red, green, and blue indicate the compact front, tapered front, and single fingering, respectively. Yellow indicates that both the tapered front and widened fingering can occur in this zone, depending on which local invasion morphology it is adjacent to. The flow directions represent that the invasion phase invades along the pore size decreasing direction in the negative gradient porous media and along the pore size increasing direction in the positive gradient porous media.
4 Link local invasion morphologies to displacement patterns
Section 3 describes how the pore-filling events affect the fluid invasion in the ordered porous media, providing a basic understanding of the relationship between the pore-filling events and local invasion morphologies. In this section, we link local invasion morphologies to displacement patterns and establish a theoretical model by combining the pore-filling events and local invasion morphologies to predict the displacement patterns in the ordered porous media.
To investigate the displacement pattern in the ordered porous media, we consider ordered porous media with a constant pore size at the inlet, with dinlet = 0.2 for negative gradient porous media (Figure 6A) and dinlet = 0.8 for positive gradient porous media (Figure 6B). The pore size changes linearly from the inlet to the outlet, with a gradient λ = (doutlet-dinlet)a/L, where doutlet is the pore size in the outlet, a is the distance between the center of neighboring posts, and L is the length of the porous media.
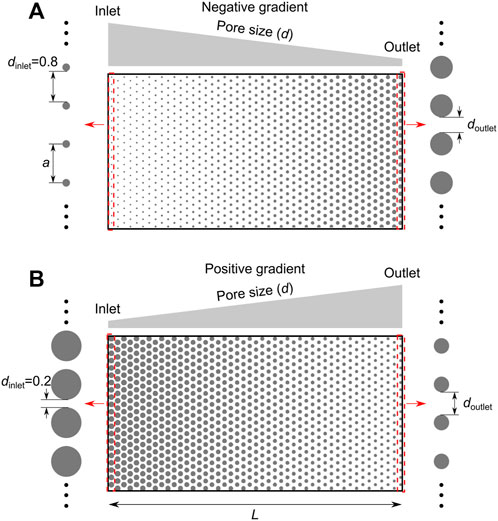
FIGURE 6. Geometry for the ordered porous media. (A) For negative gradient porous media, the pore size remains constant at the inlet, with dinlet = 0.8. (B) For positive gradient porous media, the pore size is dinlet = 0.2 at the inlet. The gradient is calculated by λ = (doutlet-dinlet)a/L. Here, doutlet is the pore size in the outlet, and L is the length of the porous media.
Then, the displacement patterns in such ordered porous media are obtained by enumerating all combinations of local invasion morphologies. For negative gradient porous media, there are four combinations of local invasion morphologies, as shown in Figure 7A. Among all combinations, if the compact front occurs in the end part of the porous media (Figures 7A1,A2), the compact pattern (CP) is obtained (Figure 7B1), and if the tapered front occurs in the end part (Figures 7A3,A4), then the taper shape pattern (TS) is obtained (Figure 7B2). Here, the taper shape pattern (TS) represents the morphology, in which the width of the invaded region decreases along the flow direction. Since the compact front is caused by the burst event (Figure 5A), the transition from the compact pattern (CP) to the taper shape pattern (TS) in negative gradient porous media corresponds to the critical condition for the burst event to occur in the last column:
where Rb,N-1 is the critical radius of curvature of the burst event in the N-1th column, which can be determined by substituting
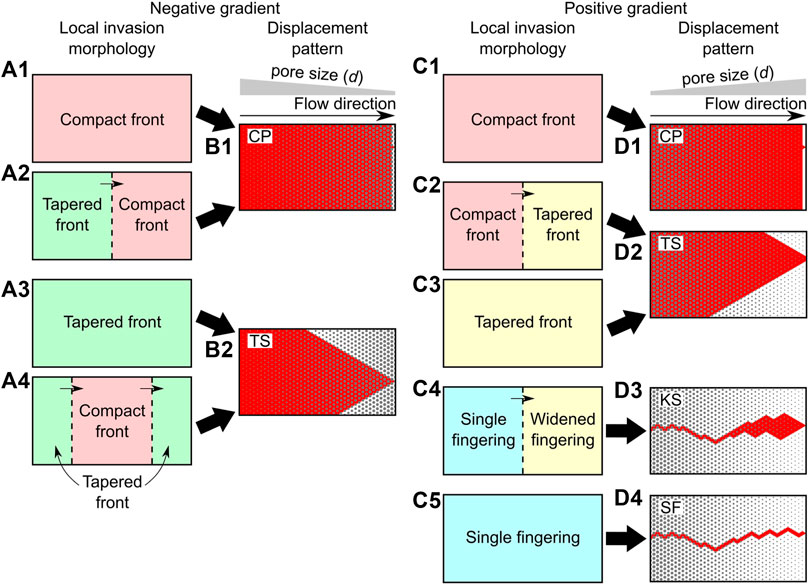
FIGURE 7. Link local invasion morphology to displacement pattern in the ordered porous media. All combinations of the local invasion morphologies are presented in negative gradient porous media (A) and positive gradient porous media (C). Red, green, and blue indicate the compact front, tapered front, and single fingering, respectively. Yellow indicates that in this zone, both the tapered front and the widened fingering can occur. The corresponding displacement patterns are also presented in negative gradient porous media (B) and positive gradient porous media (D).
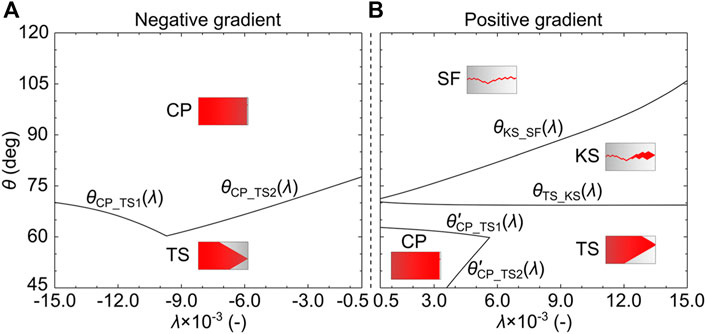
FIGURE 8. Phase diagram of displacement patterns in the λ-θ plane with λ ranging from −1.5 × 10⁻² to −5 × 10⁻⁴ in negative gradient porous media (a) and from 5 × 10⁻⁴ to 1.5 × 10⁻² in positive gradient porous media (B) and with θ ranging from 45° to 120°. The black curves of θCP_TS, θTS_KS, and θKS_SF are the boundary of CP, TS, KS, and SF and are determined by the theoretical model (Eqs 1–4).
For positive gradient porous media, we have five combinations of local invasion morphologies, as shown in Figure 7C. First, if only the compact front occurs (Figure 7C1), the compact pattern (CP) is obtained (Figure 7D1), and second, if the tapered front occurs in the end part of the porous media (Figure 7c2, c3), the taper shape pattern (TS) is obtained (Figure 7D2). Since the compact front is caused by the touch event (Figure 5B), the transition from the compact pattern (CP) to the taper shape pattern (TS) in positive gradient porous media corresponds to the critical condition for the touch event to occur in the last column, which leads to
where Rt,N-1 is the critical radius of curvature of the touch event in the N-1th column, which can be determined by substituting
Third, when the single fingering starts to occur in the first column (Figure 7C4), displacement patterns translate from the taper shape pattern (TS, Figure 7D2) to the kite shape pattern (KS, Figure 7d3). This transition corresponds to the critical condition that the overlap event occurs in the first column:
where Ro,1/2,1 is the critical radius of curvature of the overlap event between the 1/2th column and 1st column, which is determined by substituting
Finally, when only the single fingering occurs (Figure 7C5), the single-fingering pattern (SF) is obtained (Figure 7D4). The transition from the kite shape pattern (KS) to the single-fingering pattern (SF) can be captured under the critical condition for the overlap event to occur in the last column:
where Ro,N-1,N-2 is the critical radius of curvature of the overlap event between the N-1th column and N-2th column, which is determined by substituting
Based on the theoretical model (Eqs 1–4), the phase diagram of displacement patterns is obtained. We evaluate this phase diagram in the next section.
5 Evaluation
To evaluate the theoretical model (Eqs 1–4), we use our previous pore network model [44], which can reasonably simulate the fluid invasion processes in the porous media [30, 44]. The pore network model adapts the geometries as shown in Figure 6. For the negative gradient, the pore size remains constant at the inlet, with dinlet = 0.8, and decreases from the inlet to the outlet. For the positive gradient, the pore size also remains constant at the inlet, with dinlet = 0.2, and increases along the flow direction. The simulations were performed at Ca = 10–15, which can be regarded as the quasi-static condition, i.e., each time the pore adjacent to the meniscus with the largest critical radius of curvature gets filled.
We perform pore network simulations with 45°≤θ ≤ 120° and with -1.5 × 10⁻²<λ < -5 × 10⁻⁴ for negative gradient porous media or 5 × 10⁻⁴<λ < 1.5 × 10⁻² for positive gradient porous media. In total, λ×θ = 14 × 12 = 168 cases are simulated. The simulated displacement patterns are shown in Figure 9 and Supplementary Figures S4, S5. Visually, for negative gradient porous media, TS occurs at low contact angles (θ ≤ 60°) and translates to CP as θ increases (Figure 9; Supplementary Figure S4), indicating that increasing θ destabilizes the fluid invasion. The critical θ that separates TS and CP increases with λ. For positive gradient porous media, CP and TS occur at low contact angles (θ < 70°), while KS and SF occur at high contact angles (θ ≥ 70°). Contrary to negative gradient porous media, increasing θ stabilizes the fluid invasion in positive gradient porous media.
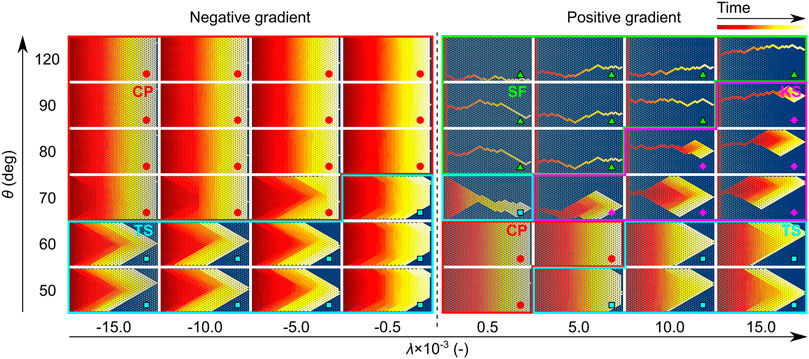
FIGURE 9. Simulated displacement patterns with λ increases from left to right and with θ increases from the bottom to top. The flow direction is from left to right. Red and yellow represents the invading phase, while blue represents the defending phase. The dark red to the light red to the yellow indicates the invasion process of the initial stage and the late time. Red circles, blue squares, purple diamonds, and green triangles represent displacement patterns of the compact pattern (CP), taper shape pattern (TS), kite shape pattern (KS), and single fingering pattern (SF), respectively. The displacement patterns for the 168 simulated cases are shown in Supplementary Figures S4, S5.
We also evaluate the theoretical model (Eqs 1–4) with invading fluid saturation Sbr and normalized fluid–fluid interface Linter/Lmax at the time of breakthrough, as shown in Figure 10. The dots represent the simulated displacement patterns in Figure 9 and Supplementary Figures S4, S5, with green circles for the compact pattern (CP), purple squares for the taper shape pattern (TS), yellow diamonds for the kite shape pattern (KS), and blue triangles for the single fingering pattern (SF). We also present the experimental results in the literature [30], which were performed at θ = 61.5° ± 5° in the positive gradient porous media (stars in Figures 10B,D). The displacement patterns are the compact pattern (CP) at λ = 5 × 10⁻⁴ (gray star) and the taper shape pattern (TS) at λ = 5 × 10⁻³ and λ = 1 × 10⁻² (white stars). From Figure 10, we observe that the compact pattern (CP) has the highest Sbr (Sbr>0.95) and the lowest Linter/Lmax (Linter/Lmax<0.25). In contrast, the single-fingering pattern (SF) has the lowest Sbr (Sbr≤0.05) and the highest Linter/Lmax (Linter/Lmax = 1). It is worth noting that our theoretical model is initially derived from the three same size post system (Figure 1). However, in an ordered porous medium, the radii of these three posts are different. This difference may lead to a decrease in the critical radius of curvature of the touch event along the flow direction in the negative gradient porous media at certain contact angles and gradients (θ = 65°, λ = 1.5 × 10⁻² and 1.2 × 10⁻² in Figures 10A,C), and eventually, lead to the compact pattern (CP). Except for these two cases, the theoretical model (Eqs 1–4) well-predicts the regimes of CP, TS, KS, and SF in the λ-θ plane.
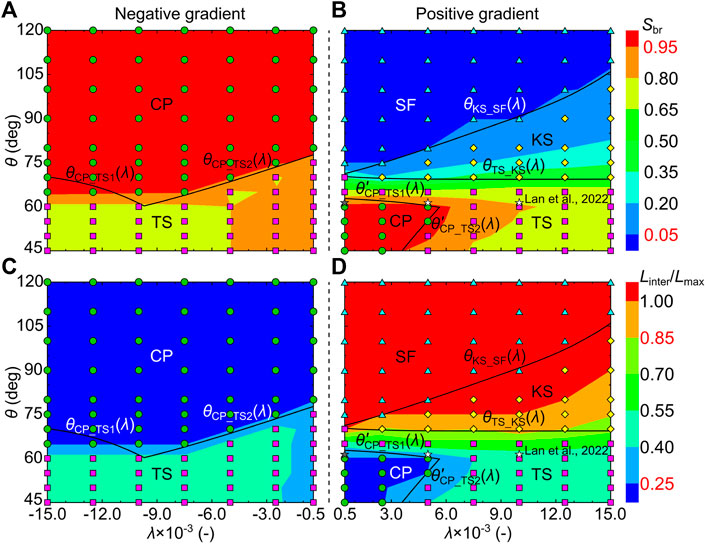
FIGURE 10. Evaluating the theoretical model using numerical simulations in the λ-θ plane and experiments in the literature [30]. The wetting conditions vary from 45° to 120°. The gradients vary from −1.5 × 10⁻² to -5 × 10⁻⁴ for negative gradient porous media and from 5 × 10⁻⁴ to 1.5 × 10⁻² for positive gradient porous media. The contour plots of both saturation Sbr (A,B) and normalized fluid–fluid interface Linter/Lmax (C,D) are presented with red for a higher value and with blue for a lower value. The dots represent the simulated displacement patterns in Figure 9 and Supplementary Figure S4, S5 with green circles for the compact pattern (CP), purple squares for the taper shape pattern (TS), yellow diamonds for the kite shape pattern (KS), and blue triangles for the single fingering pattern (SF). (B,D) Stars represent the experimented displacement patterns in the positive gradient porous media [30], with the gray star for the compact pattern (CP) and white stars for the taper shape pattern (TS).
Based on the contour plots in Figure 10, we further present the details of the wettability impact on Sbr and Linter/Lmax at high gradient (|λ| = 1.25 × 10⁻², Figures 11A,B) and low gradient (|λ| = 5 × 10⁻⁴, Figures 11C,D). The boundaries separating different displacement patterns predicted by the theoretical model (Eqs 1–4) are also presented with vertical dashed lines. Red, yellow, green, and blue represent the predicted displacement patterns of CP, TS, KS, and SF, respectively. For negative gradient porous media, increasing θ increases Sbr and decreases Linter/Lmax at both gradients (Figures 11A,C), thus stabilizing the invasion front and causing the displacement patterns to translate from TS to CP at the critical contact angle, θCP_TS. For positive gradient porous media, on the contrary, a destabilizing effect occurs as θ increases (Figures 11B,D). At a high gradient (λ = 1.25 × 10⁻²), increasing θ decreases Sbr and increases Linter/Lmax, causing the displacement patterns to translate from TS to KS at θTS_KS and then to SF at θKS_SF (Figure 11B). At low gradient (λ = 1.25 × 10⁻²), Sbr and Linter/Lmax first, respectively, slightly increases and decreases with θ in the range of θ < 60° because the displacement patterns translate from TS to CP. Then, increasing θ destabilizes the invasion front, with displacement patterns translating from CP to TS at
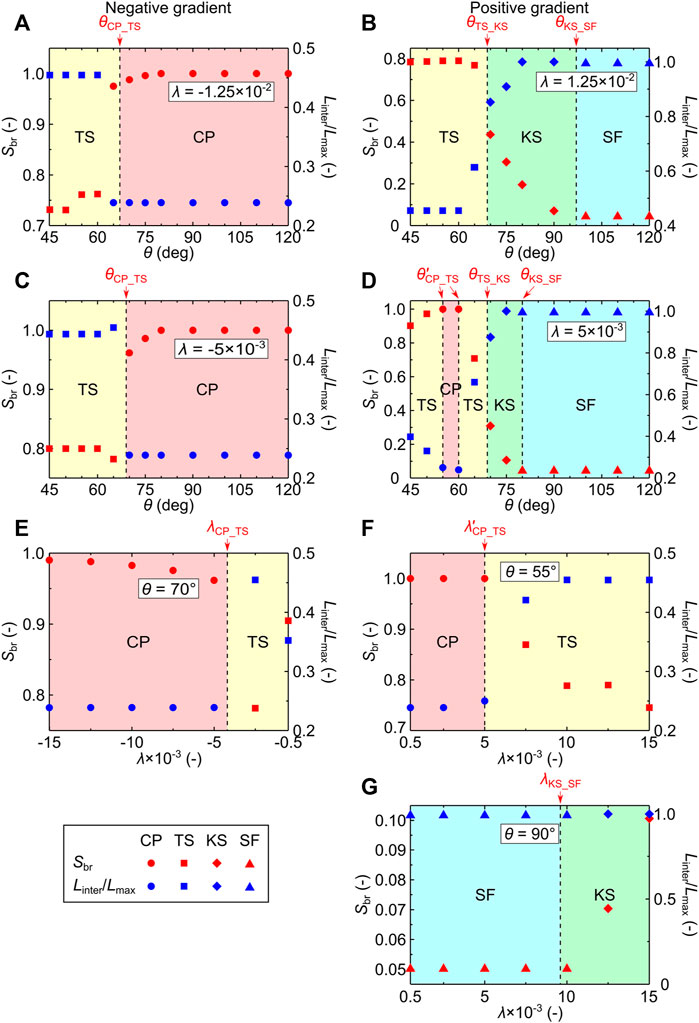
FIGURE 11. Variations of saturation Sbr (red dots) and normalized fluid–fluid interface Linter/Lmax (blue dots) with θ at |λ| = 1.25 × 10⁻² (A,B) and 5 × 10⁻⁴ (C,D), and with λ at θ = 70° (E), 55° (F), and 90° (G). The dots of circles, squares, diamonds, and triangles denote the displacement patterns of CP, TS, KS, and SF, respectively, in Figure 9 and Supplementary Figures S4, S5. The vertical dashed lines denote the boundaries separating different displacement patterns predicted by the theoretical models, and the areas with red, yellow, green, and blue represent the predicted displacement patterns of CP, TS, KS, and SF, respectively.
We also present the details of the gradient impact on Sbr and Linter/Lmax at θ = 70° for negative gradient porous media (Figure 11E) and at θ = 55° and θ = 90° (Figures 11C,D) for positive gradient porous media. Again, the boundaries of λCP_TS and λKS_SF can capture the transitions from CP to TS (Figures 11E,F) and from SF to KS (Figure 11G). Here, λCP_TS are obtained by θCP_TS(λ) = 70° and
6 Extension of the predictive method in square-arranged porous media
We establish a link between pore-filling events and displacement patterns in ordered porous media and propose a predictive method to directly predict displacement patterns based on the pore structure. This method is originally derived based on the pore-filling event in the triangular lattice porous media, with a pore size gradient along the flow direction. For a different lattice structure, the pore-filling events will change. Whether the predictive method can be extended to other lattice structures should be discussed. In this section, we take the square-arranged porous media as an example to discuss how to extend this method in porous media with different lattice structures.
To begin with, we investigate the transition of pore-filling events in square-arranged porous media. Compared with the triangular arrangement, the square arrangement is a loose packing and has significant porosity for the same pore size. Since the touch event is more likely to occur in the geometry with dense packing, it is less likely to occur in the square-arranged porous media. We calculate the critical condition of the touch event in square-arranged porous media, as shown in SI Supplementary Text S3. The touch event can only occur when d < dc, where the maximum value of dc is dcmax = 0.105. For the range considered in this work (45°<θ < 180° and 0.2 < d < 0.8), d < dc cannot be satisfied, indicating that the touch event will not occur. On the other hand, as discussed in Section 3 in the main text, the overlap event with Φ = 180° will not affect the local invasion morphologies, so we only consider the burst event and the overlap event with Φ = 90° in square-arranged porous media.
Similarly, we consider a simple four-post system with the same radius. Figure 12 presents the transition of pore-filling events and their critical radius of curvature in square-arranged porous media. The boundary between the burst event and the overlap event is determined by substituting Φ = 90° into Supplementary Equations S8, S9. The critical radius of curvature of the burst event is determined by substituting r1 = r2 = a (1-d)/2 into Supplementary Equation S1. The critical radius of curvature of the overlap event is determined by substituting r1 = r2 = r3 = a (1-d)/2 and Φ = 90° into Supplementary Equation S4 for θ ≤ 90° and into Supplementary Equation S5 for θ > 90°. By comparing Figure 12 and Figure 1B, we find that the transition of pore-filling events is similar in both pore structures, with only a slight difference in the boundary curves and magnitude of the radius of curvature. In both pore structures, the critical radius of curvature of the burst event increases with the pore size, leading to the burst event being more likely to occur in the region with a larger pore size. The burst event leads to a compact front for the negative gradient porous media and a single fingering for the positive gradient porous media. On the other hand, the overlap event with Φ = 90° in the square-arranged porous media involves the merging of the neighboring menisci and its effect is related to the filling state of the invading phase. Similar to the overlap event with Φ = 120° in the triangle-arranged porous media, the overlap event with Φ = 90° leads to a tapered front when it is adjacent to the compact front and a widened fingering when it is adjacent to the single fingering. Therefore, the relation between the pore-filling events and the local invasion morphologies will not change with lattice structures. In a general porous media with a pore size gradient, as long as the pore structure is determined, the local invasion morphologies can be determined by the calculation of the pore-filling event.
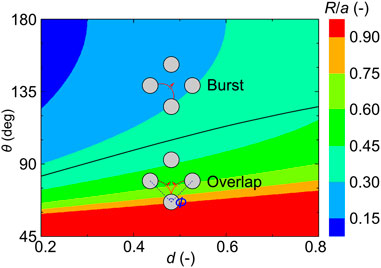
FIGURE 12. Transition of pore-filling events and their critical radii of curvature in square-arranged porous media on the d-θ plane, with d ranging from 0.2 to 0.8 and θ ranging from 45° to 180°. The normalized critical radii of curvature R/a are presented with red for a higher value and with blue for a lower value. The black line represents the boundary between the burst event and the overlap event.
Since the square arrangement is a loose packing, the touch event will not occur in the range considered in this work (45°<θ < 180° and 0.2 < d < 0.8). Therefore, the compact front will not occur in the square-arranged porous media with a positive gradient. Except for this difference, the effects of the burst event and overlap event on the local invasion morphologies are similar to those in the triangle-arranged porous media, that is, the burst event leads to a compact front in the negative gradient porous media and a single fingering in the positive gradient porous media, and the overlap event leads to a tapered front or a widened fingering. The displacement patterns can be predicted by combining the local invasion morphologies, as shown in Supplementary Figure S7. Compared to the triangle-arranged porous media (Figures 7B,D), the displacement patterns are also observed in the square-arranged porous media, except for the compact pattern (CP) under the positive gradient condition.
The transition of the displacement patterns can be determined using the critical condition of pore-filling events. In the negative gradient porous media, the burst event leads to a compact front and the overlap event leads to a tapered front. The transition from the compact pattern (CP) to the taper shape pattern (TS) corresponds to the critical condition for the burst event to occur in the last column:
where Rs,b,N-3/2 is the critical radius of curvature of the burst event in the N-3/2th column, which can be determined by substituting
In the positive gradient porous media, the burst event leads to a single fingering, and the overlap event leads to a tapered front or a widened fingering. The displacement patterns translate from the taper shape pattern (TS) to the kite shape pattern (KS) when the burst event just occurs in the first column:
where Rs,o,3/2 is the critical radius of curvature of the overlap event in the 3/2th column, which is determined by substituting
Finally, the transition from the kite shape pattern (KS) to the single-fingering pattern (SF) can be captured under the critical condition that the overlap event just occurs in the last column:
where Rs,o,N-1,N-2 is the critical radius of curvature of the overlap event in the N-1/2th column, which is determined by substituting
We investigate the displacement patterns in square-arranged porous media with a constant pore size at the inlet, and the pore size changes linearly along the flow direction. We consider dinlet = 0.55 for negative gradient porous media and dinlet = 0.1 for positive gradient porous media, which are consistent with the geometry in the experiments in Lu et al. [31]. They have performed many experiments at different gradients, and the pore structure (dinlet) can only be determined in the two sets of experiments with the largest gradient. Here, we select these two experiments for evaluation [31]. The length of the porous media is L = 25 mm, and the maximum number of columns is N = 30. The phase diagram of the displacement patterns can be determined using Eqs 5–7 and is shown in Figure 13. The phase diagram in the square-arranged porous media (Figure 13) is similar to that in the triangle-arranged porous media (Figure 8), except that the compact pattern (CP) does not occur under the positive gradient condition and the boundary curves of displacement patterns are slightly different because the lattice structure only affects the occurrence of pore-filling events and the magnitude of the radius of curvature, but not the relation between the pore-filling events and the displacement patterns.
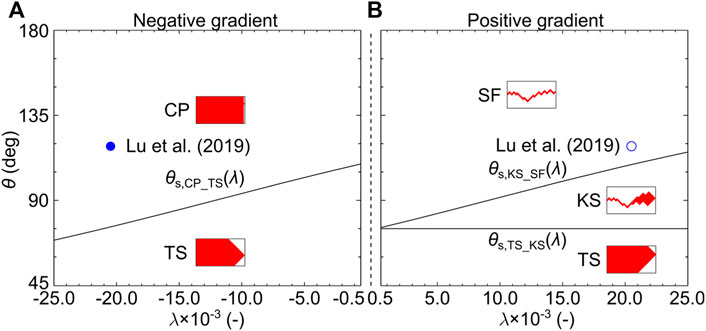
FIGURE 13. Phase diagram of displacement patterns in the square-arranged porous media with λ ranging from −2.5 × 10⁻² to −5 × 10⁻⁴ in negative gradient porous media (A) and from 5 × 10⁻⁴ to 2.5 × 10⁻² in positive gradient porous media (B) and with θ ranging from 45° to 180°. The black curves of θs,CP_TS, θs,TS_KS, and θs,KS_SF are the boundary of CP, TS, KS, and SF in square-arranged porous media and are determined by the theoretical model (Eqs 5–7). Two experiment datasets [31] are selected to evaluate the proposed phase diagram. The displacement patterns of the experiments are shown in blue circles, with the solid circle for the compact pattern (CP) and the open circle for the single-fingering pattern (SF).
We evaluate this phase diagram using the experiments in [31]. The contact angle is determined to be θ = 118.5 ± 5°, according to the fluids and the material of the porous media (SI Supplementary Text S5) [52–55]. The compact pattern (CP) is observed at λ = -2.04 × 10⁻² (solid circle in Figure 13A), and the single-fingering pattern (SF) is observed at λ = 2.04 × 10⁻² (open circle in Figure 13B) [31], in agreement with the theoretical model. It is worth noting that the experiments are performed with a controlled amount of disorder. The difference between the maximum and minimum pore size in a column is dmax–dmin = 5.5 × 10⁻³, much smaller than the gradient (|λ| = 2.04 × 10⁻²), indicating that the predictive method is applicable when the effect of pore size gradient can suppress the effect of disorder. We also evaluate the predictive method using numerical simulations in the literature [32], proving that our predictive method can reasonably predict the displacement patterns when the effect of viscous force is suppressed by the pore size gradient (Supplementary Text S6).
The theoretical model also shows that decreasing contact angle in square-arranged porous media leads to the transition from the compact pattern (CP) to the taper shape (TS) in the negative gradient porous media and from the single-fingering pattern (SF) to the kite shape pattern (KS) to the taper shape (TS) in the positive gradient (Figure 13). Since the existing experiments and numerical simulations are performed under drainage conditions [31, 32], the transition of displacement patterns with wettability has not been observed in these studies and needs to be further evaluated.
In general, the predictive method can be extended to different lattice structures. The lattice structures only affect the occurrence of pore-filling events and the magnitude of the curvature of radius, but not the relation between the pore-filling events and displacement patterns. For a generally arranged porous medium with a pore size gradient along the flow direction, the pore-filling events can be determined through the pore structure, and then the displacement patterns can be predicted as long as the pore size gradient can suppress the effect of disorder. This method directly predicts displacement patterns through pore structures and significantly improves the efficiency of predicting displacement patterns, without performing experiments and simulations.
7 Discussion and concluding remarks
We propose a method to directly predict the displacement patterns in ordered porous media with different pore size gradients and contact angles. The pore size in the ordered porous media remains constant in the same column and changes monotonously along the flow direction, leading to the transition of the pore-filling events and eventually affecting the displacement patterns. We first link the pore-filling events to the local invasion morphologies, providing a basic understanding of how pore-filling events impact the local invasion process in the ordered porous media. In contrast to the well-accepted picture that the burst and touch events always play a role in destabilizing the fluid invasion in disordered porous media, we observe that they can lead to a compact front in negative and positive gradient porous media, respectively. Then, the theoretical models that predict displacement patterns are developed based on the combination of local invasion morphologies. We find that decreasing the contact angle in the range of 45°<θ < 120°, which is regarded as smoothing the invasion front, destabilizes the fluid invasion in the negative gradient porous media. Finally, the theoretical models are evaluated using pore network simulations and experiments in the literature. The phase diagram of displacement patterns predicted by the theoretical models is in good agreement with simulations and experiments in the literature.
This work is an extension of our previous work [30] and aims to present the boundaries of the different displacement patterns. In summary, there are three major differences between these two studies.
1) Our previous work can only predict the displacement efficiency and not displacement patterns. In this work, we investigate the pattern transition in ordered porous media and propose a predictive model to directly predict displacement patterns.
2) The methods are different. To predict the displacement efficiency, our previous work quantitatively calculated the finger width in each column. Then, the displacement efficiency was predicted by the weighted average of the finger width. In this study, we aim to predict displacement patterns so that the finger width need not be calculated; instead, we establish the link between the pore-filling events and the local invasion morphologies and between the local invasion morphologies and the displacement patterns. Therefore, the transition of the displacement patterns can be obtained under the critical condition of pore-filling events. This link between the local invasion morphologies and displacement patterns has not been reported.
3) The scope of the application of the predictive methods is different. The predictive method of the displacement efficiency in our previous work can only be used in the positive gradient porous media with triangle lattice [30]. However, the predictive model of the displacement patterns in this work can be used in both positive and negative gradient porous media. Moreover, we extend the predictive method to square-arranged porous media, indicating that this method can be extended to predict the displacement patterns in different lattice structures.
This work improves the understanding of how pore size gradient and contact angles impact the invasion process and is of practical significance for controlling fluid invasion in ordered porous media, such as multi-layered soils.
Data availability statement
The original contributions presented in the study are included in the article/Supplementary Material; further inquiries can be directed to the corresponding author.
Author contributions
Conceptualization: RH and TL. Investigation: TL and RH. Methodology: TL and RH. Project administration: RH, ZY, and Y-FC. Software: TL and RH. Validation: TL and RH. Writing—original draft: TL and RH.
Funding
We acknowledge support from the National Natural Science Foundation of China (No. 52122905), the Basic Science Center Program for Multiphase Media Evolution in Hypergravity of the National Natural Science Foundation of China (No. 51988101), and the National Natural Science Foundation of China (No. 51925906).
Conflict of interest
The authors declare that the research was conducted in the absence of any commercial or financial relationships that could be construed as a potential conflict of interest.
Publisher’s note
All claims expressed in this article are solely those of the authors and do not necessarily represent those of their affiliated organizations, or those of the publisher, the editors, and the reviewers. Any product that may be evaluated in this article, or claim that may be made by its manufacturer, is not guaranteed or endorsed by the publisher.
Supplementary material
The Supplementary Material for this article can be found online at: https://www.frontiersin.org/articles/10.3389/fphy.2022.993398/full#supplementary-material
References
1. Hu R, Wan J, Kim Y, Tokunaga TK. Wettability impact on supercritical CO2 capillary trapping: Pore-scale visualization and quantification. Water Resour Res (2017) 53:6377–94. doi:10.1002/2017WR020721
2. Ershadnia R, Wallace CD, Soltanian MR. CO2 geological sequestration in heterogeneous binary media: Effects of geological and operational conditions. Adv Geo-energy Res (2020) 4:392–405. doi:10.46690/ager.2020.04.05
3. Morrow N, Mason G. Recovery of oil by spontaneous imbibition. Curr Opin Colloid Interf Sci (2001) 6:321–37. doi:10.1016/S1359-0294(01)00100-5
4. Li G, Zhan L, Yun T, Dai S. Pore‐scale controls on the gas and water transport in hydrate‐bearing sediments. Geophys Res Lett (2020) 47:e2020GL086990. doi:10.1029/2020GL086990
5. Dawson HE, Roberts PV. Influence of viscous, gravitational, and capillary forces on DNAPL saturation. Ground Water (1997) 35:261–9. doi:10.1111/j.1745-6584.1997.tb00083.x
6. Molnar IL, Gerhard JI, Willson CS, O'Carroll DM. Wettability effects on primary drainage mechanisms and napl distribution: A pore-scale study. Water Resour Res (2020) 56:e2019WR025381. doi:10.1029/2019WR025381
7. Hu R, Zhou CX, Wu DS, Yang ZB, Chen YF. Roughness control on multiphase flow in rock fractures. Geophys Res Lett (2019) 46:12002–11. doi:10.1029/2019GL084762
8. Wang Y, Zhang CY, Wei N, Oostrom M, Wietsma TW, Li XC, et al. Experimental study of crossover from capillary to viscous fingering for supercritical CO2-water displacement in a homogeneous pore network. Environ Sci Technol (2013) 47:212–8. doi:10.1021/es3014503
9. Yamabe H, Tsuji T, Liang YF, Matsuoka T. Lattice Boltzmann simulations of supercritical CO2-water drainage displacement in porous media: CO2 saturation and displacement mechanism. Environ Sci Technol (2015) 49:537–43. doi:10.1021/es504510y
10. Bachu S. Review of CO2 storage efficiency in deep saline aquifers. Int J Greenhouse Gas Control (2015) 40:188–202. doi:10.1016/j.ijggc.2015.01.007
11. Hu R, Wu DS, Yang ZB, Chen YF. Energy Conversion reveals regime transition of imbibition in a rough fracture. Geophys Res Lett (2018) 45:8993–9002. doi:10.1029/2018GL079302
12. Borgman O, Fantinel P, Luhder W, Goehring L, Holtzman R. Impact of spatially correlated pore-scale heterogeneity on drying porous media. Water Resour Res (2017) 53:5645–58. doi:10.1002/2016WR020260
13. Chen YF, Wu DS, Fang S, Hu R. Experimental study on two-phase flow in rough fracture: Phase diagram and localized flow channel. Int J Heat Mass Transf (2018) 122:1298–307. doi:10.1016/j.ijheatmasstransfer.2018.02.031
14. Chen JD, Wilkinson D. Pore-scale viscous fingering in porous media. Phys Rev Lett (1985) 55:1892–5. doi:10.1103/PhysRevLett.55.1892
15. King PR. The fractal nature of viscous fingering in porous media. J Phys A: Math Gen (1987) 20:L529–34. doi:10.1088/0305-4470/20/8/008
16. Toussaint R, Lovoll G, Meheust Y, Maloy KJ, Schmittbuhl J. Influence of pore-scale disorder on viscous fingering during drainage. Europhys Lett (2005) 71:583–9. doi:10.1209/epl/i2005-10136-9
17. Holtzman R. Effects of pore-Scale disorder on fluid displacement in partially-wettable porous media. Sci Rep (2016) 6:36221. doi:10.1038/srep36221
18. Borgman O, Darwent T, Segre E, Goehring L, Holtzman R. Immiscible fluid displacement in porous media with spatially correlated particle sizes. Adv Water Resour (2019) 128:158–67. doi:10.1016/j.advwatres.2019.04.015
19. de Anna P, Quaife B, Brios G, Juanes R. Prediction of the low-velocity distribution from the pore structure in simple porous media. Phys Rev Fluids (2018) 2:124103. doi:10.1103/PhysRevFluids.2.124103
20. Fantinel P, Borgman O, Holtzman R, Goehring L. Drying in a microfluidic chip: Experiments and simulations. Sci Rep (2017) 7:15572. doi:10.1038/s41598-017-15718-6
21. Cui GZ, Liu MC, Dai WJ, Gan YX. Pore-scale modelling of gravity-driven drainage in disordered porous media. Int J Multiphase Flow (2019) 114:19–27. doi:10.1016/j.ijmultiphaseflow.2019.02.001
22. Hu R, Lan T, Wei G-J, Chen Y-F. Phase diagram of quasi-static immiscible displacement in disordered porous media. J Fluid Mech (2019) 875:448–75. doi:10.1017/jfm.2019.504
23. Wang ZZ, Chauhan K, Pereira J-M, Gan YX. Disorder characterization of porous media and its effect on fluid displacement. Phys Rev Fluids (2019) 4:034305. doi:10.1103/PhysRevFluids.4.034305
24. Wu D-S, Hu R, Lan T, Chen Y-F. Role of pore-scale disorder in fluid displacement: Experiments and theoretical model. Water Resour Res (2021) 57:e2020WR028004. doi:10.1029/2020WR028004
25. Liu H, Zhang Y, Valocchi AJ. Lattice Boltzmann simulation of immiscible fluid displacement in porous media: Homogeneous versus heterogeneous pore network. s (2015) 27:052103. doi:10.1063/1.4921611
26. Tang H, Wang S, Pan M, Yuan R. Porosity-graded micro-porous layers for polymer electrolyte membrane fuel cells. J Power Sourc (2007) 166:41–6. doi:10.1016/j.jpowsour.2007.01.021
27. Wang XL, Zhang HM, Zhang JL, Xu HF, Tian ZQ, Chen J, et al. Micro-porous layer with composite carbon black for PEM fuel cells. Electrochim Acta (2006) 51:4909–15. doi:10.1016/j.electacta.2006.01.048
28. Ashraf S, Phirani J. Capillary displacement of viscous liquids in a multi-layered porous medium. Soft Matter (2019) 15:2057–70. doi:10.1039/c8sm02114g
29. Al-Housseiny TT, Tsai PA, Stone HA. Control of interfacial instabilities using flow geometry. Nat Phys (2012) 8:747–50. doi:10.1038/nphys2396
30. Lan T, Hu R, Guo W, Wei G-J, Chen Y-F, Zhou C-B. Direct prediction of fluid-fluid displacement efficiency in ordered porous media using the pore structure. Water Resour Res (2022) 58:e2021WR031875. doi:10.1029/2021WR031875
31. Lu NB, Browne CA, Amchin DB, Nunes JK, Datta SS. Controlling capillary fingering using pore size gradients in disordered media. Phys Rev Fluids (2019) 4:084303. doi:10.1103/PhysRevFluids.4.084303
32. Rabbani HS, Or D, Liu Y, Lai C-Y, Lu NB, Datta SS, et al. Suppressing viscous fingering in structured porous media. Proc Natl Acad Sci U S A (2018) 115:4833–8. doi:10.1073/pnas.1800729115
33. Degennes PG. Wetting-statics and dynamics. Rev Mod Phys (1985) 57:827–63. doi:10.1103/RevModPhys.57.827
34. Bonn D, Eggers J, Indekeu J, Meunier J, Rolley E. Wetting and spreading. Rev Mod Phys (2009) 81:739–805. doi:10.1103/RevModPhys.81.739
35. Rucker M, Bartels W-B, Singh K, Brussee N, Coorn A, van der Linde HA, et al. The effect of mixed wettability on pore-scale flow regimes based on a flooding experiment in ketton limestone. Geophys Res Lett (2019) 46:3225–34. doi:10.1029/2018GL081784
36. Suo S, Liu MC, Gan YX. Fingering patterns in hierarchical porous media. Phys Rev Fluids (2020) 5:034301. doi:10.1103/PhysRevFluids.5.034301
37. Cieplak M, Robbins MO. Dynamical transition in quasi‐static fluid invasion in porous‐media. Phys Rev Lett (1988) 60:2042–5. doi:10.1103/PhysRevLett.60.2042
38. Cieplak M, Robbins MO. Influence of contact‐angle on quasi‐static fluid invasion of porous‐media. Phys Rev B (1990) 41:11508–21. doi:10.1103/PhysRevB.41.11508
39. Holtzman R, Segre E. Wettability stabilizes fluid invasion into porous media via nonlocal, cooperative pore filling. Phys Rev Lett (2015) 115:164501. doi:10.1103/PhysRevLett.115.164501
40. Jung M, Brinkmann M, Seemann R, Hiller T, Sanchez de La Lama M, Herminghaus S. Wettability controls slow immiscible displacement through local interfacial instabilities. Phys Rev Fluids (2016) 1:074202. doi:10.1103/PhysRevFluids.1.074202
41. Zhao B, MacMinn CW, Juanes R. Wettability control on multiphase flow in patterned microfluidics. Proc Natl Acad Sci U S A (2016) 113:10251–6. doi:10.1073/pnas.1603387113
42. Singh K, Jung M, Brinkmann M, Seemann R. Capillary-dominated fluid displacement in porous media. Annu Rev Fluid Mech (2019) 51:429–49. doi:10.1146/annurev-fluid-010518-040342
43. Bakhshian S, Rabbani HS, Hosseini SA, Shokri N. New insights into complex interactions between heterogeneity and wettability influencing two-phase flow in porous media. Geophys Res Lett (2020) 47:e2020GL088187. doi:10.1029/2020GL088187
44. Lan T, Hu R, Yang Z, Wu D, Chen Y. Transitions of fluid invasion patterns in porous media. Geophys Res Lett (2020) 47:e2020GL089682. doi:10.1029/2020GL089682
45. Primkulov BK, Pahlavan AA, Fu X, Zhao B, MacMinn CW, Juanes R. Wettability and Lenormand’s diagram. J Fluid Mech (2021) 923:A43. doi:10.1017/jfm.2021.579
46. Hecht I, Taitelbaum H. Roughness and growth in a continuous fluid invasion model. Phys Rev E (2004) 70:046307. doi:10.1103/PhysRevE.70.046307
47. Cottin C, Bodiguel H, Coiln A. Influence of wetting conditions on drainage in porous media: A microfluidic study. Phys Rev E (2011) 84:026311. doi:10.1103/PhysRevE.84.026311
48. Trojer M, Szulczewski ML, Juanes R. Stabilizing fluid-fluid displacements in porous media through wettability alteration. Phys Rev Appl (2015) 3:054008. doi:10.1103/PhysRevApplied.3.054008
49. Hu R, Wan JM, Yang ZB, Chen Y-F, Tokunaga T. Wettability and flow rate impacts on immiscible displacement: A theoretical model. Geophys Res Lett (2018) 45:3077–86. doi:10.1002/2017GL076600
50. Zhao JL, Kang QJ, Yao J, Viswanathan H, Pawar R, Zhang L, et al. The effect of wettability heterogeneity on relative permeability of two-phase flow in porous media: A lattice Boltzmann study. Water Resour Res (2018) 54:1295–311. doi:10.1002/2017WR021443
51. Primkulov BK, Pahlavan AA, Fu X, Zhao B, MacMinn CW, Juanes R. Signatures of fluid–fluid displacement in porous media: Wettability, patterns and pressures. J Fluid Mech (2019) 875:R4. doi:10.1017/jfm.2019.554
52. Chen YF, Fand S, Wu DS, Hu R. Visualizing and quantifying the crossover from capillary fingering to viscous fingering in a rough fracture. Water Resour Res (2017) 53:7756–72. doi:10.1002/2017WR021051
53. Geistlinger H, Zulfiqar B. The impact of wettability and surface roughness on fluid displacement and capillary trapping in 2‐D and 3‐D porous media: 1. Wettability‐Controlled phase transition of trapping efficiency in glass beads packs. Water Resour Res (2020) 56:e2019WR026826. doi:10.1029/2019WR026826
54. Golmohammadi S, Ding Y, Kuechler M, Reuter D, Schlueter S, Amro M, et al. Impact of wettability and gravity on fluid displacement and trapping in representative 2D micromodels of porous media (2D sand analogs). Water Resour Res (2021) 57:e2021WR029908. doi:10.1029/2021WR029908
Keywords: immiscible displacement, pore-filling events, displacement patterns, wettability, ordered porous media
Citation: Lan T, Hu R, Yang Z and Chen Y-F (2022) A pore filling-based model to predict quasi-static displacement patterns in porous media with pore size gradient. Front. Phys. 10:993398. doi: 10.3389/fphy.2022.993398
Received: 13 July 2022; Accepted: 03 October 2022;
Published: 20 October 2022.
Edited by:
Ran Holtzman, Coventry University, United KingdomReviewed by:
Enrico Segre, Weizmann Institute of Science, IsraelBenzhong Zhao, McMaster University, Canada
Copyright © 2022 Lan, Hu, Yang and Chen. This is an open-access article distributed under the terms of the Creative Commons Attribution License (CC BY). The use, distribution or reproduction in other forums is permitted, provided the original author(s) and the copyright owner(s) are credited and that the original publication in this journal is cited, in accordance with accepted academic practice. No use, distribution or reproduction is permitted which does not comply with these terms.
*Correspondence: Ran Hu, d2h1cmFuQHdodS5lZHUuY24=
 Tian Lan
 Ran Hu
 Zhibing Yang1,2