- 1Center for Advanced Laser Technology, Hebei University of Technology, Tianjin, China
- 2Hebei Key Laboratory of Advanced Laser Technology and Equipment, Tianjin, China
- 3Tianjin Key Laboratory of Electronic Materials and Devices, Tianjin, China
As an important branch of non-destructive testing, laser ultrasonic testing has attracted increasing attention in the field of material testing because of its instantaneity, non-contact and wide adaptability. Based on the finite element method, the process of laser-excited ultrasonic signal is numerically simulated, and the influence of angled cracks on the ultrasonic signal is analyzed. In this paper, the effects of the time function, pulse width, and spot radius of a Gaussian light source are analyzed through the transient field. The different modes of the ultrasonic signal are used to fit the crack’s angle, depth, and width to complete the characteristic analysis of the surface angled crack. The results show that the displacement peak-valley difference of the direct Rayleigh wave is negatively correlated with the crack angle. The displacement extremes of the transmitted Rayleigh wave boundary are negatively correlated with crack depth and width, while the transmitted Rayleigh wave is positively correlated. This paper presents a method for the quantitative analysis of surface-angled cracks and provides a theoretical basis for further experimental verification.
1 Introduction
Nondestructive testing has been widely employed in engineering applications as an important tool for evaluating the safety of materials [1–4]. With the development of laser technology, laser ultrasonic testing has become an important nondestructive testing technology [5–8]. This technology has a bright future because of its non-contact [9], wide-band [10], instantaneous [11, 12], and high-sensitivity characteristics [13]. It is not only suitable for remote detection in severe environments [14, 15] but also for real-time online analysis of micro-cracks [16, 17]. In the transmission process of ultrasonic signals, transmission waves, reflection waves and mode conversion waves will appear due to the influence of cracks. We can judge the defect information of the sample by analyzing the reflection or transmission waveform of the crack.
Early researchers analyzed laser ultrasonic detection based on the thermoelastic mechanism through numerical simulation. I. Arias presented a two-dimensional theoretical model for solving the thermoelastic problem and analyzed the effects of the spot radius and pulse width in generating ultrasonic signals [18]. Xu analyzed the thickness detection of an aluminum plate by laser ultrasound in terms of temperature and displacement [19]. Wang analyzed the effects of thermal diffusion and finite spatial and temporal shape pulses of lasers on the generation of elastic waves in non-metallic materials [20]. Guan studied the relationship between the half-width of a pulsed line source laser and the displacement signal characteristics of Rayleigh and Lamb waves [21]. S. Rajagopal studied the effect of the optical attenuation coefficient and laser pulse duration on acoustic pulses [22]. However, the analysis between laser parameters and the excitation ultrasound signals is limited to the displacement field, which should also include the transient temperature field and stress field.
In recent years, laser ultrasonic testing has been widely used for detecting defects. A. Cavuto built a complete axle-wheel detection model that considered the propagation of ultrasound waves into both the solid and air domains [23]. L. Bustamante proposed a hybrid laser and air-coupled ultrasonic method and achieved an error tolerance of 13.6%–17.6% [24]. Before experimental validation, mathematical analysis utilizing the finite element method is an important aspect of the procedure to better understand the physical process of laser ultrasonic detection. There are many studies on laser ultrasonic numerical simulation of angled surface cracks [25, 26]. Based on the finite element method, B. Dutton verified that the transmission and reflection coefficients are related to the Angle and length of the defect [25]. Zeng observed the changes in the amplitude and spectrum of Rayleigh waves to determine the angle of surface cracks [27]. Zhou used the method of fitting the transmission coefficient and reflection coefficient of the Rayleigh wave to quantitatively identify surface-breaking cracks [28]. Wang proved that the peak-to-valley difference of the Rayleigh echo and the crack depth can be linearly fitted [29]. Most of the research only focuses on a specific defect characteristic, which requires systematic quantitative research.
In this paper, a two-dimensional cross-sectional model of aluminum material is established for crack detection. First, the effects of the time function, pulse width, and spot radius on laser ultrasonic detection are verified through transient fields. Second, the quantitative detection of inclined cracks is carried out. The angle, depth, and width of the surface crack are obtained by numerical fitting of different modes of Rayleigh waves. The larger the difference between the peak and valley of the Y displacement of the direct Rayleigh wave (RW), the smaller the crack inclination angle. The displacement extreme value of the transmitted Rayleigh wave boundary (TRW-B) increases as the crack depth or width increases, while the transmitted Rayleigh wave (TRW) decreases. The simulation results show that the maximum error of fitting data of different modes is 4.7%.
2 Theory and numerical models
2.1 Theoretical basis
The ultrasonic signal produced by the pulse light source can be classified as an ablation or thermoelastic mechanism. Ablation occurs when the laser power density exceeds the material damage threshold, evaporating a small amount of plasma and damaging the material in the process. When the laser power density is lower than the material damage threshold, a thermoelastic phenomenon will occur. This thermoelastic mechanism is suitable for nondestructive testing. It can generate ultrasonic waves such as shear-wave (SW), longitudinal-wave (LW), and RW to meet the detection of different defects. Under this mechanism, the material’s surface absorbs light energy rapidly and produces a heating source. The heat energy is continuously conducted to the far-field region and forms an irregular temperature field. The thermoelastic stress generated by temperature-induced thermal expansion becomes the source of excitation for ultrasound.
Since the spatial distribution of the laser beam irradiated on the isotropic sample material is axisymmetric, the physical model can be simplified to solve the two-dimensional plane problem. While ignoring the influence of thermal convection and radiation between the material and environment on the temperature variation, the heat conduction formula can be expressed as [30, 31]:
where
where I0 is the laser peak power density, and the space function f(x) and time function g(t) can be expressed as [32–34]:
where x0 is the abscissa of the pulse action point, r0 is the laser spot radius, and t0 is the rise time of the pulsed laser.
The transient displacement field excited by thermoelastic expansion is expressed as [30, 31]:
where U(r, z, t) is the transient displacement vector of the ultrasonic wave.
The laser thermoelectricity equation is solved by the finite element method. Eq. 7 is expressed as the laser heat conduction finite element equation under the thermoelastic regime:
where [K] is the conduction matrix, [C] is the heat capacity matrix, {T} is the temperature vector, and {
For the propagation of ultrasonic waves, under the condition of ignoring the damping effect, the finite element equation under the linear thermoelastic mechanism is
where [M] is the mass matrix of the material,
2.2 Numerical model
Since the overall structure is symmetrical, the process can be converted from three-dimensional to two-dimensional analysis, and the laser can be converted from a line source to a point source. In this paper, the two-dimensional interface of an aluminum plate is used as the numerical model to simulate the process of laser-excited ultrasound and crack detection. The detection model of laser ultrasound is shown in Figure 1. The whole model is axisymmetric, the length is 20 mm and the width is 7 mm. The origin of the coordinate system was at the center of the aluminum material. The excitation point was set at (0, 3.5), the detection points were set on the surface at (x, 3.5). The vertex of the defect with angle
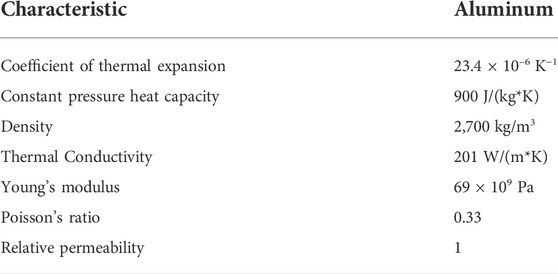
In this model, Gaussian time functions, pulse width and spot radius are studied employing control variables. The influence of these characteristic properties on the excitation process is studied through the transient temperature field, stress field, and resulting displacement. The parameters of the excitation pulse light as well as the physical properties of the aluminum material used in the model are shown in Tables 1, 2. The equations should be inserted in editable format from the equation editor.
3 Simulation results and analysis
The laser excited ultrasound simulation process has two parts: physical thermal and structural mechanics. The pulsed laser is loaded on the aluminum material’s surface and generates a quick heat source. Transient temperature fields are formed due to the rapid accumulation of heat. The heat energy is imparted to the aluminum through thermal expansion, resulting in a transient stress field. The efficiency of excitation can be reflected in the form of stress displacement in the stress field. Therefore, the transient temperature field, stress field, and stress displacement can be used to determine the efficiency of laser excitation ultrasonic signals.
3.1 Laser ultrasonic signal generation
3.1.1 Effect of time function
It is one of the critical parts of the simulation to select reasonably the time function of the Gaussian pulse. Therefore, Gaussian pulse light sources of g1 and g2 with the same energy are analyzed, whose pulse peak power density is P1 and P2, as shown in Figure 2. The pulse power spectrum density of the laser is considerably varied under the same space function as well as different time functions with the same upper and lower limit parameters. Figure 2A has pulse durations of approximately 60 ns, while (B) has a pulse duration of approximately 20 ns However, the maximum value of P1 is less than that of P2. It can be seen that the laser’s power density increases as the time function narrows. As a result, selecting a time function should be based on personal experiment.
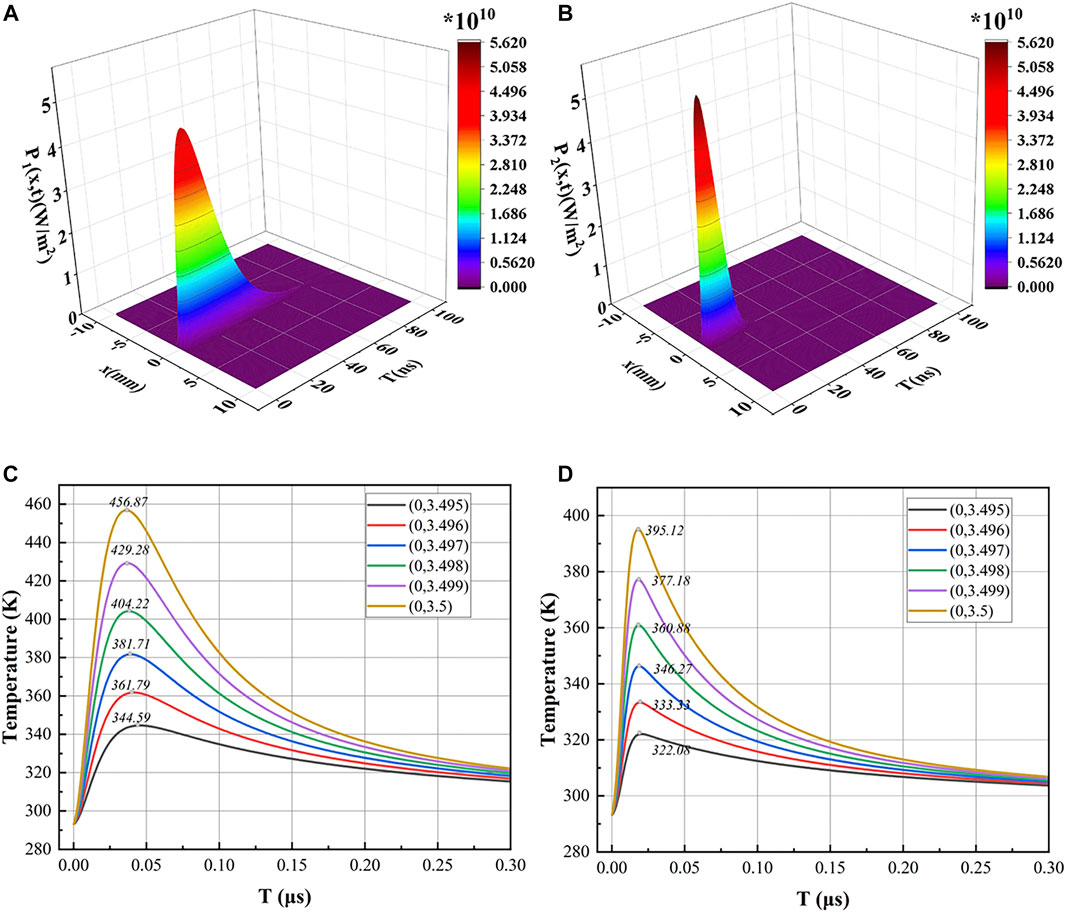
FIGURE 2. Gaussian pulse and temperature field of different time functions: (A) Gaussian pulse of time function g1; (B) Gaussian pulse of time function g2; (C)Temperature field of time function g1; (D) Temperature field of time function g2.
Different time functions induce changes in the temperature field, as seen in Figures 2C,D. The maximum temperature of the g1 function is greater than that of the g2 function at all detection points. The narrower the time function is, the less time there is for light energy to be converted into heat energy. This results in a lower temperature for the laser with a narrow time function at the same energy. Heat conduction causes a decrease in temperature away from the laser radiation point, which leads to differences in temperature at different detection points. The temperature field flattens out within 0.3 μs, which suggests that the temperature gradient is instantaneous. The time function g1 was employed in this simulation because of the higher temperature with a low power density.
3.1.2 Effect of pulse width
After a pulse energy of 0.7 mJ, and a spot radius of 0.4 mm, the pulse width of the laser was adjusted from 1 to 100 ns to evaluate the impact on the laser excitation ultrasound waves. The temperatures of different positions detected by the probe in the transverse and longitudinal directions are shown in Figure 3. Different probes are spaced 2 μm apart in both directions. 533, 483, 456, 423, 403, 389, 378, and 351 K are the maximum temperatures produced by pulse lengths of 1–100 ns at (0, 3.5). The farther away from the (0, 3.5) point, as shown in Figure 3, the lower the temperatures are both transverse and longitudinal. We consider that the difference of the pulse width causes the peak power density to change, resulting in a different temperature acting instantaneously on the sample surface, leading to a change in the transient temperature field.
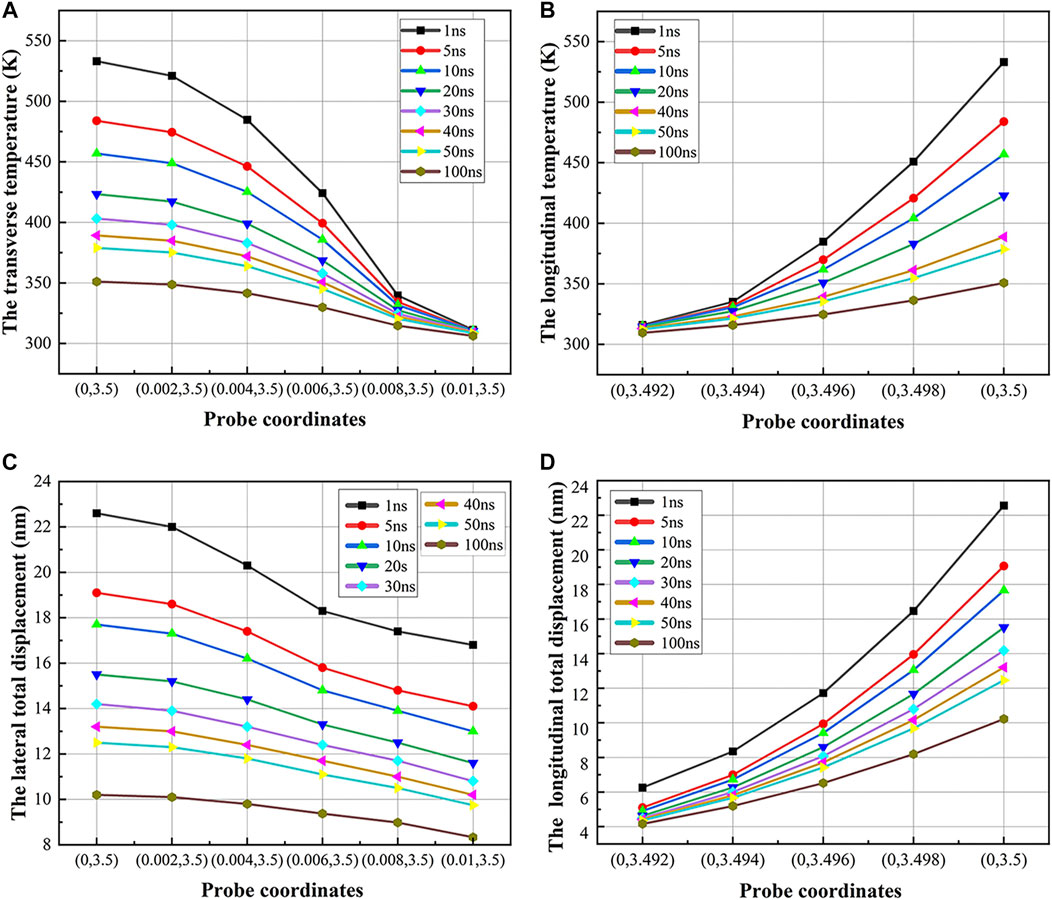
FIGURE 3. Temperature field and displacement field: (A) Temperatures in Transverse; (B) Temperatures in Longitudinal; (C) Total displacement in Transverse; (D) Total displacement in Longitudinal.
The displacements of pulse widths detected by the probe in different directions are shown in Figures 3C,D. Figure 3C indicates that a pulse width of 1 ns reduces the displacement from 22.6 nm at point (0, 3.5) to 16.8 nm at point (0.01, 3.5), while a pulse width of 100 ns reduces the displacement from 10.25 to 8.33 nm. This shift is more noticeable in the longitudinal direction; the displacement created by the laser with a pulse of 1 ns grows from 6.25 to 22.6 nm, whereas the displacement produced by the pulse of 100 ns increases from 1.05 to 4.15 nm, as shown in Figure 3D. The temperature field determines the stress field in the laser radiation region, and a larger temperature gradient results from a faster shift in the longitudinal temperature field; hence, longitudinal stress displacement is more variable. Due to the causal relationship between temperature and stress displacement, the overall trends of temperature and thermal stress wave displacements are similar. That is, the total displacement will decay away from the laser irradiation point. Therefore, it can be seen that the narrower the pulse width of the laser is, the higher efficiency of exciting the ultrasound.
3.1.3 Effect of spot radius
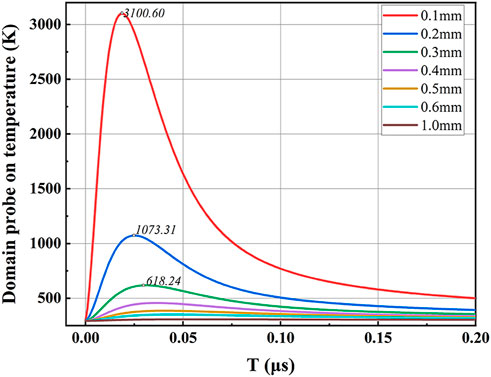
Figure 4 shows the temperature field of the domain probe with varied spot radii after setting a pulse energy of 0.7 mJ and a pulse width of 10 ns The power density of the laser is directly affected by the size of the spot radius. The smaller the spot is, the higher the power density, which causes the temperature to increase. This trend is more noticeable in the smaller radius. In the case of lower than the damage threshold of the sample, the laser with a small spot radius should be selected as much as possible for exciting the ultrasound.
The displacement caused by thermal stress can intuitively reflect the ultrasonic wave’s amplitude. The laser’s incident point was detected to obtain displacement, the X component of which is illustrated in Figure 5A and the Y component in Figure 5B. The thermal expansion force generated by thermal energy interacts with the impeding force in the normal temperature area, resulting in a relatively complex value of the X displacement component. In Figure 5A, the X displacement after 1 μs is expanded, while the 0.05 mm displacement is masked for clarity. As heat energy is transmitted within the material, the X displacement becomes more noticeable. The spot radius is shown to be inversely linked with the X displacement. The longer the X displacement component exists, the smaller the radius is. In Figure 5B, the Y displacement corresponding to the spot radius of 0.3–1.0 mm is magnified for easy observation. The maximum Y displacements from 0.05 to 1.0 mm are 343.2, 142.4, 53.4, 28.4, 17.6, 11.9, 8.6, and 3.3 nm, showing a negative correlation. The smaller the spot is, the more energy is accumulated and the higher the power density. This will result in greater stress displacement in two directions. Usually, the data required in the actual detection is the Y displacement because it can be visualized to reflect the ultrasonic wave.
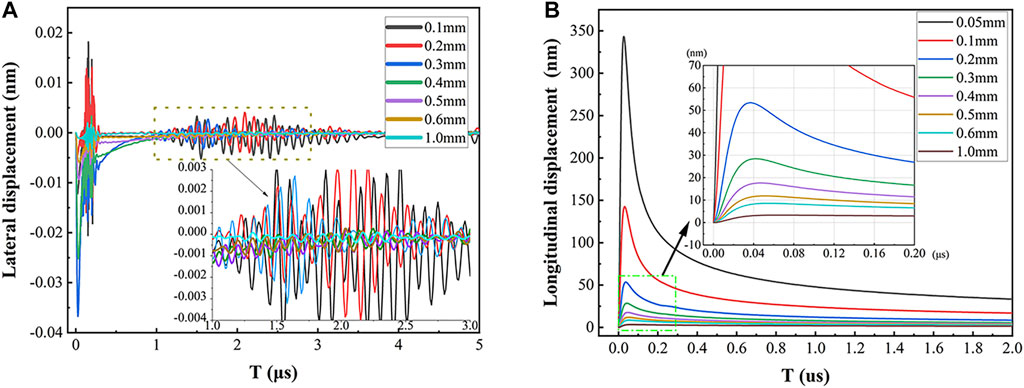
FIGURE 5. Stress displacement: (A) X displacement in the lateral direction; (B) Y displacement in the longitudinal direction.
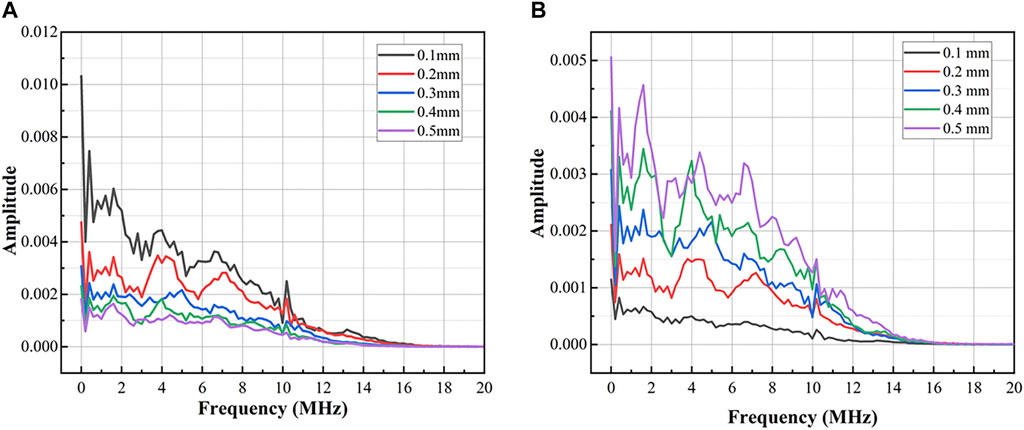
The wide spectrum and high amplitude of ultrasonic is one of the reasons why it is used to detect information. The influence of light spot radius on spectrum under the condition of same energy and same energy density is analyzed here. Figure 6A demonstrates that when the laser loading energy is constant, the smaller the spot, the greater the amplitude of the ultrasonic spectrum, and the information it can contain is easier to be extracted. Figure 6B shows that the spectrum amplitude of the ultrasonic wave will increase with increasing spot radius while the energy density of the laser remains constant. This is because the spatial function of the Gaussian pulse is inversely proportional to the square of the radius of the laser spot, and the size of the radius of the laser spot radiates with the same energy density without attenuation.
3.2 Angled surface crack detection
Angled surface cracks are common surface defects with random angles, widths, and depths, which makes quantitative detection difficult. The surface wave excited by the laser has a good function in detecting defects that is very suitable for the quantitative detection of surface angled cracks. The ratio of the depth of the defect to the ultrasonic center wavelength (D/λ) is used to reflect the detection in various cases to increase rigor [25].
3.2.1 Angle detection
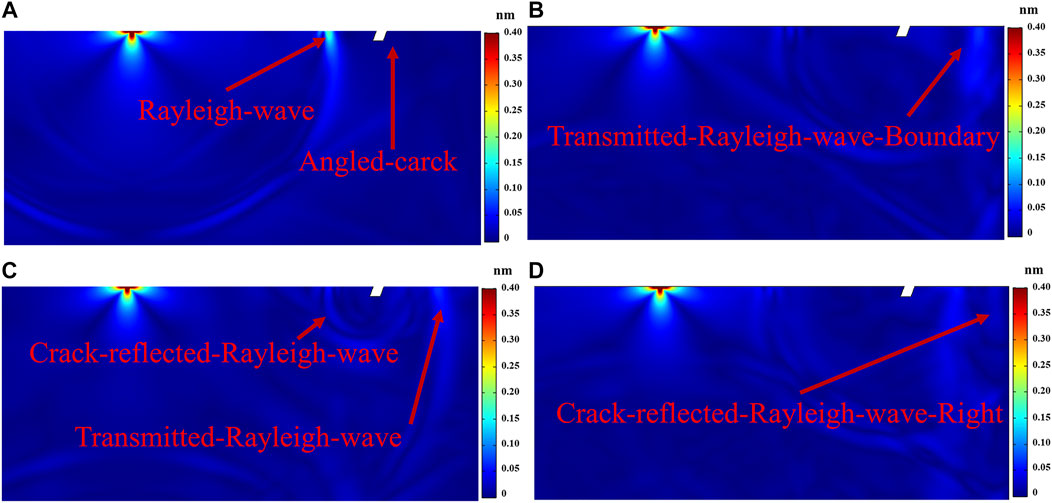
The propagation of ultrasonic waves and the mode transition that occurs following ultrasonic contact with the fracture are illustrated using a 70° crack model. Figure 7A shows different ultrasonic signals after laser irradiation for 2.0 μs The surface wave that directly reaches the crack is defined as the Rayleigh wave (RW), whose waveform is relatively apparent. At 3.1 μs, the ultrasonic waves reach the crack in Figure 7B, where the mode transition occurs. Some waves penetrate the edge of the crack and create a TRW, while other waves are reflected by it. A tiny percentage of waves are changed into mode transition shear or longitudinal waves after reflection; however, the vast majority of waves form crack-reflected Rayleigh wave (CRW). In Figure 7C, when the time reaches 3.75 μs, the TRW on the right side of the crack is reflected by the boundary, and its propagation direction reverses. After reflection, this waveform is called TRW-B. Figure 7D shows that the right-propagating reflection wave will also reflect through the right boundary.
If no special circumstances are specified, the default feature of the crack is that the angle is 70°, the depth is 0.3 mm, the width is 0.3 mm and Rayleigh waves have a wavelength of 890 μm. Different detection points are set to determine the angle of the crack. The Y displacement components obtained from these detection points are shown in Figure 8A. The Y displacement of these detection points from (2, 3.5) to (6, 3.5) is approximately −0.18 to 0.1 nm, while the Y displacement of the detection point (7, 3.5) is a maximum of 4.12 nm and a minimum of −4.7 nm, making it the largest of the detection locations. This phenomenon occurred at both acute and obtuse angles, with acute being the most noticeable. The tilt angle of the surface cracks in the numerical simulation is changed from 20° to 160° for different angle detection. The position (7, 3.5) was chosen as the detecting point to better examine the Y displacement components.
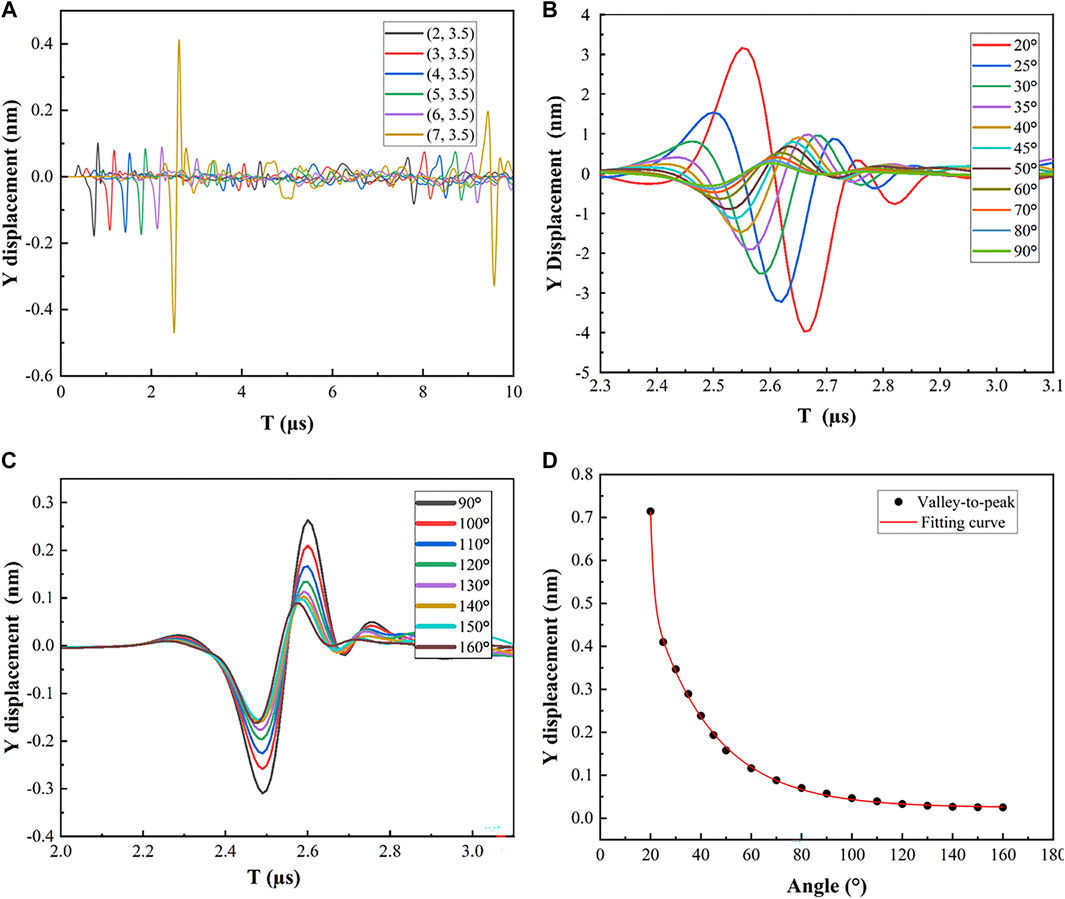
FIGURE 8. Y displacement and Fitting curve: (A) Y displacement components detected by different detection points at 70°; (B) Displacement of cracks with inclination angles from 20° to 90°; (C) Displacement of cracks with inclination angles from 90° to 160°; (D) Peak-valley displacement difference.
The Y displacements at different angles are shown in Figures 8B,C, which mainly reflects the variation in the RW waveform during this period of time. From 20° to 90°, there is a time delay in RW whose amplitude of Y displacement changes significantly as well. Part of the ultrasonic energy is blocked by the angled crack and continuously accumulates at the left end of the crack, which leads to the amplitude change as well as time delays of the RW. If the angle is greater than the right angle, the energy of the RW will no longer accumulate but will directly pass which is only reflected in the amplitude of the ultrasonic Y displacement. Therefore, the main change of the RW is in the displacement amplitude with angle changing from 90° to 160°.
It is a great method to fit correlation curves to solve the problem. The relationship between the angles and RW is obtained by fitting the difference between the peak and valley of RW. The relevant result is shown in Figure 8D. The curve from 20° to 80° is steeper, and the Y displacement difference between the peak and the valley drops from 0.714 to 0.0701 nm, as seen in the figure. The curve from 80° to 160° is flatter, whose Y displacement decreases from 0.714 to 0.0250 nm. The nonlinear curve fitting’s mean square error value (MSE) is 1.771810–9. The fitting regression coefficient R2 reaches 99.947%. The expression of the fitted curve is:
where ΔY is the peak-to-valley displacement difference of the RW and θ is the degree of surface crack. It can be concluded that the higher the peak-valley difference of Rayleigh waves is, the smaller the surface tilt angle. Table 3 shows the data of some defect tilt angles and peak-to-peak values of direct Rayleigh waves under different crack depth/wavelength (D/λ) ratios. The trend is consistent in the case where the ratio of D/λ is less than 1.11. If the depth-wavelength ratio changes, then the peak-to-peak and Angle fitting expressions need to change as well. The quantitative correlation between the surface angle crack and Y displacement is obtained by fitting the curve, proving that it is a feasible analysis method.
3.2.2 Depth detection
By fixing the angle and width of the crack, the depth of the crack was increased from 0.1 to 0.6 mm. The identification of crack depth was discussed in the case that the detection point and excitation point are on the same side and opposite side. The change of crack depth will cause the change of D/λ ratio, so the depth detection will include a variety of ratios.
The detection point and the excitation point were (7, 3.5) and (0, 3.5), which constituted the excitation detection on the same side of the crack. The Y displacement component based on the detection point is shown in Figure 9A. The portion of the displacement from 2.40 to 2.58 μs was RW. The Y displacement from 4.5 to 5.5 μs indicates TRW-B. When TRW-B returns to the detection site, there is a time delay, and the Y displacement gradually decreases. It can be concluded that the deeper the depth is, the longer the propagation path along the crack. Most Rayleigh waves change into body waves, resulting in a decrease in the amplitude of TRW-B, which is more obvious with the increase of crack depth.
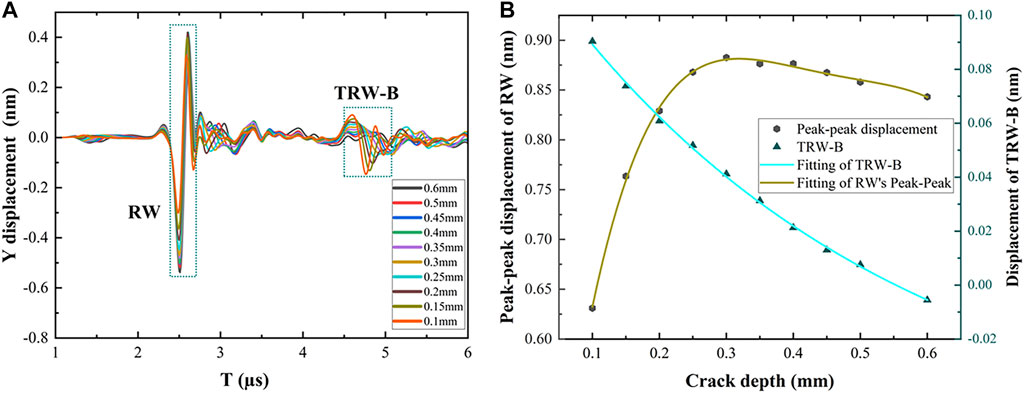
FIGURE 9. Y displacement and Fitting curves: (A) Y displacement of different depths on the same side; (B) Fitting curves of TRW-B (bule) and RW’s Peak-peak (brown).
The maximum Y displacement of TRW-B and the peak-peak displacement of RW were fit to estimate the crack depth. The fitting result was shown in Figure 9B. The RW does not exhibit a monotonous change with increasing depth: it increases and then decreases slightly. The Y displacement decreases from −0.903 to −5.571 nm for TRW-B as the crack depth increases from 0.1 to 0.6 mm, which shows a negative correlation between displacement and crack depth. The expression of the TRW-B and RW fitting curve is:
where Y1 is the maximum Y displacement of TRW-B, Y2 is the peak-peak displacement of RW, D is the depth of crack. The MSE of the fitting curves are 1.392
To place the excitation and detection sites on both sides of the crack, point (8, 3.5) was chosen as the detection point. As the RW goes through the crack, the depth feature information will be included in the waveform. Detecting the Y displacement of TRW or TRW-B on the right side of the crack can provide the necessary information. Figure 10A shows the Y displacement components of the detection points at different times. TRW is the figure from 0.25 to 0.32 μs, and TRW-B is the figure from 0.39 to 0.45 μs TRW and TRW-B are two waveforms of transmitted waves that occur at distinct times. When stress propagates to the right boundary, the propagation direction is reversed, and the original negative stress becomes positive. The stress-related Y displacement is changed from a negative to a positive value, revealing a difference in displacement between the two waveforms.
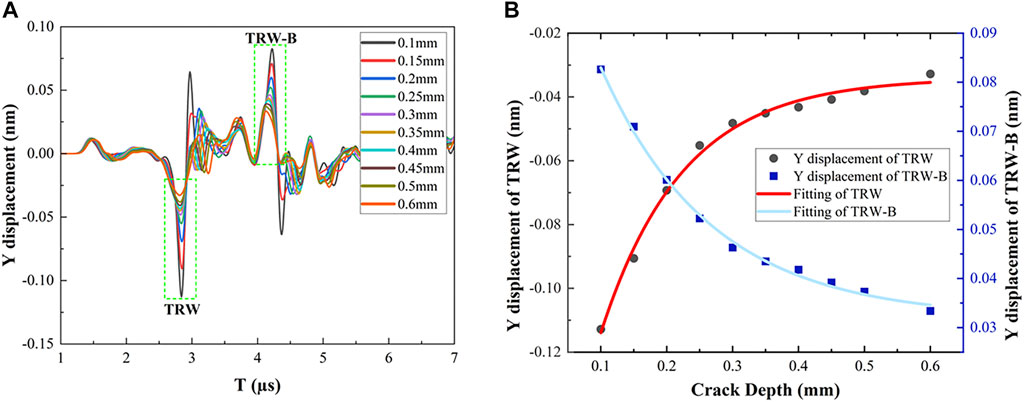
FIGURE 10. Y displacement and Fitting curves: (A) Different depths on the opposite side; (B) Fitting curves for TRW (red) and TRW-B (blue).
These two waveforms were fitted into the same graph, as shown in Figure 10B. TRW’s displacement value increases from −0.1128 to −0.0328 nm when the crack grows from 0.1 to 0.6 mm, while TRW-B’s displacement value drops from 0.0826 to 0.0333 nm. The trend of these two waves is symmetrical, but there is a tiny difference in displacement because the stress is somewhat lost due to the resistance during propagation. Here are the two fitting expression:
where Y3 is the extreme value of the Y displacement of TRW-B, and Y4 is Y displacement of TRW. The fitting curves were convergent, TRW-B with better fitting effect was introduced. Its MSE is 1.03764 × 10⁻¹², and the fitting regression coefficient R2 is 99.591%. The maximum fitting error is 2.7% at a depth of 0.3 mm. TRW-B’s displacement is negatively associated with depth as it increases. The measured Y displacement and fitting the expression can yield the specific defect depth, demonstrating that the depth can be quantitatively detected by fitting the curve. TRW-B is therefore convenient for determining the quantitative depth of cracks on either the same or the opposite side. At the same time, it is also suitable for the D/λ range of 0.11 to 0.67 (depth of 0.1 to 0.6 mm).
3.2.3 Width detection
The angle and depth of the crack were fixed, and the width was increased from 0.1 to 0.6 mm. The identification analysis of the width is still in the same and opposite cases. The ratio of defect depth to Rayleigh wavelength remained 0.34.
Point (6, 3.5) was taken as the detection point to keep the excitation and detection points on the crack’s left side. If the angle and depth of the crack remain unchanged, the structure impeding the propagation of RW will remain unchanged. With the increase in the crack width, the component of the RW converted to transmitted waves will be larger than the component converted to CRW. The Y displacement components at different times are shown in Figure 11A. The waveform at 3 μs is a direct CRW. The waveform at 5 μs is the right CRW, which is reflected by the boundary. To distinguish these two waveforms, they were called CRW-L and CRW-R, respectively. The Y displacement figure from 4.8 to 5.1 μs was magnified to make the relationship between CRW-R and width easier to see. Since the CRW-R wave will pass through the crack twice, the maximum Y displacement of the wave is selected for fitting, whose fitting result is shown in Figure 11B. The expression of the fitting straight line is:
where Y5 is the Y displacement corresponding to CRW-R and W is the crack width. The fitting regression coefficient R2 is 99.149%. The residual sum of squares is 5.0562 × 10⁻¹³. When the crack width is 0.2 mm, the simulated value is 1.93936 × 10⁻² nm, and the fitted value is 1.977822 × 10⁻² nm, which is the farthest point from the fitted straight line with an error of 1.98%. CRW-R is linearly and negatively linked with crack width, according to the fit results. This negative correlation also exists at other inspection points on the left side of the defect.
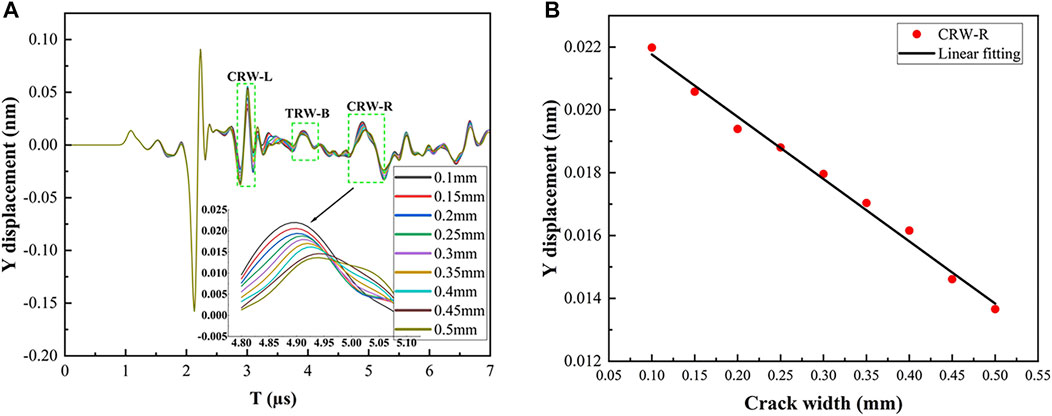
FIGURE 11. Y displacement and Fitting curve: (A) Different widths on the same side; (B) Fitting curve of CRW-R.
The detection point was (8, 3.5) to keep excitation and detection points on both sides of the crack. The Y displacement components of (8, 3.5) at different times are shown in Figure 12A. The waveform of 2.5–3.0 μs in the figure corresponds to TRW, and the waveform of 4.0–4.5 μs corresponds to TRW-B.
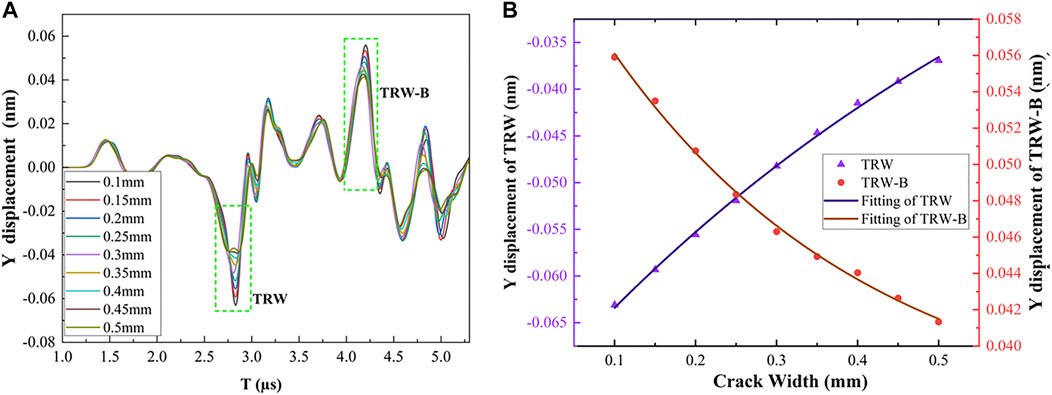
FIGURE 12. Y displacement and Fitting curves: (A) Different widths on the opposite side; (B) Fitting curve of TRW (purple) and TRW-B (red).
The extreme displacement values of TRW and TRW-B are still selected for fitting, as shown in Figure 12B. The displacement of TRW increases from −0.0631 to −0.0369 nm as the crack width grows, indicating a positive correlation between displacement and width. TRW-B’s displacement falls from 0.0559 to 0.0413 nm, indicating a negative correlation.
where Y6 is the min Y displacement of the TRW and W is the width of the crack. Y7 is the TRW-B. TRW with better fitting effect was introduced here. The fitting curve’s fitting regression coefficient R2 is 99.846%. MSE is 1.30148 × 10⁻¹³. The maximum fitting error is 1.18% at a width of 0.4 mm. The essential crack width information can be obtained by detecting the TRW’s Y displacement extremes and substituting the calculation, which also proves that TRW can quantitatively identify the width while the D/λ is 0.34.
4 Discussion
Most researchers rely on expensive scanning equipment and interferometers to analyze defects in metals. Their method is effective, but it is also costly, which is one of the reasons why laser ultrasonic inspection has not yet reached the industrial scale. In the past, researchers have often used frequency spectrum or correlation transmission or reflection coefficients to qualitatively analyze the defects on metal surfaces without quantitative analysis. This paper proposed a simpler method to quantitatively detect surface angled defects.
This method aims at the mode transformation and the related waveform displacement signal change during the propagation of ultrasonic waves for the angled cracks, which has good applicability. Not only did the approach of fitting different waveform displacements complete the angle detection, but it also accomplished the depth and width detection. As a result, this method can be used to quantitatively characterize metal surface defects and the maximum error between fitting and simulation is only 2.7%. The advantage of this method is that a certain defect-displacement fitting expression can be obtained according to the relationship between the measured ultrasonic displacement and the defect. According to these fitting expressions, the defect information can be obtained from the measured displacement in the subsequent measurement, reducing a certain amount of work, and all the data are carried out in the time domain. The method could be confirmed with a low-cost transducer and lead to the use of laser ultrasound as a simple industrial detection approach.
In the simulation model, parameters such as 0.7 mJ, 10 ns, and 0.4 mm were chosen to match the laser equipment used in later studies. The physical structure of the model was isotropic material and was analyzed using the a-scan results. The research will be more inclined to detect multilayer materials or composites in future experiments and investigations.
5 Conclusion
In this paper, the finite element model is used to simulate the process of laser ultrasonic testing. The effects of time function, laser pulse width and spot radius on the excitation ultrasound signals were investigated. Different time functions have a considerable impact on the power spectrum density, according to the simulation results. The narrower the pulse width and the smaller the spot radius, the more efficient it is to excite the ultrasound signals, and this trend is more pronounced for small pulse width or radius parameters. Different Rayleigh wave modes can be useful in detecting surface-angled cracks. The peak-to-valley difference of the Y displacement component of the RW is related to the angle of the crack. When the excitation and detection points are on the same side of the crack, the width and depth of the crack can be quantified by fitting the Y displacement of the CRW. The maximum error of the fit is 1.98% for defect feature values within 0.5 mm. When the excitation and detection points are on the opposite side, the extreme value of the Y displacement of TRW or TRW-B is related to the depth and width of the crack, whose max error of the fitting curve is 2.7%.
This paper provides a feasible method for quantitative crack analysis. The method has the potential to reduce detection analysis time and could facilitate the application of laser ultrasound detection.
Data availability statement
The raw data supporting the conclusions of this article will be made available by the authors, without undue reservation.
Author contributions
Conceptualization, SH and YL; methodology, YL; software, SH; validation, LX, QH, and JD; formal analysis, SH; investigation, YW; resources, ZL; data curation, SH; writing—original draft preparation, SH; writing—review and editing, SH; visualization, YL; supervision, YL; project administration, YL; funding acquisition, YL. All authors have read and agreed to the published version of the manuscript.
Funding
This research was funded in part by National Natural Science Foundation of China (61905062); in part by China Postdoctoral Science Foundation (2020M670613); and in part by Hebei Postdoctoral Scholarship Project (B2020003026).
Conflict of interest
The authors declare that the research was conducted in the absence of any commercial or financial relationships that could be construed as a potential conflict of interest.
Publisher’s note
All claims expressed in this article are solely those of the authors and do not necessarily represent those of their affiliated organizations, or those of the publisher, the editors and the reviewers. Any product that may be evaluated in this article, or claim that may be made by its manufacturer, is not guaranteed or endorsed by the publisher.
References
1. Zhang J, Zhao X, Yang B, Li J, Liu Y, Ma G, et al. Nondestructive evaluation of porosity in additive manufacturing by laser ultrasonic surface wave. Measurement (2022) 193:110944. doi:10.1016/j.measurement.2022.110944
2. Gupta R, Mitchell D, Blanche J, Harper S, Tang W, Pancholi K, et al. A review of sensing technologies for non-destructive evaluation of structural composite materials. J Compos Sci (2021) 5(12):319. doi:10.3390/jcs5120319
3. Vyas J, Kažys RJ. A review on nondestructive techniques and characteristics of composite materials for the aerospace system. In: MATEC web of conferences: 8th EASN-CEAS international workshop on manufacturing for growth & innovation; September 4-7, 2018; Glasgow, UK. Scotland, UK: EDP Sciences (2018).
4. Zhenwei Z, Jing X, Rui J, Yinghong W, Hao G, Siyi H, et al. Terahertz non-destructive testing and imaging of high-voltage cables. Front Phys (2022) 10:893145. doi:10.3389/fphy.2022.893145
5. Bai Z, Zhang Z, Wang K, Gao J, Zhang Z, Yang X, et al. Comprehensive thermal analysis of diamond in a high-power Raman cavity based on fvm-fem coupled method. Nanomaterials (2021) 11(6):1572. doi:10.3390/nano11061572
6. Chen H, Bai Z, Yang X, Ding J, Qi Y, Yan B, et al. Enhanced stimulated brillouin scattering utilizing Raman conversion in diamond. Appl Phys Lett (2022) 120(18):181103. doi:10.1063/5.0087092
7. Davis G, Nagarajah R, Palanisamy S, Rashid RAR, Rajagopal P, Balasubramaniam K. Laser ultrasonic inspection of additive manufactured components. Int J Adv Manuf Technol (2019) 102(5):2571–9. doi:10.1007/s00170-018-3046-y
8. Werr F, Eppelt U, Müllers L, Ligny D. Ultra-short-pulse laser filaments for float glass cutting: Influence of laser parameters on micro cracks formation. Front Phys (2022) 10:862419. doi:10.3389/fphy.2022.862419
9. Nomura K, Deno S, Matsuida T, Otaki S, Asai S. In situ measurement of ultrasonic behavior during lap spot welding with laser ultrasonic method. NDT E Int (2022) 130:102662. doi:10.1016/j.ndteint.2022.102662
10. Keyvani M, Garcin T, Militzer M, Fabregue D. Laser ultrasonic measurement of recrystallization and grain growth in an L605 cobalt superalloy. Mater Characterization (2020) 167:110465. doi:10.1016/j.matchar.2020.110465
11. Selim H, Delgado-Prieto M, Trull J, Picó R, Romeral L, Cojocaru C. Defect reconstruction by non-destructive testing with laser induced ultrasonic detection. Ultrasonics (2020) 101:106000. doi:10.1016/j.ultras.2019.106000
12. Choe J, Jon S, Ryang W, Yun Y, So J. Research of laser ultrasonic defect statistics recognition technology based on radial basis function neural network. Opt Laser Technol (2022) 150:107857. doi:10.1016/j.optlastec.2022.107857
13. Kusano M, Hatano H, Watanabe M, Takekawa S, Yamawaki H, Oguchi K, et al. Mid-infrared pulsed laser ultrasonic testing for carbon fiber reinforced plastics. Ultrasonics (2018) 84:310–8. doi:10.1016/j.ultras.2017.11.015
14. Jiang Y, Wang H, Chen S, Tian G. Visual quantitative detection of rail surface crack based on laser ultrasonic technology. Optik (2021) 237:166732. doi:10.1016/j.ijleo.2021.166732
15. Klose J, Esch S, Kohns P, Ankerhold G. Assessment of the intrinsic damage to refractory materials at high temperatures using the laser ultrasonic pulse method. Open Ceramics (2022) 9:100221. doi:10.1016/j.oceram.2022.100221
16. Yi K, Liu P, Park S-H, Sohn H. Femtosecond laser ultrasonic inspection of a moving object and its application to estimation of silicon wafer coating thickness. Opt Lasers Eng (2022) 148:106778. doi:10.1016/j.optlaseng.2021.106778
17. Guo H, Zheng B, Liu H. Numerical simulation and experimental research on interaction of micro-defects and laser ultrasonic signal. Opt Laser Technol (2017) 96:58–64. doi:10.1016/j.optlastec.2017.04.004
18. Arias I, Achenbach JD. Thermoelastic generation of ultrasound by line-focused laser irradiation. Int J Sol Structures (2003) 40(25):6917–35. doi:10.1016/S0020-7683(03)00345-7
19. Xu B, Shen Z, Ni X, Lu J. Numerical simulation of laser-generated ultrasound by the finite element method. J Appl Phys (2004) 95(4):2116–22. doi:10.1063/1.1637712
20. Wang J, Shen Z, Xu B, Ni X, Guan J, Lu J. Numerical simulation of laser-generated ultrasound in non-metallic material by the finite element method. Opt Laser Technol (2007) 39(4):806–13. doi:10.1016/j.optlastec.2006.01.009
21. Guan J. Numerical simulation of ultrasonic guide waves generated by pulsed laser line source in thermoelastic regime. J Nanjing Univ Posts Telecommunications (Natural Science) (2011) 31(3):108–13. doi:10.14132/j.cnki.1673-5439.2011.03.002
22. Rajagopal S, Cox BT. Modelling laser ultrasound waveforms: The effect of varying pulse duration and material properties. J Acoust Soc Am (2021) 149(3):2040–54. doi:10.1121/10.0003558
23. Cavuto A, Martarelli M, Pandarese G, Revel GM, Tomasini EP. Fem based design of experiment for train wheelset diagnostics by laser ultrasonics. Ultrasonics (2021) 113:106368. doi:10.1016/j.ultras.2021.106368
24. Bustamante L, Jeyaprakash N, Yang C-H. Hybrid laser and air-coupled ultrasonic defect detection of aluminium and cfrp plates by means of Lamb mode. Results Phys (2020) 19:103438. doi:10.1016/j.rinp.2020.103438
25. Dutton B, Clough AR, Rosli MH, Edwards RS. Non-contact ultrasonic detection of angled surface defects. NDT E Int (2011) 44(4):353–60. doi:10.1016/j.ndteint.2011.02.001
26. Zhang Z, Zhao J, Pan Y. Surface circular-arc defects interacted by laser-generated Rayleigh wave. Ultrasonics (2020) 103:106085. doi:10.1016/j.ultras.2020.106085
27. Zeng W, Qi S, Liu L, Yao Y. Research on laser-generated Rayleigh waves with angled surface crack by finite element method. Optik (2019) 181:57–62. doi:10.1016/j.ijleo.2018.11.105
28. Zhou Z, Zhang K, Zhou J, Sun G, Wang J. Application of laser ultrasonic technique for non-contact detection of structural surface-breaking cracks. Opt Laser Technol (2015) 73:173–8. doi:10.1016/j.optlastec.2015.04.026
29. Wang Y, Han S, Yu Y, Qi X, Zhang Y, Lian Y, et al. Numerical simulation of metal defect detection based on laser ultrasound. IEEE Photon J (2021) 13(4):1–9. doi:10.1109/JPHOT.2021.3097997
30. Park S-H, Liu P, Yi K, Choi G, Jhang K-Y, Sohn H. Mechanical properties estimation of additively manufactured metal components using femtosecond laser ultrasonics and laser polishing. Int J Machine Tools Manufacture (2021) 166:103745. doi:10.1016/j.ijmachtools.2021.103745
31. Liu P, Nazirah AW, Sohn H. Numerical simulation of damage detection using laser-generated ultrasound. Ultrasonics (2016) 69:248–58. doi:10.1016/j.ultras.2016.03.013
32. Dai Y, Xu BQ, Luo Y, Li H, Xu GD. Finite element modeling of the interaction of laser-generated ultrasound with a surface-breaking notch in an elastic plate. Opt Laser Technol (2010) 42(4):693–7. doi:10.1016/j.optlastec.2009.11.012
33. Zeng W, Yao Y, Qi S, Liu L. Finite element simulation of laser-generated surface acoustic wave for identification of subsurface defects. Optik (2020) 2019:163812. doi:10.1016/j.ijleo.2019.163812
Keywords: laser ultrasound, nondestructive testing, angled crack, Rayleigh wave, stress displacement
Citation: Han S, Lian Y, Xie L, Hu Q, Ding J, Wang Y and Lu Z (2022) Numerical simulation of angled surface crack detection based on laser ultrasound. Front. Phys. 10:982232. doi: 10.3389/fphy.2022.982232
Received: 30 June 2022; Accepted: 25 July 2022;
Published: 19 August 2022.
Edited by:
Liyuan Chen, Hilase Center, CzechiaReviewed by:
Dario Vangi, University of Florence, ItalyYulai She, Guilin University of Electronic Technology, China
Pengbai Xu, Guangdong University of Technology, China
Copyright © 2022 Han, Lian, Xie, Hu, Ding, Wang and Lu. This is an open-access article distributed under the terms of the Creative Commons Attribution License (CC BY). The use, distribution or reproduction in other forums is permitted, provided the original author(s) and the copyright owner(s) are credited and that the original publication in this journal is cited, in accordance with accepted academic practice. No use, distribution or reproduction is permitted which does not comply with these terms.
*Correspondence: Yudong Lian, eWRsaWFuQGhlYnV0LmVkdS5jbg==
 Shiwei Han
 Yudong Lian
 Luyang Xie1,2
 Qi Hu
Qi Hu Yulei Wang

