 Ge Peng1
 Lihua Lu
- 1Center for Precision Engineering, School of Mechatronics Engineering, Harbin Institute of Technology, Harbin, China
- 2National Key Laboratory of Science and Technology on Tunable Laser, Harbin Institute of Technology, Harbin, China
- 3Chongqing Research Institute of Harbin Institute of Technology, Chongqing, China
To alleviate laser-induced threats in the high-power laser systems, it is necessary to understand the debris propagation process and distribution characteristics, then take protection and cleaning strategies to sustain an ultra-clean environment. This work presents an experimental investigation of the sputtering behaviors of the laser-induced fused silica debris to clarify their longitudinal propagation and bottom distribution on the millimeter scale. Two types of polished surfaces with more than three orders of magnitude differences in surface roughness were adopted. The result reveals the centralized/decentralized distribution and the ability of long-range movement of debris propelled by the melting and mechanical failure. The maximum largest dispersion angle (LDA) appears at 18J/cm2 for debris within 10–20 μm from the Two Sides polished surface; debris <30 μm dominate the major quantity in the longitudinal propagation, and their centralization ability profoundly relies on the laser fluence and the surface roughness of the target; the diameter of the debris with long-range movement generally below 20 μm. This study could guide for establishing the overall dynamic cleaning strategy inside the high-power laser systems.
1 Introduction
Inertial confinement fusion driven by laser sources is one of the main ways to achieve controllable nuclear fusion [1]. As a vital device for achieving nuclear fusion, Final Optics Assembly contains a considerable volume and complex structure with high requirements for manufacturing, assembly, and control precision. Especially, an ultra-clean level in the ambient environment should be maintained throughout the operation process. When a local disturbance, such as thermal deformation of components near the target room [2], position errors of connectors caused by external controllers [3], and particulate threats [4], occurs in Final Optics Assembly, it may cause irreversible damage to the optical components, which consequently reduces the total flux through the beam tunnel [5–7].
The particulate threat from laser-induced debris has attracted considerable attention. Generally, the optical components employed in the Final Optics Assembly have been cleaned carefully before assembly. However, the clean level of the ambient environment around the optical components declines gradually due to the laser-induced debris, which can, in turn, contaminate the adjacent optical components [8]. Therefore, understanding the generation mechanism of laser-induced debris and then alleviating their spatial propagation has become a pressing issue in high-power laser systems.
Plenty of research has been conducted in this area, and academics generally believe that the generation of laser-induced debris is mainly related to the laser beam and the base it has affected. It has reached a consensus that the output of debris is exponential to the incident fluence when the base material and its surface roughness are identical [8–11], and the debris sputtering behaves varied with different materials and surface roughness, even though the incident fluence remains the same [12, 13].
There are many propagation forms of laser-induced debris in the high-power systems [14–16], such as rectilinear movements with high speeds, fog sprayings with long-time suspension, sedimentation, etc. These propagation forms will result in different interactions between debris and optical components surfaces, and introduce various damage. Hence, online cleaning and protection strategies should be developed accordingly, such as applying plasma to thoroughly blow away scattered adsorption on the optics surfaces [9, 17], and dual dynamic airflow to block high-speed impacts on the system [14].
Usually, there are many different beam chambers in the Final Optics Assembly, and the optical components and the laser fluences vary in these chambers. For example, the switch window made of fused silica has a surface roughness of less than 0.5 nm. It is located in the beam chamber between the transport mirrors LM1-LM2, receiving 1ω light (1,053 nm wavelength). While the disposable debris shield, which is made of borosilicate glass with roughness higher than 20 nm, encounters 3ω light (351 nm wavelength) in the target chamber [18]. Consequently, the emitted debris have various initial states at the beginning of the sputtering process, such as initial speed, sputtering direction, and dimensions [19]. Moreover, the debris have varying morphologies because the process of their formation also varies. For instance, the melting process may produce sphere-like debris, while the late laser-induced blast could cause flat-shaped flakes with large aspect ratios [20, 21]. It implies each type of debris has its own motion trail, resulting in a highly complicated spatial propagation behavior inside the beam chamber.
Observing the spatial propagation process of laser-induced debris has been an extremely challenging problem in this area. Currently, several approaches investigate the spatial propagation behavior of laser-induced debris. For example, the time-resolved imaging method is based on the multiple exposures taken at different time delays [22–24]. It can obtain short-range movement traits like initial velocity, ejection time, and rotation rate as long as the resolution is sufficient. However, this approach has failed to observe the whole propagation process because the field of view is limited to several millimeters. A PIV (Particle Image Velocimetry) system based on continuous imaging would solve this problem. Nevertheless, this approach is suitable for observing slow objects, which are commonly seen in the free-throw experiment in the fluid medium [25]. Predicting the debris trajectories by aerodynamic calculation based on the drag and lift coefficients can reappear the entire propagation [26, 27], while the debris diameter in this experiment should be large enough to fit with the ambient environment.
Since the propagation forms incessantly change along with the spraying distance, arranging successive 3D collectors along debris moving distances is considered to be a practical method. However, this method suffers from high measurement errors when sampling at a long distance because of the few outputs generated from the target base. In addition, when sampling at a short distance, the collector is vulnerable to the laser beam, bringing a secondary measurement error into the system. Furthermore, how to balance the resolution and field of view is still a challenge in debris observation.
To solve these problems, our group has previously developed an array strategy to detect debris density along the propagation direction [28]. However, the scope still belongs to 2D and cannot reflect the overall spatial scattering. Therefore, this work designed an intact 3D experiment, including longitudinal propagation and bottom distribution. Additionally, a multi-image stitching technique was used to overcome the observation weakness. The base made of fused silica was utilized to generate debris with various initial states by setting three orders of magnitude differences in the surface roughness. The input laser was performed as a single pulse with a triple frequency, imitating random scattering within the beam chamber. The debris morphology was analyzed, accompanied by a heat absorption model based on the roughness differences, to explain the experimental phenomena.
2 Experimental arrangement
2.1 Laser-induced debris
A schematic description of the laser-induced breakdown system is shown in Figure 1 below. All pulses of laser beams equipped with Gaussian profiles were produced from an Nd: YAG (Neodymium-doped: Yttrium Aluminium Garnet) pump laser (Quanta-Ray, Newport-Spectra Physics) operating at 355 nm, 12 ns full width half maximum. The laser beam was focused by a 150 mm focal length lens forming a 0.6 mm diameter spot (average) on the rear surface of the target (fused silica, 50 mm2 × 50 mm2, 5 mm thickness). A He-Ne laser was used as a guide to collimating the pump beam before each shot. During one pulse shot, a feedback system giving back information about input energy and deviation of waveform shape was installed along the beamline between the pump and focal lens. Three typical incident laser fluences (average): 18, 53, and 79 J/cm2 that can cause bulk damage were utilized in the experiment, representing random damage usually found in high-power systems. The 18 and 79 J/cm2 respectively represent the fluence below and exceeding damage thresholds by random scattering light and local self-focus, respectively [29]. 53 J/cm2 was chosen as a control group. Two types of targets with more than three orders of differences in surface roughness were utilized to bias the damage mechanism toward thermal ablation and complex coupling (mainly including thermal ablation and fracture failure). Since the former only polished the back surface during manufacturing, we call this type of target One-Side polished or OS polished. Likewise, we call the latter Two-Side polished or TS polished because both the front and rear surfaces of the target were polished during manufacturing, which is widely used in high-power systems. For the OS polished target, the root mean square height (signed Sq) of the polished surface (front) is lower than 0.5 nm, while the other side is lower than 0.8 μm. For the TS target, the Sq of both polished surfaces is lower than 0.5 nm.
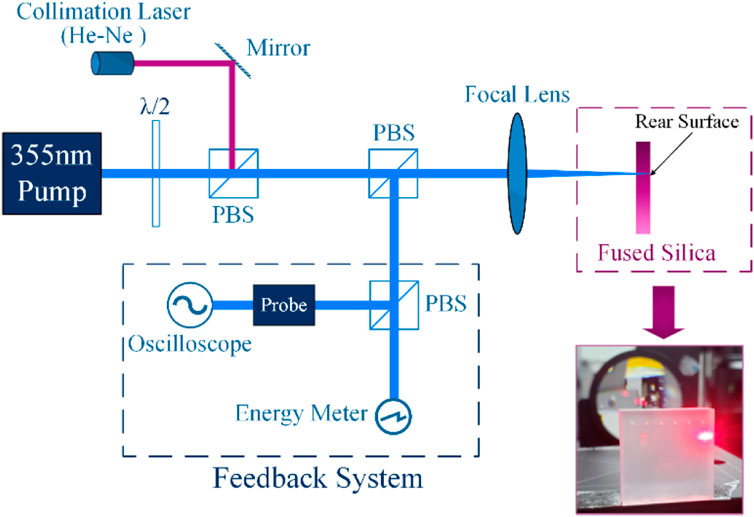
FIGURE 1. Arrangement of laser-induced breakdown system and target setting.
2.2 Longitudinal propagation
A schematic arrangement for detecting the Largest Dispersion Angle (LDA) of debris, which reflects the maximum sputtering limit, is shown in Figure 2A. A glass tube was fixed on a bracket behind the rear surface of the target. The front side of the tube and the rear surface of the target (controlled by a 3D electric displacement platform with 100 μm resolution) were placed in the same plane. After each pulse, the tube was transferred into a color-Inverted Optical Microscope (IOM, Nikon ECLIPSE MA 200, max resolution 0.022 μm/px in ×100) for detection. Since the curvature of the tube determines the effective field of view in the IOM, more rotations are required to detect the entire circumference of the tube because of the small field of view if the curvature is large. Meanwhile, a large curvature also indicates the small radius of the tube. This allows less time for debris to land on the wall, i.e., errors caused by air fluctuation are reduced. To balance the factors above, 18 rotations were adopted to achieve an intact inspection (18 images were captured) at one laser fluence. The effective field of view area for each image was close to 2.49 mm2 × 1.79 mm2. The LDA (θ) value in each image was calculated by arctan (r/s), where “r” is the tube radius, and “s” is the minimum axial distance of the detected debris; all of them are labeled in orange. The debris diameter was measured directly by the IOM during the inspection. Measurement error of the diameter due to calibration, non-planar focus, and overlaps in width were below 15%. After these operations, the platform (target) was moved to a new position with a 3 mm interval for the next pulse.
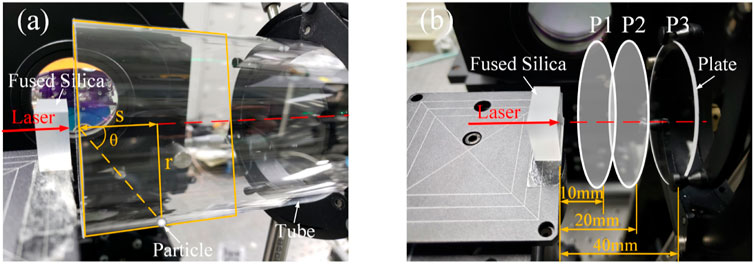
FIGURE 2. Arrangement on the propagation experiment: (A) largest dispersion angle; (B) longitudinal propagation.
Figure 2B shows a schematic prototype to study sputtering properties in the longitudinal direction. A series of glass plates (2 mm thickness, 50 mm diameter, fuses silica, TS polished with a fine hole in the center to alleviate secondary damage, respectively labeled P1, P2, and P3, with only one used in a pulse) was individually settled behind the rear surface of the target at a distance of 10, 20, and 40 mm to collect debris. The laser beam was directed through the center of the plates. After each laser pulse, the plate was scanned by the IOM with stitching technology, whose intact view is about 7.0 mm2 × 4.8 mm2 at a resolution of 0.48 μm/px. Each stitched image was post-processed by binarization (threshold 0.485) methods with errors less than 10% from chromatic aberration. The debris diameter in this experiment was measured from the stitched image after binarization by Image Pro. The threshold in this step automatically adjusts with each image. Measurement error of diameter due to pixel resolution of each image, boundary connection, and debris overlap was within 25%. Unlike sputtering inside the tube, the propagation process exposed to ambient air tended to interfere with the surroundings. Thus, the Fan Filter Unit system was turned off before each pulse and reopened immediately as the plate was removed. Additionally, a particle counter (Beckman Coulter, MET ONE 6000) was set near the plate to continuously compare the debris concentration with ambient standards. In this experiment, a clean level of 100° was maintained.
2.3 Bottom distribution
Figure 3 illustrates the arrangement of the bottom collection of debris. A glass board (TS polished) with a core area divided into nine regions labeled one to nine was set on the 3D platform. Each region occupies 24 mm2 × 24 mm2. The platform was adjusted to make the laser beam pass through the center of the Nos. 4, 5, and 6 regions. The distance between the upper surface of the board and the laser spot was maintained at 40 mm. To reintroduce the laminar flow environment in the beam chamber of the final optics assembly, the Fan Filter Unit system was kept open with a uniform speed of 0.3 m/s. A new board was placed on the platform 10 min after each pulse and scanned with the old one by the IOM at ×10 amplification with a field of view of 2.49 mm2 × 1.79 mm2. Again, the stitching technology (20% edge overlap, at least 12 × 17 individual images required) was adopted for each region. The intact image of each region was also binarized. The results were represented by the “absolute percentage”—the area of black pixels divided by the whole area of one region.
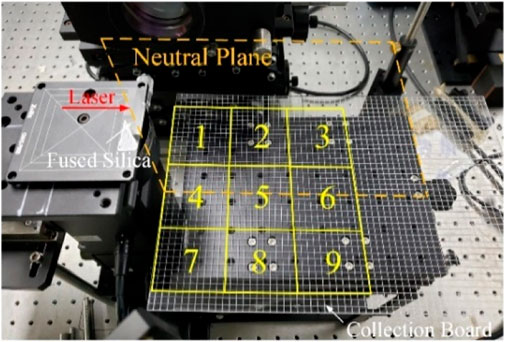
FIGURE 3. Arrangement of bottom distribution, where the Nos. 1–9 represents the individual region, respectively, the virtually neutral plane across the middle of No. 4–6 regions.
3 Results and discussion
3.1 The largest dispersion angle
In this section, we examine the initial movement of laser-induced debris.
Figure 4 describes the largest dispersion angle (LDA) variation tendency of debris at three incident fluences from the OS and TS surfaces, respectively. The observed debris were classified in terms of their diameters into five groups: 10–20, 20–30, 30–40, 50–100, and >100 μm. The dotted circles in the figure present the maximum or minimum values. Since the inborn direction of the debris clusters is mainly perpendicular to the surface [24, 30], a higher LDA indicates a more considerable detaching degree from the original clusters. For debris from the OS surface, plotted in Figure 4A, the LDA decreases primarily as the debris diameter increases. Except for the debris diameter larger than 100 μm, the LDA at 18 J/cm2 is greater than the other two fluences in all diameter ranges. Additionally, the maximum value −89.78°—also occurs at 18 J/cm2 when the diameter ranges between 20 and 30 μm. However, the minimum value−85.55°—appears at 79 J/cm2 with a diameter between 50 and 100 μm. For debris from the TS surface, the LDA in all diameter ranges still shows a downward tendency but maintains a high level with fewer fluctuations among fluences, as shown in Figure 4B. Both the maximum and minimum LDA appear when the fluence is 18 J/cm2. Additionally, the slightest fluctuation occurs in diameter between 20 and 30 μm with less than 0.3% deviation.
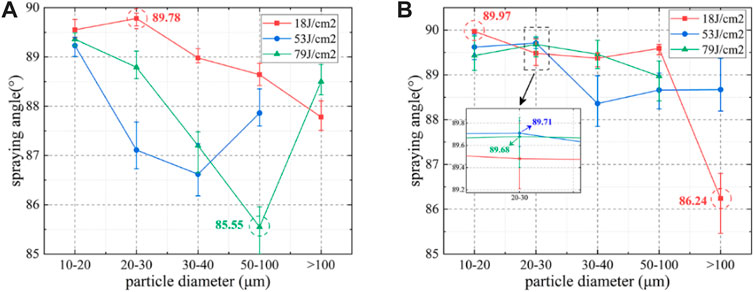
FIGURE 4. Largest dispersion angle (LDA) of five grouped debris: 10–20, 20–30, 30–40, 50–100, and >100 μm in diameter at three incident fluences, where (A) represents debris ejected from the OS surface and (B) TS surface.
The experimental results of LDA reveal a characteristic of initial movement of sputtering debris when they eject from the surfaces with roughness differences of more than three orders. The debris sputtered from the OS, or TS surface spread widely as the incident fluence was below the damage threshold (18 J/cm2). Since the LDA declines broadly with the increasing debris diameter sputtered from the OS surface, it can be conceived that the initial spallation state of the debris layers easily on the basis of diameters, and greater fluences will promote this trend. In other words, mutual impacts between debris with different diameters are weakened, and rectilinear motion behavior for some debris is likely to be sustained. Similarly, the narrow decline of LDA indicates fierce interactions among debris with different diameters ejected from the TS surface. The rectilinear motion behavior of some debris is thus unlikely to be sustained, and more scatterings will occur. These results referring to centralization/decentralization from the inborn surface will be further explained next.
3.2 Longitudinal propagation
This section aims to investigate the movement of laser-induced debris over short and medium distances.
3.2.1 Total particle number variation in the longitudinal direction
Figure 5 below shows that there has been a monotonical decline in the total particle number of ejected debris in the longitudinal direction except for incident fluence at 18 J/cm2, where a minor increase appears at 20 mm. This result may reflect the effect of low fluence on longitudinal propagation. There is a greater quantity of debris sputtered from the OS surface on each plate than that from the TS surface. Additionally, the total particle number from the OS surface is proportional to the fluence. Due to these results, it can be assumed that ejected debris are more sensitive to laser fluence when they are propagated from the OS surface. It is somewhat surprising that the tendency of the total particle number does not always obey the sensitive rules when they are ejected from the TS surface. For example, the total particle number on the 10 mm plate at 79 J/cm2 is less than half that at 53 J/cm2. One possible explanation for this may be associated with the inborn state of the debris and their morphologies. It appears that the debris ejected from the surface of the TS are fragmented and flaked rather than molten. In addition, the fragmented debris have sharp edges. These two factors reduce the possibility of debris adhering to the surface. Therefore, they will collide with the surface of the plate and bounce off. In addition, due to the velocity of debris mainly being proportional to the incident fluence [24], the higher fluence makes them possess more kinetic energy and bounce off easily. As a result, the total particle number decreases sharply at 79 J/cm2. However, this phenomenon will weaken at 20 mm and finally disappear at 40 mm.
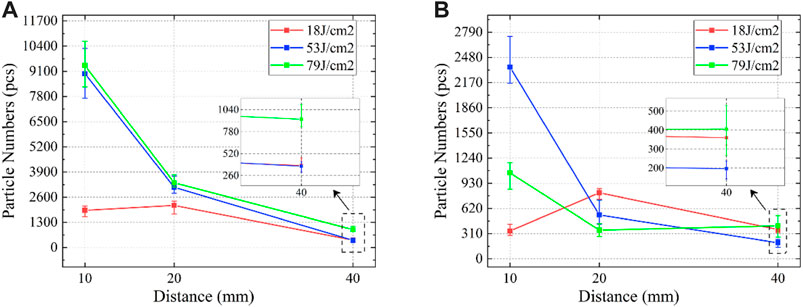
FIGURE 5. Variation of total numbers in the longitudinal direction, where (A) represents debris ejected from the OS surface and (B) TS surface.
3.2.2 Debris scattering in the longitudinal and radial direction
Figure 6 below presents the experimental data on debris diameters vs. distance from the center of the collection plate. Due to the center being collinear with the incident beam, the data can provide some insight into the radial scattering. To clarify the scattering trend in the longitudinal direction with different incident fluences, we classified the core area of the plate into two types: centralization and decentralization, based on the radial distance from the center. As the maximum distance from the center is about 3,500 μm (depending on the FOV of the stitched image), we adopted half of that value—1,750 μm—to define the boundary (shown in a dotted purple line in the image) where the distance <1750 μm belongs to the centralized area, and the rest belongs to the decentralized area. Using this classification, the percentages of the debris quantity in the two areas can be calculated, as shown in the purple font on the top of each image. This image has two functions: 1) quantitively displaying the overall centralization/decentralization trend under different laser fluences; 2) preliminarily discovering the trend for debris with specific diameter ranges.
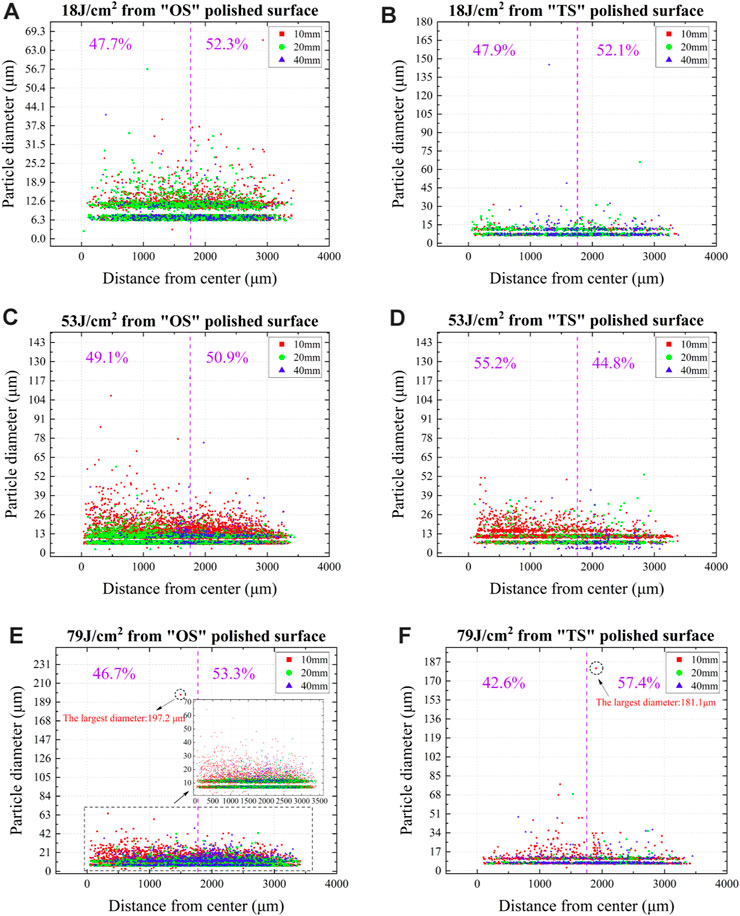
FIGURE 6. Debris propagation along with the longitudinal and radial directions at three incident fluences, where (A,C,E) represent ejection from the OS surface and the rest from the TS surface.
In the centralized area, the percentage of debris quantity, whether from the OS or TS surface, increases first from 18 to 53 J/cm2, slightly higher than the threshold of fused silica, then drops as the fluence reaches 79 J/cm2. As this phenomenon is independent of the surface roughness, the incident fluence can be considered the primary cause of the centralization. Additionally, although the debris propagation from the TS surface is less sensitive than that from the OS surface (illustrated in Section 3.2.1), the centralization is prominent when the fluence reaches 53 J/cm2.
The debris with diameters less than 30 μm dominate each plate, and their number decreases from 10 to 40 mm. Debris with diameters larger than 30 μm are rarely seen, and most of them are located on the 10 mm plate inside the centralized area. This phenomenon echoes a previous LDA result that large debris have a better rectilinear movement (lower LDA). Additionally, the debris with a maximum diameter of about 200 μm can be observed around the boundary whether they ejected from the OS or TS surface, as depicted in Figures 6E,F. This phenomenon indicates that the maximum diameter of debris appears when the incident fluence exceeds the threshold. For debris from the OS surface, the maximum diameter is closely proportional to the incident fluence, where the value is, respectively, 57, 110, and 197 μm when the fluence was set at 18, 53, and 79 J/cm2. Nevertheless, large debris are not always generated at the highest fluence; a piece of debris with a diameter of about 150 μm can also be observed on the 40 mm plate inside the centralized area from the TS surface when the fluence was set at 18 J/cm2.
3.2.3 Relationship between debris diameter and propagation direction
To further refine the relationship between the longitudinal propagation and debris diameter, the distance from the center is divided into six zones, including <400, 400–800, 800–1,200, 1,200–1,600, 1,600–2,000, and >2,000 μm. The percentage of each debris type in each zone is calculated. The results are shown in Figure 7, where Figures 7A,C,E show the percentage at 18, 53, and 79 J/cm2 from the OS surface and the rest from the TS surface. Again, the abscissa of each image represents the distance from the center, while the corresponding percentage in each zone reflects the radial change for each type of debris. Thus, centralization/decentralization is presented. Meanwhile, the percentages on the three collection plates (10, 20, and 40 mm) are simultaneously displayed, revealing the further change along the propagation direction.
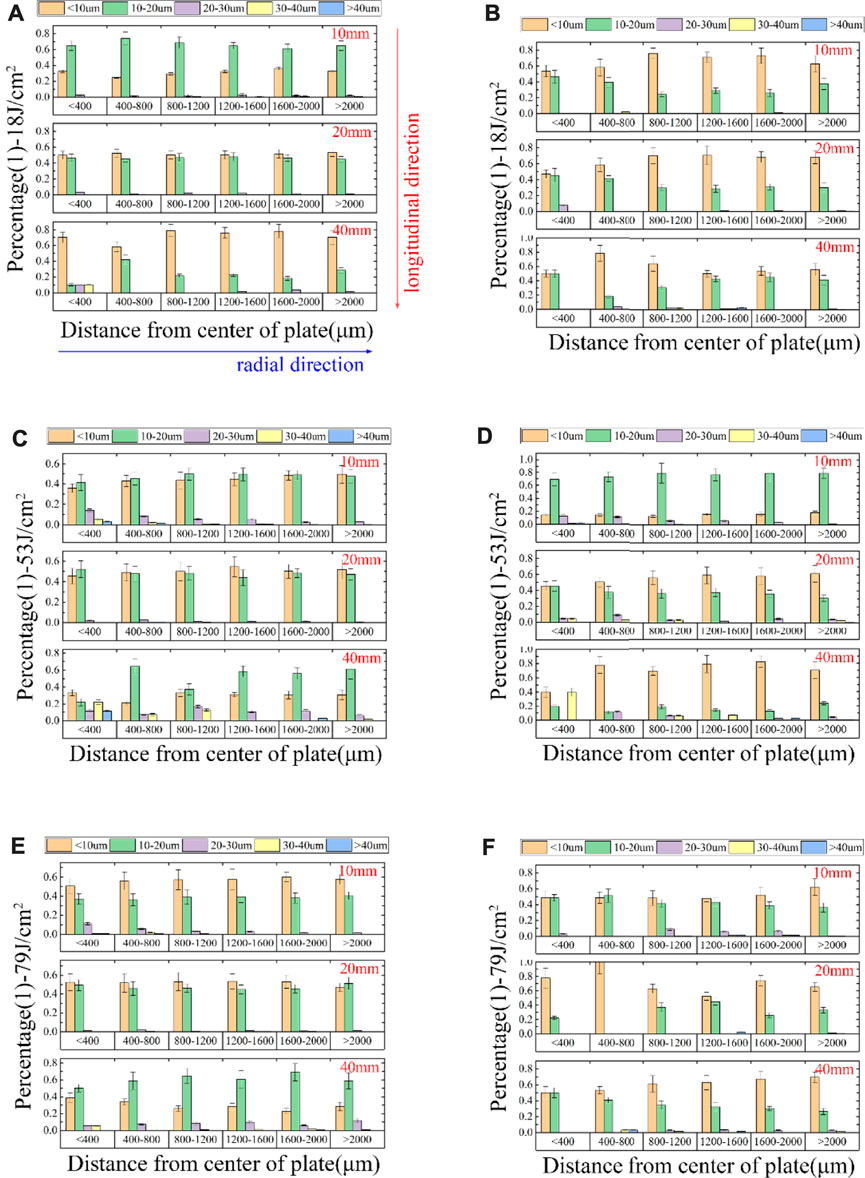
FIGURE 7. Relationship between debris diameter and propagation directions (longitudinal—up to down, radial—left to right) at three incident fluences, where (A,C,E) represent ejection from the OS surface, with the rest from the TS surface.
As illustrated above, debris with diameters less than 30 μm account for the majority on each plate, especially <10 and 10–20 μm (displayed in orange and green bars) from either the OS or TS surface. Due to the more minor variation in percentages in different zones, an apparent centralization of this type of debris is not evident. This feature is still present with the increasing distance in the propagation direction. The result informs us that although the total number of such fine debris decreases during the propagation process, the change ratios in the radial direction remain stable, so the optics components downstream in the final optics assembly may encounter contamination by such fine debris in the form of large-scale volume flow.
For debris >20 μm, whether ejecting from the OS or TS surface, the percentage on the 10 mm plate shows a non-uniform decrease in the radial direction. With an increase in the propagation direction (20, 40 mm plate), such a decrease becomes uniform. This phenomenon indicates a centralization in a short-range and a subsequent scattering in a long-range, different from debris <20 μm. Furthermore, this two-range feature stands out when the incident fluence was increased to 53 J/cm2, where larger debris can be generated. Such a feature deviates, however, when the fluence reaches 79 J/cm2, and the debris (if there is any) from the TS surface distribute uniformly on any plate. For debris from the OS surface, the uniform distribution is more prominent. These results remind us of the effect of the generation mechanism of such debris on their propagation: when the debris are mainly generated by melting (from the OS surface), the higher the incident fluence, the better the short-range rectilinear movement. This property can be weakened if another mechanism exists (ejected from the TS surface). For example, mechanical stress failure, which is often observed on the highly polished optics in the final optics assembly [31]. Therefore, optics near the damage sites will likely encounter local “spot” hits, while optics downstream will likely encounter a fall-off of volume flow that will flush their surfaces if debris are not fully settled during the flight.
3.3 Bottom distribution
This section investigates the short, middle, and long-range movement of laser-induced debris.
This Figure 8 displays the percentage of laser-induced debris in the bottom distribution, where Figures 8A,C,E represent the percentage of debris from the OS surface at the incident fluence of 18, 53, and 79 J/cm2, while the rest are from the TS surface. The most prominent finding from the data is that the sum percentage from the OS surface is lower than the TS surface. It is noteworthy that these results are in contrast to those depicted in Section 3.2.1. One possible explanation for this could be attributed to mass conservation in the debris propagation process: the more debris that fly through the horizontal direction, the fewer that will land on the bottom. Accordingly, the bottom distribution provides information about their propagation trajectories as well as provides a prediction of their subsequent movements. Based on these inferences, the nine preset regions near to far from the target are further integrated into three groups along the longitudinal direction, which are labeled L1 (red), L2 (green), and L3 (blue), respectively. There are various trends for percentage changes in these groups, such as monotonically reducing, growing first then reducing, reducing first then growing, etc. Among these, reducing first then growing is most important because it exhibits the possibility of long-range movement of the debris. As the percentage changes from monotonically reducing to first reducing then growing when the incident fluence is individually at 53 and 79 J/cm2 from the OS surface, shown in Figures 8C,E, it can be inferred that the ability of long-range movement is enhanced with an increase in the laser fluences. Additionally, the centralization is presented. However, for debris from the TS surface, inferring in the same way, the ability of long-range movement is suspended at 53 J/cm2, as shown in Figure 8D. Meanwhile, a non-axial scattering occurs when the fluence reaches 79 J/cm2, as shown in Figure 8F. These results are similar to those in Section 3.2 but with a further increase in the propagation distance.
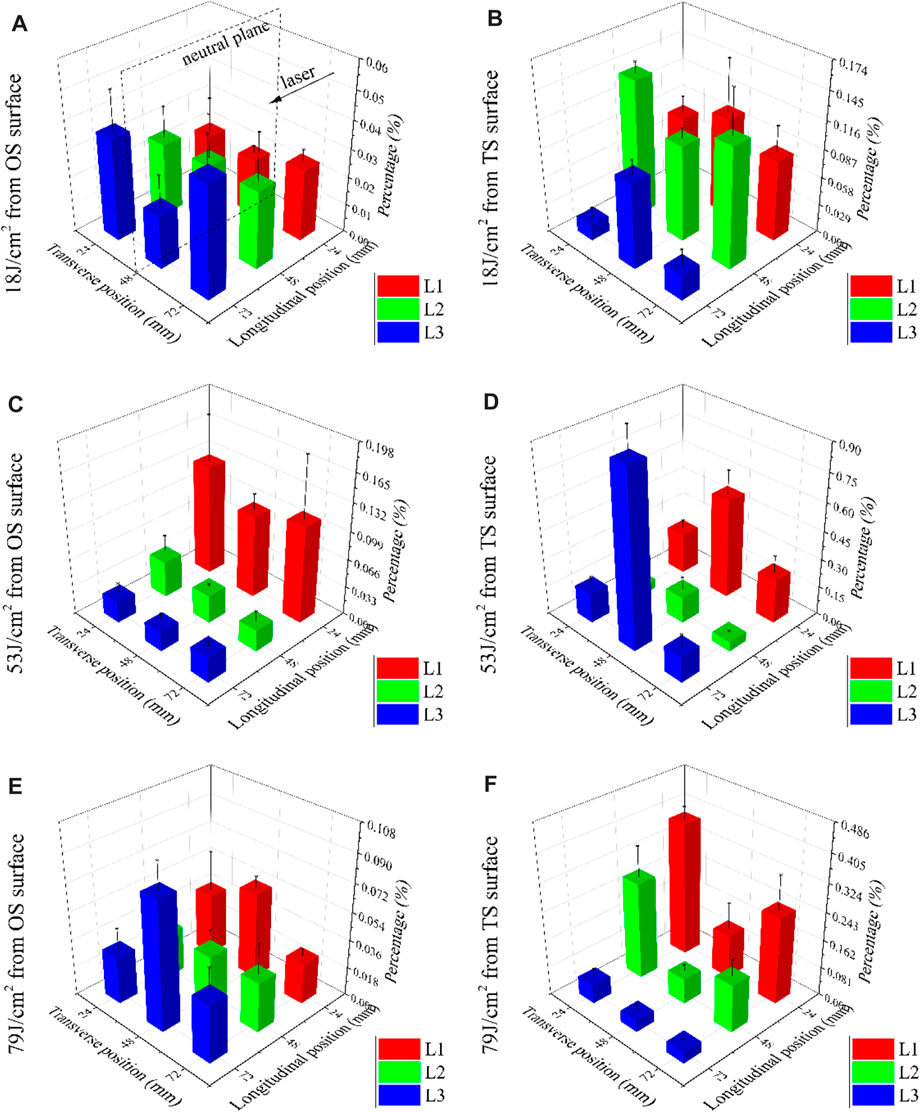
FIGURE 8. Bottom distribution at three incident fluences, respectively, where (A,C,E) represent ejection from the OS surface, with the rest from the TS surface.
To further assess the contribution to the scattering features from the TS surface, we extracted the debris numbers with different diameters (classified as before) from the L1 and L2 groups when the fluence was set at 79 J/cm2, as shown in Table 1. Again, debris with diameters <20 μm still occupy the majority, and the trend of their quantity distribution (for debris <10 or 10–20 μm) is the same as the absolute percentage depicted in Figure 8F. Thus, it can be obtained that the debris <20 μm contribute the most to the overall scattering. More details of this type of debris morphology are displayed in Figure 9, where a fragmented cluster (with an average diameter <10 μm) is shown in Figure 9C, a lump with sharp edges shown in Figure 9E, and a flake with molten traces shown in Figure 9F were mainly observed at Nos. 1 and 4 regions. Additionally, a large single flake (>40 μm) with stratified edges shown in Figure 9D, a semi-molten bar (>30 μm) shown in Figure 9G, and flocculence (<10 μm) shown in Figure 9H were occasionally seen amid the debris <20 μm. However, debris in a fully melting state were rarely seen in the two regions. Based on these results, it is reasonable to attribute the scattering characteristics to debris with a fragmentary origin. In other words, the random non-axial stress generated by the interaction between the laser beam and the target surface may be the leading cause of the debris scattering.
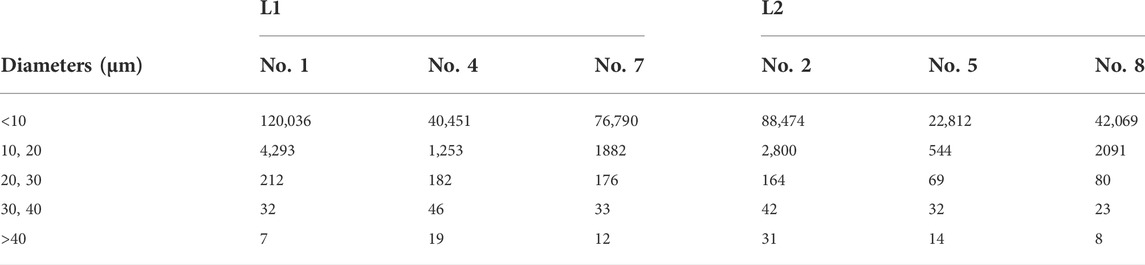
TABLE 1. Number of debris on specified regions of the collection board at 79 J/cm2 from the TS surface.
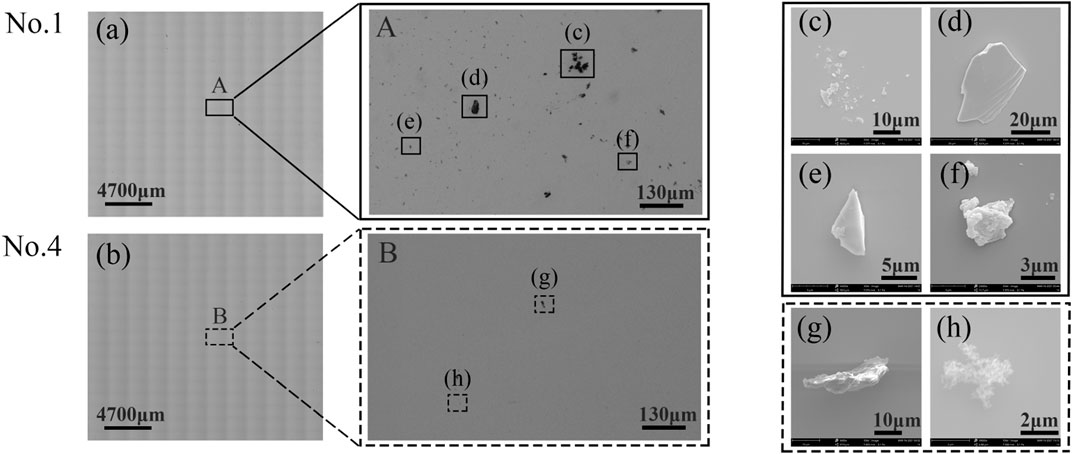
FIGURE 9. Bottom distribution at 79 J/cm2 from the TS surface in one experiment, where (A,B) represents stitched image at No. 1 and No. 4 region, respectively, (C–F) show classical morphologies of debris: fragment clusters, a large fragmented flake, a fragmented lump, a flake with molten trace, a semi-molten flake, and flocculence, respectively.
Concerning the bottom distribution, the peak percentage at the No. 6 region is also of great significance (including 79 J/cm2 from the OS surface shown in Figure 8E and 53 J/cm2 from the TS surface shown in Figure 8D), which implies the potential for long-range movement of debris. The debris with a diameter <20 μm also comprise the largest number, while their composition has changed because of an increasing number of fully molten debris. The morphologies are shown in Figures 10A–F, where Figure 10A represents an ellipsoid with a filiform tail behind (streamline shape); Figures 10B,C represent types of in-line debris connected to round ones in various amounts; and Figures 10D–F represent three types of aggregated debris stacked by the round ones. Two factors might be responsible for their long-range flight. One is their high initial velocity (on the order of several kilometers per second) [24], and the other is their shape contribution (compared with the rounded shapes shown above) to reducing the drag coefficient. The details of this will be discussed next.
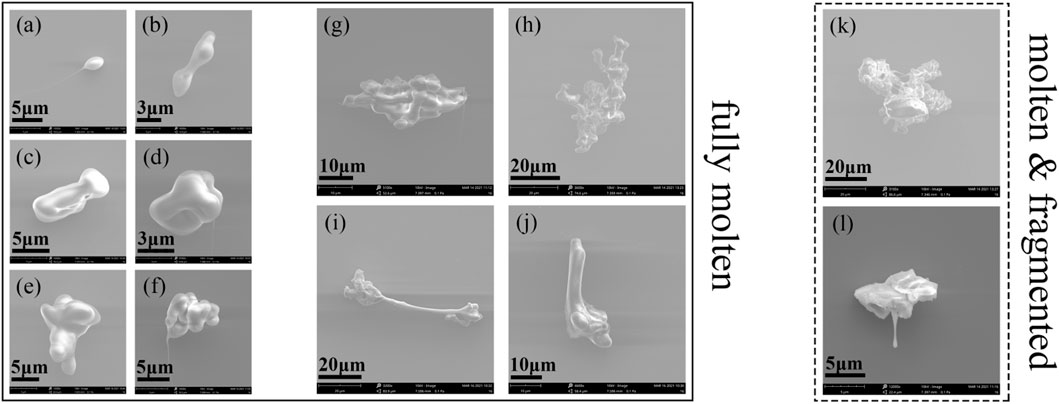
FIGURE 10. Morphology of molten debris, where (A–F) represents fully molten with diameter <10 μm, (G–J) > 20 μm, respectively, and (K,L) are semi-molten and fragmented state with diameter >40 and <10 μm, respectively.
Although limited in number, some large molten debris can also be found in the No. 6 region shown in Figures 10G–L. The morphologies shown in Figures 10G,H can be seen as a further superposition of round debris in width and height; Figure 10I looks like a bone rod with stacked structure (<20 μm) on both of its sides, and Figure 10J, a piece of half bone rod debris that possibly broke down in the middle. Additionally, some semi-melted and fragmented debris were also obtained where Figure 10K shows an aggregate type connected by molten fibers inside, and Figure 10L shows a fragment with a solidified molten strip whose end nearly formed a piece of elliptical debris the same as Figure 10A.
The results from Sections 3.1–3.3 display the spatial-propagation properties of laser-induced debris from the rear surface of fused silica. Debris from the OS surface positively correlate with incident fluence, especially for centralization. In contrast, for debris from the TS surface, the centralization grows first and then reduces, possibly related to the stress failure or other mechanical propulsions. Therefore, two underlying mechanisms can help to explain these phenomena. The first is melting. Sputtering debris originate from local defects of material-absorbing energy and evolve into sputtering accompanied by material removal. A heat absorption explosion is one of the leading causes of molten outputs from boiling. Since the boiling point is fixed (2,000–3,000 K) and the beam profile is set as a Gaussian curve with high centralization, the aggressive energy in the middle can vaporize more liquid if the density of air and plasma are neglected. From a macro perspective, centralization is evident. The second mechanism is a structural failure caused by plasma impact after melting. Through the conservation laws of mass, momentum, and energy, the relationship of velocity of plasma front v, temperature T, density ρ, and incident fluence P can be simplified [32].
where, α represents the modification coefficient regarding kinetic change due to aerodynamics, unit: J∙kg−1K−1. As material ionization occurs from energy deposition, the plasma absorbs the energy strongly and expands in a large volume. Thus, its density ρ will sharply decrease, and the speed v will increase, at least on the order of 104 with anisotropic directions [33] (mainly along the anti-incidence to the central molten area, calculated by Taylor—von Neumann—Sedov blast theory). This transient behavior, on the one hand, hinders the centralization of molten debris and, on the other hand, forces the plasma to interact with the melting defects, physically inducing asymmetric damage. As a result, the fragments are generated with prominent scattering characteristics.
Laser-induced sputtering of debris is a highly complex transient process. It is challenging to fully reproduce the process, including melting, plasma generation, stress failure, and subsequent spatial propagation. However, in this work, the roughness of the OS surface was preset to bias the sputtering mechanism toward melting by enhancing three orders of magnitude so that some disturbances will be ignored, and a heat-absorption model can be established to analyze the fluence distribution on the OS surface and further help to explain the centralization. To maintain a consistent comparison, the distribution on the TS surface (without considering stress failure) was also calculated. Some parameters of the model: the input source is replaced by an equivalent power density (unit: W/mm2), and the root mean square height (Sq) of OS and TS surface is, respectively, taken as 0.8 μm and 0.5 nm. For easy comparison, the corresponding length of the contour line is kept the same, and the surface length is taken as 600 μm, allowing a 3σ possibility of a radiation area from the Gaussian curve closest to the experimental spot size. The absorption coefficient depends on the material temperature and penetration depth of the laser beam.
The numerical results are shown in Figures 11A–D. For the TS surface, the energy deposition falls smoothly layer by layer along the center of the beam profile (Gaussian curve). With the increase in incident fluence, the deposition area extends deeper and broader, especially with a significant gradient around the center. As a result, the damaged site forms a crater-like structure with a molten pit in the center and cracks nearby, as shown in Figure 11E. The structure indicates the inborn debris from the inside out (molten to fragmented). Due to the crater’s diameter referring to a melting degree during ablation proportional to the incident fluence [34], a small diameter appeared. In addition, there was a lesser contribution to the melting debris when the fluence was set at 18 J/cm2. Hence, the fragments produced most of the debris at low fluences, resulting in a large LDA.
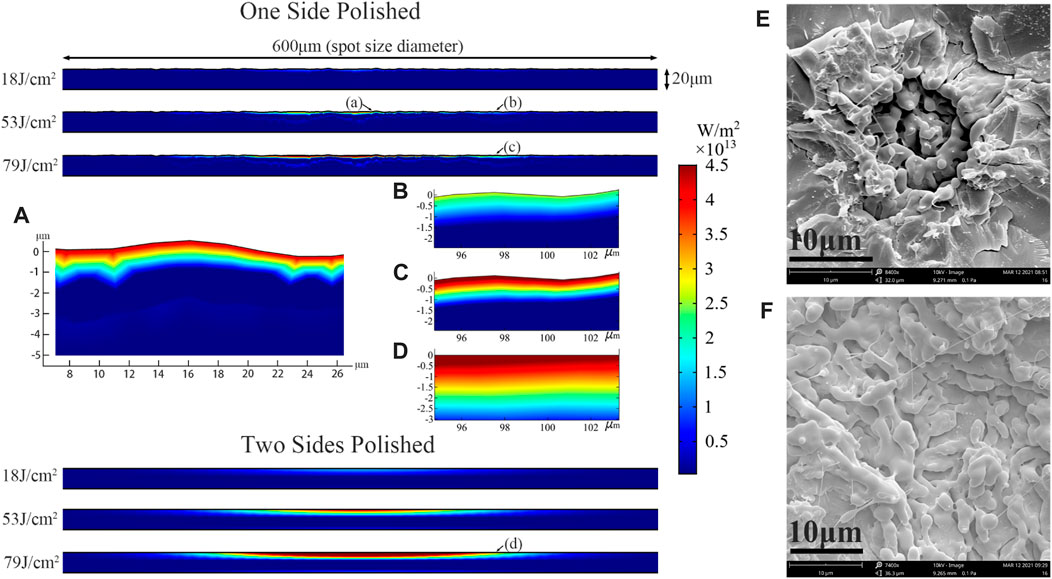
FIGURE 11. Numerical results of energy deposition at three incident fluences on the OS and TS surface, where (A) represents the core area, (B–D) represent the outer area, respectively, (E,F) show damage pits observed by SEM.
However, for the OS surface, the deposition is changed because of the undulating surface made by the microstructure, which divides the contour surface into multiple parts with inward protruding spurs, as shown in Figure 11A. The deposition was dispersed; therefore, more energy accumulated locally to fuse base material on the subsurface shown in Figure 11F, resulting in large amounts of molten debris at a shallow depth. Additionally, no prominent pit with fragments around could be found. Limited by the protruding size (usually <2 μm), such debris are usually <10 μm and dominate the majority of the debris. In addition, with a further increase in the incident fluence, more material will be molten in-depth, and better centralization will appear.
As stated above, molten debris <10 μm can travel at 79 J/cm2 from the OS surface and 53 J/cm2 from the TS surface. The initial velocity of the debris may range from hundreds of meters per second to 2.5 km/s [32]. Assuming their shape is round and only decelerated by the air drag, the longest distance Xp can be calculated by [35].
where, CD is the drag coefficient, d, ρ, and v represent the diameter, density, and velocity, respectively. Take the intermediate value d = 5 μm and v = 1 km/s, the Xp is eventually close to 40 mm. In this view, most debris will theoretically land in the No. 4 region.
However, the results show that most debris <10 μm are eventually located in the No. 6 region with specific morphologies. Thus, the morphology factor, which plays an essential role in reducing the drag force and prolonging the motion distance, must be considered. In this work, several shape factors may have contributed to lowering the coefficient CD: first, debris with a streamlined shape shown in Figure 10A or stacked structure shown in Figures 10D–F. In this case, the CD reduces because of a lesser pressure difference resulting from the separation delay of airflow between front and back facets. Second, debris with a large aspect ratio are shown in Figures 10B,C. The CD can be reduced when the narrow side encounters the airflow at a slight attack angle, where there is mutual friction between air and debris that is much smaller than the pressure difference at a large attack angle. Third, flocculent debris with porous structure and large surface area, shown in Figure 9H. Such a structure allows a higher speed of air to enter the debris inside as long as the initial direction has enough holes parallel to the airflow. In this circumstance, the air around the outer surface can be dragged in forming a transition delay from laminar to turbulence, which reduces the friction factor of CD.
Fragments related to structural failure with a large diameter were usually found near the TS target and scattered (in a large LDA) when the incident fluence was higher than the damage threshold. However, some of them with a diameter of more than one hundred microns could also be found far away from the target at 18 J/cm2. There are a few reasons for this, one of which can be attributed to an unbalanced launch state, where the lower thermal stress from the molten area (compared with the higher fluence) and the fixed failure of the mechanical stress of the base material (fused silica) can easily cause rotation at a wide ejection angle. In particular, if the angle reaches 90° (vertical to the surface), low-pressure drag will be encountered during flight to the final long-range movement.
4 Conclusion
This paper aims to clarify the large-scale evolution process of longitudinal propagation and bottom sedimentation, considering debris quantity, diameter, and morphology from the perspectives of scattering and centralization in high-power systems. The main conclusions of our research include the following:
1) At the same incident fluence, the amount of debris ejected from the OS surface is greater than that from the TS surface. Their flying distance in the longitudinal direction is longer.
2) With the increase in incident fluences, the debris centralization in the centralized area always increases first and then reduces regardless of whether it is from the OS or TS surface.
3) The maximum diameter of debris can be produced when the incident fluence reaches the top (79 J/cm2). For debris from the OS surface, the maximum diameter increases with increasing incident fluence. However, there is no such noticeable feature for debris from the TS surface, and even at the lowest fluence (18 J/cm2), it can be as high as 150 μm.
4) The propagation laws of debris centralization with increasing distances in the longitudinal direction: for debris <20 μm, there is no outstanding scattering or centralization, as it propagates in a large volume with flat gradients; for debris >20 μm, the centralized characteristic appears in the short-range (on the 10 mm plate) and weakens in the middle and long-range (at 20 and 40 mm). Especially, this phenomenon is prominent as the fluence increases when debris are ejected from the OS surface.
5) Bottom distribution can also reflect scattering and centralization and predict the potential for long-range movement.
6) Fracture failure is the leading cause of particulate scattering, and the long-range movement may have a relationship with the aerodynamic morphology of molten debris with diameters <20 μm.
In summary, the sputtering of laser-induced damage from fused silica has a profound relationship with the strength of incident fluence and the formation mechanism. When the debris are produced by melting, with the increase in incident fluence, particulate centralization, especially with a large diameter in the longitudinal direction, is increased, as well as with long-range movement. When other factors exist during sputtering, such as mechanical stress, the centralization is weakened. Additionally, the scattering is noticeable as long as the incident fluence is below or above the damage threshold of fused silica.
Data availability statement
The original contributions presented in the study are included in the article/Supplementary Material, further inquiries can be directed to the corresponding authors.
Author contributions
Methodology, JXC and LHL; Project administration, CYZ; Software, LXL; Supervision, PZ; Visualization, ZD; Writing – original draft, GP; Writing – review and editing, QG.
Funding
This work was performed under the auspices of the National Natural Science Foundation of China 51535003 and NSAF Joint Fund U2030109.
Acknowledgments
We would like to acknowledge LL and CZ from the School of Astronautics, Harbin Institute of Technology, for the experiment support and simulation conversations, and Dr. Lizi Qi for the text correction.
Conflict of interest
The authors declare that the research was conducted in the absence of any commercial or financial relationships that could be construed as a potential conflict of interest.
Publisher’s note
All claims expressed in this article are solely those of the authors and do not necessarily represent those of their affiliated organizations, or those of the publisher, the editors and the reviewers. Any product that may be evaluated in this article, or claim that may be made by its manufacturer, is not guaranteed or endorsed by the publisher.
References
1. Jiang S, Wang F, Ding Y, Liu S, Yang J, Li S, et al. Experimental progress of inertial confinement fusion based at the ShenGuang-III laser facility in China. Nucl Fusion (2019) 59(3):032006. doi:10.1088/1741-4326/aabdb6
2. Sun F, Zhang P, Lu L, Xiang Y, Bai Q. The effect of air flow on the temperature distribution and the harmonic conversion efficiency of the ADP crystal with large aperture in the temperature control scheme. Opt Laser Tech (2016) 77:126–33. doi:10.1016/j.optlastec.2015.09.019
3. Li Y, Zhu J, Pang X, Tao H, Xiang J, Wu Y. Numerical simulation of debris-removal trajectories on the transport mirrors in high-power laser systems. High Pow Laser Sci Eng (2015) 3:e5. doi:10.1017/hpl.2014.53
4. Liao ZM, Raman R, Cross D, Carr W. Contamination-driven laser-induced damage model at the national ignition facility. Syst Contam Prediction, Control Perform (2018) 10748:166–73. SPIE. doi:10.1117/12.2320358
5. Fleurot N, Cavailler C, Bourgade JL. The Laser Mégajoule (LMJ) Project dedicated to inertial confinement fusion: Development and construction status. FUSION ENGINEERING DESIGN (2005) 74(1-4):147–54. doi:10.1016/j.fusengdes.2005.06.251
6. Yu H, Jing F, Wei XF, Zheng WG, Zhang M, Zhan S, et al. Status of prototype of SG-III high-power solid-state laser[C]. In: Proceedings of the 17th International Symposium on Gas Flow, Chemical Lasers, and High-Power Lasers; October 2008. Bellingham, WAS: SPIE (2008). p. 713112–6.
7. Haynam CA, Wegner PJ, Auerbach JM, Bowers MW, Dixit SN, Erbert GV, et al. National Ignition Facility laser performance status. Appl Opt (2007) 46(16):3276–303. doi:10.1364/ao.46.003276
8. Bude J, Carr CW, Miller PE, Parham T, Whitman P, Monticelli M, et al. Particle damage sources for fused silica optics and their mitigation on high energy laser systems. Opt Express (2017) 25(10):11414. doi:10.1364/oe.25.011414
9. Li Y, Bai Q, Yao C, Zhang P, Shen R, Liu H, et al. Long-lasting antifogging mechanism for large-aperture optical surface in low-pressure air plasma in-situ treated. APPLIED SURFACE SCIENCE (2022) 581:152358. doi:10.1016/j.apsusc.2021.152358
10. Cormont P, Gallais L, Lamaignère L, Rullier JL, Combis P, Hebert D. Impact of two CO2 laser heatings for damage repairing on fused silica surface. Opt Express (2010) 18(25):26068–76. doi:10.1364/oe.18.026068
11. Duchateau G, Feit MD, Demos SG. Strong nonlinear growth of energy coupling during laser irradiation of transparent dielectrics and its significance for laser induced damage. JOURNAL APPLIED PHYSICS (2012) 111(9):093106. doi:10.1063/1.4707755
12. Demos SG, Negres RA, Raman RN, Rubenchik AM, Feit MD. Comparison of material response in fused silica and KDP following exit surface laser-induced breakdown. Laser-Induced Damage Opt Mater (2013) 8885:132–7. doi:10.1117/12.2030481
13. Cheng J, Wang J, Hou J, Wang H, Zhang L. Effect of polishing-induced subsurface impurity defects on laser damage resistance of fused silica optics and their removal with HF acid etching. Appl Sci (2017) 7(8):838. doi:10.3390/app7080838
14. Ge P, Chen J, Lu L, Miao X, Dong Z, Leng D. Dual dynamic airflow protection for the removal of fused silica micron particles in the final optics assembly[J]. AEROSOL SCIENCE TECHNOLOGY (2020) 54(3):342–52. doi:10.1080/02786826.2019.1699645
15. Angleraud B, Garrelie F, Tetard F, Catherinot A. Study of particles ejected after pulsed laser ablation of a graphite target. Appl Surf Sci (1999) 138:507–11. doi:10.1016/s0169-4332(98)00447-4
16. Demos S, Negres R, Raman R, Feit M, Manes K, Rubenchik A. Relaxation dynamics of nanosecond laser superheated material in dielectrics. Optica (2015) 2(8):765–72. doi:10.1364/optica.2.000765
17. Li Y, Bai Q, Guan Y, Zhang P, Shen R, Lu L, et al. In situ plasma cleaning of large-aperture optical components in ICF. Nucl Fusion (2022) 62(7):076023. doi:10.1088/1741-4326/ac555c
18. Stolz CJ, Roger Qiu S, Negres RA, Bass IL, Miller PE, Cross DA, et al. Transport mirror laser damage mitigation technologies on the National Ignition Facility[C]. SPIE (2018) 10691:106910W. doi:10.1117/12.2323284
19. Zhu C, Liang L, Ge P, Yuan H, Zhou L, Li Y, et al. Explosion plume on the exit surface of fused silica during UV laser- induced damage. Results Phys (2022) 32:105094. doi:10.1016/j.rinp.2021.105094
20. Raman RN, Negres RA, Demos SG. Optical emission from fused silica ejecta following localized exposure to nanosecond laser pulses[C]. In: CLEO: Science and Innovations 2011; May 2011; Baltimore, Maryland United States. IEEE (2011). p. 1–2.
21. Demos SG, Negres RA. Morphology of ejected particles and impact sites on intercepting sub-strates following exit-surface laser damage with nanosecond pulses in silica[J]. OPTICAL ENGINEERING (2017) 56(1):11016. doi:10.1117/1.OE.56.1.011016
22. Raman RN, Elhadj S, Negres RA, Matthews MJ, Feit MD, Demos SG. Characterization of ejected fused silica particles following surface breakdown with nanosecond pulses. Opt Express (2012) 20(25):27708–24. doi:10.1364/oe.20.027708
23. Rubenchik AM, Feit MD, Demos SG. Interaction of laser pulse with confined plasma during exit surface nanosecond laser damage[C]. SPIE (2013) 8885:88851D. doi:10.1117/12.2030482
24. Raman RN, Negres RA, Demos SG. Kinetics of ejected particles during breakdown in fused silica by nanosecond laser pulses. Appl Phys Lett (2011) 98(5):051901. doi:10.1063/1.3549193
25. Ikeda J, Testik FY. Propagation, deposition, and suspension characteristics of constant-volume particle-driven gravity currents. Environ Fluid Mech (2021) 21(1): 177–208. doi:10.1007/s10652-020-09756-4
26. Fan SC, Lee CK, Kang KW, Wu ZJ. Validation of a flight model for predicting debris trajectory from the explosion of an ammunition storage magazine. J Wind Eng Ind Aerodynamics (2015) 136:114–26. doi:10.1016/j.jweia.2014.11.004
27. Ahsanullah MS, Kaye NB, Bridges WC. A stochastic model for the aerodynamics of irregularly shaped gravel. J Wind Eng Ind Aerodynamics (2021) 218:104782. doi:10.1016/j.jweia.2021.104782
28. Ge P, Lu L, Dong Z. Propagation of laser-induced particles from fused silica[J]. Chin J Lasers (2019) 46(04):125–31. doi:10.3788/CJL201946.0403001
29. Bercegol H, Lamaignere L, Le Garrec B, Loiseau M, Volto P. Self-focusing and rear surface damage in a fused silica window at 1064 nm and 355 nm[C]. SPIE (2003) 4932:276–85. doi:10.1117/12.472374
30. Demos SG, Negres RA, Raman RN, Rubenchik AM, Feit MD. Material response during nanosecond laser induced breakdown inside of the exit surface of fused silica. Laser Photon Rev (2013) 7(3):444–52. doi:10.1002/lpor.201200100
31. Manes KR, Spaeth ML, Adams JJ, Bowers MW, Bude JD, Carr CW, et al. Damage mechanisms avoided or managed for NIF large optics. Fusion Sci Tech (2016) 69(1):146–249. doi:10.13182/fst15-139
32. Yu W, Xu Z, Chen Z. Shock generation by laser-driven ablation. J Phys D Appl Phys (1996) 29(6):1515–9. doi:10.1088/0022-3727/29/6/016
33. Brailovsky AB, Gaponov SV, Luchin VI. Mechanisms of melt droplets and solid-particle ejection from a target surface by pulsed laser action. Appl Phys A Mater Sci Process (1995) 61(1):81–6. doi:10.1007/bf01538216
34. Wong J, Ferriera JL, Lindsey EF, Haupt DL, Hutcheon ID, Kinney JH. Morphology and microstructure in fused silica induced by high fluence ultraviolet 3ω (355nm) laser pulses. JOURNAL NON-CRYSTALLINE SOLIDS (2006) 352(3):255–72. doi:10.1016/j.jnoncrysol.2005.11.036
Keywords: particles, laser-induced, fused silica, distribution, motion behavior, ICF (inertial confinement fusion), high-power
Citation: Peng G, Zhang P, Dong Z, Chen J, Liang L, Zhu C, Gao Q and Lu L (2022) Spatial sputtering of fused silica after a laser-induced exploding caused by a 355 nm nd: YAG laser. Front. Phys. 10:980249. doi: 10.3389/fphy.2022.980249
Received: 28 June 2022; Accepted: 17 August 2022;
Published: 07 September 2022.
Edited by:
Venugopal Rao Soma, University of Hyderabad, IndiaReviewed by:
Rafael Comesaña, University of Vigo, SpainSaikiran Vadavalli, Gandhi Institute of Technology and Management (GITAM), India
Copyright © 2022 Peng, Zhang, Dong, Chen, Liang, Zhu, Gao and Lu. This is an open-access article distributed under the terms of the Creative Commons Attribution License (CC BY). The use, distribution or reproduction in other forums is permitted, provided the original author(s) and the copyright owner(s) are credited and that the original publication in this journal is cited, in accordance with accepted academic practice. No use, distribution or reproduction is permitted which does not comply with these terms.
*Correspondence: Qiang Gao, Z2FvcUBoaXQuZWR1LmNu; Lihua Lu, bGlodWFsQGhpdC5lZHUuY24=