
94% of researchers rate our articles as excellent or good
Learn more about the work of our research integrity team to safeguard the quality of each article we publish.
Find out more
ORIGINAL RESEARCH article
Front. Phys. , 02 November 2022
Sec. Medical Physics and Imaging
Volume 10 - 2022 | https://doi.org/10.3389/fphy.2022.979229
This article is part of the Research Topic Breakthrough in Particle Therapy: At the Edge of Physics, Biology and Medicine View all 8 articles
 M. Toppi1,2
 A. Sarti1,3
 A. Alexandrov4,5B. Alpat6G. Ambrosi6S. Argirò7,8R. A Diaz9M. Barbanera6N. Bartosik8G. Battistoni10N. Belcari11,12S. Biondi13,14M. G. Bisogni11,12M. Bon3,15G. Bruni13P. Carra11,12F. Cavanna8P. Cerello8E. Ciarrocchi11,12A. Clozza11,12S. Colombi13G. De Lellis5,4
 A. De Gregorio15,3*A. Del Guerra11,12M. De Simoni3,15A. Di Crescenzo5,4B. Di Ruzza16M. Donetti8,17Y. Dong10M. Durante18,19V. Ferrero8E. Fiandrini6,20C. Finck21E. Fiorina8M. Fischetti3,1M. Francesconi11,12M. Franchini13,14G. Franciosini3,15G. Galati22,23L. Galli12G. Giraudo8R. Hetzel24E. Iarocci2M. Ionica6A. Iuliano5,4K. Kanxheri20,6A.C. Kraan12
 C. La Tessa16,25M. Laurenza2A. Lauria5,4E. L Torres9,8M. Marafini3,26M. Massa12C. Massimi13,14I. Mattei10A. Meneghetti17A. Mengarelli27R. Mirabelli15,3A. Moggi12M.C. Montesi5,28M.C. Morone29,30M. Morrocchi12,11S. Muraro10F. Murtas31,32A. Muscato33A. Pastore22N. Pastrone8V. Patera3,1F. Pennazio8F. Peverini6,20P. Placidi6,34M. Pullia17L. Ramello35,8C. Reidel18R. Ridolfi13,14V. Rosso11,12C. Sanelli2G. Sartorelli13,14O. Sato36S. Savazzi17L. Scavarda7,8A. Schiavi3,1C. Schuy18E. Scifoni16A. Sciubba2,1A. Sécher21M. Selvi13L. Servoli6G. Silvestre6,20M. Sitta35,8R. Spighi13E. Spiriti2G. Sportelli11,12A. Stahl24S. Tomassini2F. Tommasino16,25V. Tioukov5G. Traini3A. Trigilio15,3S.M. Valle10
 M. Vanstalle21U. Weber18R. Zarrella14,13A. Zoccoli13,14
 M. Villa14
The study of nuclear fragmentation plays a central role in many important applications: from the study of Particle Therapy (PT) up to radiation protection for space (RPS) missions and the design of shielding for nuclear reactors. The FragmentatiOn Of Target (FOOT) collaboration aims to study the nuclear reactions that describe the interactions with matter of different light ions (like
The understanding of nuclear processes behind the interaction with matter of protons and heavier ions (with nuclear charge Z ≤ 26) are of interest for several applications, ranging from Particle Therapy (PT) to Radio Protection in Space (RPS) and shielding development for nuclear experiments [1–3]. In particular, in the energy range of interest for PT and RPS applications (depending on the ion, in the 100–800 MeV/u kinetic energy range), the fragmentation cross sections of many nuclear processes are missing or known with a limited precision, mainly due to the lack of experimental data, as highlighted in a database developed for the NASA [4]. These fragmentation cross sections are the key point to refine and benchmark the nuclear models implemented in both the deterministic and MC codes used for precise dose computations in the above mentioned applications [5, 6]. Whenever a significant contribution is expected from fragmentation events, the MC predictions are hence suffering from uncertainties that affect the planning of PT treatments [7] or prevent an efficient and reliable development of shielding for astronauts [8–12]. The interest and the social impact of these applications renewed the effort of the scientific community in measuring the needed nuclear cross sections in the last 20 years with modern experimental setups. While some key measurements have been already recently performed [13–21], the aforementioned energy range still requires dedicated experimental campaigns.
In this context, the aim of the FragmentatiOn Of Target (FOOT) collaboration is to provide the needed experimental input, in the energy range of interest for PT and RPS applications, to refine the knowledge of double differential fragmentation cross sections related to the nuclear interactions of protons and heavier ions with matter [22]. In particular, FOOT aims at measuring the fragmentation induced by protons in the target during PT treatments. To do so, the FOOT collaboration pursues an inverse kinematic approach in which the basic constituents of the human body (O, C, Ca atoms) are delivered to an hydrogen enriched material and the cross sections of interest are obtained by means of a relativistic transformation [22]. Since the direct measurement of cross sections against a hydrogen target would be challenging, the measurement is performed evaluating both the cross sections on graphite and polyethylene targets and computing the cross section on hydrogen ions as a weighted difference of the former two [23].
At the same time FOOT will measure the direct double differential cross sections of light ions like
To perform these measurements, the FOOT collaboration is building an experimental setup [22] composed of a scintillator system for ΔE-TOF measurements, ions counting and fragment identification, a drift chamber to monitor the beam direction, a tracking system made of pixel and strip silicon detectors and permanent magnets to reconstruct the fragments momentum, and a calorimeter that will provide the fragments energy measurement. In addition, the large angle interactions will be studied using emulsion chambers acting both as active target and detector. The details about the emulsion setup and the preliminary results obtained so far can be found elsewhere [24, 25].
In this contribution, we present the results obtained by the FOOT collaboration with an oxygen beam of 400 MeV/u kinetic energy interacting with a graphite target. This measurement was part of a detector testing campaign aiming at integrating the FOOT scintillator detectors for the time of flight (TOF) and energy loss (ΔE) measurement, the start counter (SC) and the ToF-Wall (TW) detector (see Section 2) and a drift chamber, used as beam monitor (BM), in the data acquisition system. At that time, these detectors were the only ones already available for testing, but they were sufficient to perform the identification of the nuclear charge Z of the different produced fragments and measure the elemental fragmentation cross sections, presented hereafter. The measurements, integrated over the fragments production angles and kinetic energy spectra, provide new results for the fragmentation of
In Section 2 we discuss in detail the experimental apparatus used at GSI for the cross section measurement, Section 3 presents the data sample and the Monte Carlo simulation used to perform the efficiency evaluations and the background studies. In Section 4 we report the analysis strategy and all the needed steps for cross section computation. Finally the obtained results and the level of agreement with the available experimental results and the FLUKA Monte Carlo code are presented in Section 5.
The full FOOT experimental setup, as already published elsewhere [22], will consist of an upstream region composed of the pre-target detectors, aimed to monitor the incoming beam, and of a region, including the target, for the fragments tracking and identification. Two alternative and complementary setups will be adopted in FOOT in order to measure all the fragments with the accuracy required by PT and RSP applications: a setup based on a magnetic spectrometer, optimized for the identification of fragments heavier than
Only a partial FOOT setup has been used during the data taking at the GSI Heavy Ion Research Center in Darmstadt (Germany) discussed in this manuscript. The detectors ready to be tested, at that time, were the Start Counter, the Beam Monitor and the Tof-Wall (see Figure 1). The system composed by the Start Counter and the Tof-Wall provides the ΔE-TOF measurements needed for the identification of the fragments charge Z, while the system composed of Start Counter and Beam Monitor provides the number of primary ions interacting with the target. In the following paragraphs detailed descriptions of these detectors are provided.
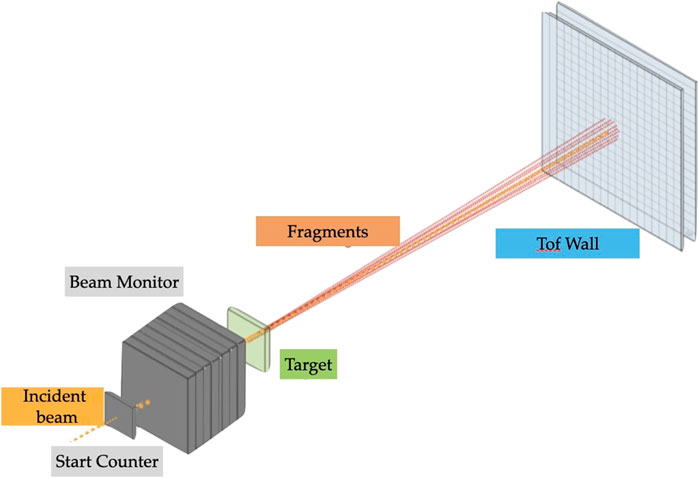
FIGURE 1. Schematic view of the GSI experimental setup. The
Beside what is shown in Figure 1, also 4 layers of 50 μm thick pixel silicon detector (MIMOSA-28 technology [22]), positioned 0.5 cm downstream the target, were present during the data acquisition. Such system is the vertex detector (VTX) of the FOOT experiment, able to reconstruct the fragmentation vertex with micrometric precision [26, 27]. During the data acquisition it was not possible to synchronize the data collected by the VTX with the rest of the apparatus. For this reason such detector is not used for the analysis reported in this manuscript, and it is only taken into account at the MC simulation level to account for the dead material crossed by the beam and the fragments while computing the fragment reconstruction efficiencies, as discussed in Section 4.2.2.
Due to the very slow readout time of 185.6 μs of the VTX, the typical
The remaining FOOT detectors were still in a phase of development, assembling and testing and for this reason will not be reviewed hereafter.
The Start Counter (SC) is made of a thin squared foil (5 cm side, 250 μm thickness) of EJ-228 plastic scintillator. The transverse dimensions have been chosen to cover the beam width available in both treatment and research centres where ion beams of interest for FOOT are delivered, while the thickness was kept to a minimum to reduce the pre-target fragmentation. The scintillator foil is held by means of an aluminum frame enclosed in a black 3D printed box to provide the light tightness needed for the detector operation (see Figure 2 left). In the black box, two squared windows are placed in correspondence of the scintillator field of view and closed with thin (4 μm) aluminized mylar. The light produced in the scintillator is collected laterally by 48 3 × 3 mm2 SiPMs, 12 per side, bundled in 8 channels, each reading an array of six SiPMs. The readout and powering of the SiPMs is handled by the WaveDAQ system [28], capable of sampling signals at rates up to five Gsamples/s in a dynamic range of 1V. The acquired waveforms are analyzed offline with a constant fraction discriminator technique to extract the event time t0. The SC, placed 44 cm upstream of the target, provides the trigger signal to the whole experiment and the measurement of incoming ion flux to be used for the cross section measurement. It provides the reference time for all the other detectors and allows the time of flight (TOF) measurement in combination with the TW. The time resolution of the SC has been measured by means of dedicated test beams and for different ions and energies. Values of ∼ 72 ps are expected when using the
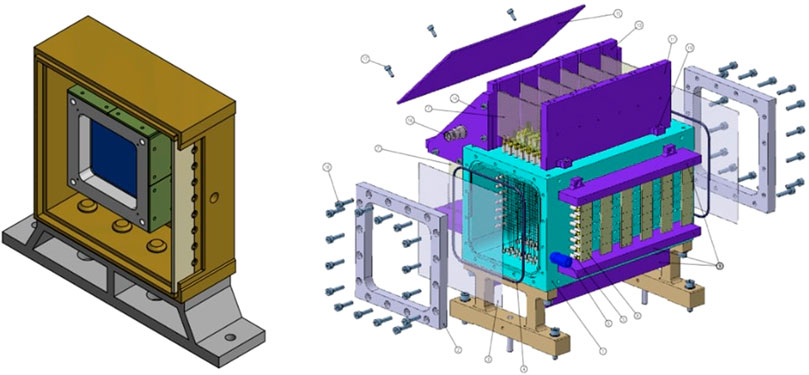
FIGURE 2. (Left) Start Counter detector inside the plastic box. The aluminum mechanical structure holds the EJ-228 plastic scintillator foil (in dark blue). (Right) Technical drawing of the Beam Monitor drift chamber. The two orthogonal views of the wires are clearly visible. Two enclosing mylar windows fixed by aluminum frames are shown as well [22]. In both representations the axes are: X horizontal perpendicular to beam, Y vertical, Z along the beam.
The Beam Monitor (BM) is a drift chamber composed of twelve wire layers, with three drift cells per layer (Figure 2 right) [31]. Planes with wires oriented along the horizontal and vertical axes are alternated to allow for the beam profile reconstruction in the transverse plane. The cell shape is rectangular (16 mm × 10 mm) with the long side orthogonal to the beam. In each view two consecutive layers are staggered by half a cell to solve left-right ambiguities in track reconstruction. The BM was operated at atmospheric pressure, at the working voltage of 1.8 kV while using an Ar/CO2, 80/20% gas mixture. The BM efficiency was measured to be ∼90% and the mean track spatial resolution was measured to be of the order of ≤100 μm [32]. The BM detector is placed between the SC and the target and is used to measure the direction and incident point of the ion beam on the target, a crucial information needed to address the pile-up ambiguity in the FOOT Vertex detector and to evaluate the pre-target fragmentation [22].
The Tof-Wall detector (TW) is composed of two orthogonal layers of 20 plastic scintillator bars (EJ-200 by Eljen Technology) wrapped with reflective aluminum and darkening black tape [30, 33]. Each bar is 0.3 cm thick, 2 cm wide and 44 cm long. The two x-y layers form a 40 × 40 cm2 active area detector that provides the deposited energy (ΔE) measurements, the needed information to compute the time of flight (using as input the t0 from SC), and the hit position. The simultaneous measurement of ΔE and TOF allows to identify the charge Z of the interacting ions [22, 30]. The TW transverse dimensions have been chosen to match the angular aperture of the heavy fragments, the TW granularity was chosen to minimize the occurrence of multiple fragments interactions in the same bar, while the bar thickness was chosen as a trade-off between a higher scintillation signal (and hence a better timing and energy resolution) and a lower secondary fragmentation probability in the bars, that would spoil the particle identification and tracking. Each TW bar edge is coupled to 4 SiPM with a 3 × 3 mm2 active area and 25 μm microcell pitch. The signals of each channel (two channels per bar) are digitized at rates of three to four Gsamples/s by the WaveDAQ system [28]. A total of 1,024 samples are collected for each signal allowing to record the whole waveform, and to extract offline the time and charge information. Thanks to the high number (4 × 14,400) of pixels per SiPM channel, this setup is able to guarantee a dynamic range spanning over two orders of magnitude and allow the identification of fragments with significantly different energy release (from proton up to oxygen fragments of different kinetic energies).
An extensive campaign of measurements has been carried out to calibrate the charge released in the TW detector bars in terms of the energy lost ΔE by the incident particles and the time difference between SC and TW in terms of TOF [30]. Several tests with different ion beams and energies have been performed to study the TW detector performances. An energy loss resolution
Two different data samples have been collected during the GSI data taking. A sample of physics runs, collecting the interactions of a
A detailed Monte Carlo simulation of the
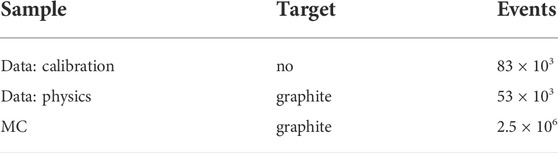
TABLE 1. Available data and MC statistics.
To correctly measure the angles of the emitted tracks and evaluate the angular acceptance needed when computing the integrated cross section, the detectors have been properly aligned taking into account small shifts and rotations with respect to the global FOOT reference frame in which the beam is directed along the z axis and centered at x,y=(0,0). For this purpose the calibration runs acquired without target were used.
Figure 3 shows the intersection points of the beam tracks reconstructed using the BM information with the target plane after performing the alignment procedure. The beam profile, although not Gaussian, is centered at the expected value of (x,y) = (0,0) in the global reference frame.
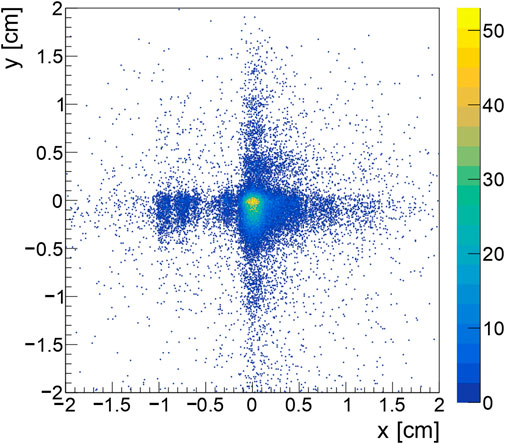
FIGURE 3. Beam profile obtained from the projection on the target plane of the beam tracks reconstructed by the BM detector.
The measured incoming oxygen ion incident position on the target (TG) and the fragment position reconstructed by the TW are used to compute the fragment exit angle from the target with a resolution better than 0.2°. The broadening of the distribution measured on the TW, located at 1.8 m from the TG position, observed in calibration runs, without target, showed a divergence of the beam of ∼5 mrad (about 0.3°) along the x and y directions.
In order to set the integration angle for the cross section measurement, the angular acceptance of the TW has to be properly taken into account. The TW detector was centered, having the central bars of both layers (bar Id equal to 9) aligned with the (0,0) cm beam position (see Figure 4). Requiring the tracks to come from a square region of the TG within [-1.0,1.0] cm with respect to the beam centre in x and y, the angular acceptance results to be 5.7°. For this reason only fragments exiting the selected target region with a polar angle less than 5.7° will be considered for the cross section measurement in the following.
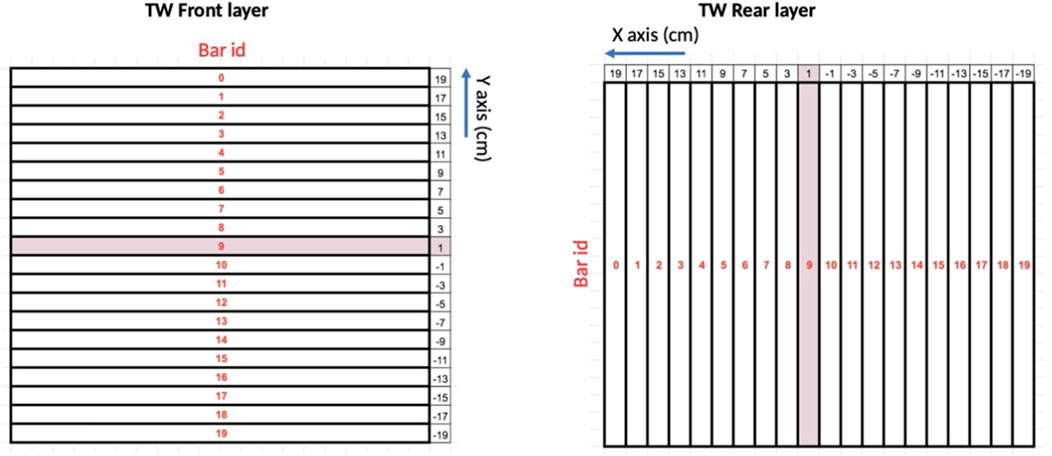
FIGURE 4. Schematic view of the TW. The correlation between the bar-Id and the detector position in X-Y plane is highlighted.
The simulation of the
The fragments reconstruction is carried out using the information available from the active detectors: the SC, the BM and the TW. The BM has been used primarily to identify and remove the events where more than one primary fragment was interacting with the target or the events in which the fragmentation occurred before the target (inside the SC or the BM itself). Using the projection of the BM reconstructed track on the target plane and measuring the particles interaction position on the TW, it was possible to measure the fragments angle. The SC and TW have been used to compute the fragments time of flight (TOF), the ΔE and their charge Z, which is the most important quantity in the computation of the elemental fragmentation cross sections.
The TW is the only detector of the GSI setup capable of identifying the fragments. The next paragraphs detail the strategy employed to identify and reconstruct the fragments. The implemented reconstruction and identification algorithms have been tested and optimised against the developed MC simulation. Finally the simulation results have been benchmarked against the available data distributions.
The fragment charge Z is evaluated for each TW hit, i.e. for each energy release in a TW bar, using both the energy loss (ΔE, measured in TW detector) and the time of flight (TOF, measured using both the TW and the SC). As already discussed in [22], the Z identification (ZID) algorithm has been developed to provide the fragment charge Z on an event by event basis, to be used as a seed for the tracking of each fragment in the final full FOOT setup when measuring the fragment rigidity p/Z. The ZID algorithm exploits the correlation between ΔE and TOF that, for a particle of charge Z, can be expressed by means of the Bethe-Bloch (BB) formula.
Figure 5 shows the ΔE vs. TOF distribution for fragments for each TW hit in the front TW layer obtained in a MC simulation. The eight regions corresponding to the eight possible fragment charges (from Z = 1 up to Z = 8) are well identified. Using the MC truth, only fragments produced inside the graphite target by an inelastic interaction of the
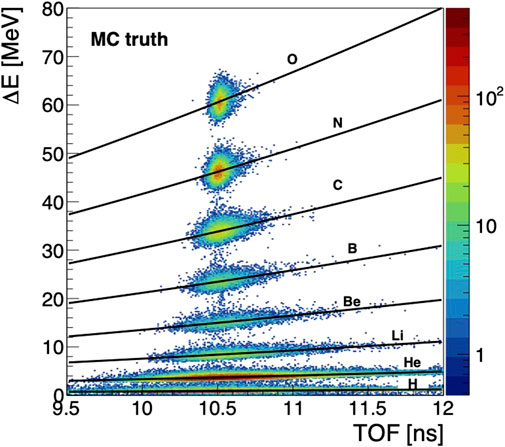
FIGURE 5. ΔE vs. TOF for fragments detected by TW detector (front layer) using the Monte Carlo truth information from a simulation of a 400 MeV/u
The ZID algorithm proceeds assigning the Z value, in each TW layer, to each hit in the (ΔE, TOF) plane using a simple dichotomy algorithm to identify the closest Bethe-Bloch curve among the ones related to each charge hypothesis. The algorithm is applied in the same way both to the MC simulation, once the TW experimental ΔE and TOF resolutions are included, and to the data-set collected at GSI. To do so, the ΔE and TOF have to be properly calibrated, as discussed in Section 2.3 and shown in [30, 33]. In Figure 6 the BB curves extracted from the MC truth, as discussed above, are superimposed to the (ΔE, TOF) distribution in the case of the reconstructed MC (left) and in the case of data after the calibration procedure (right).
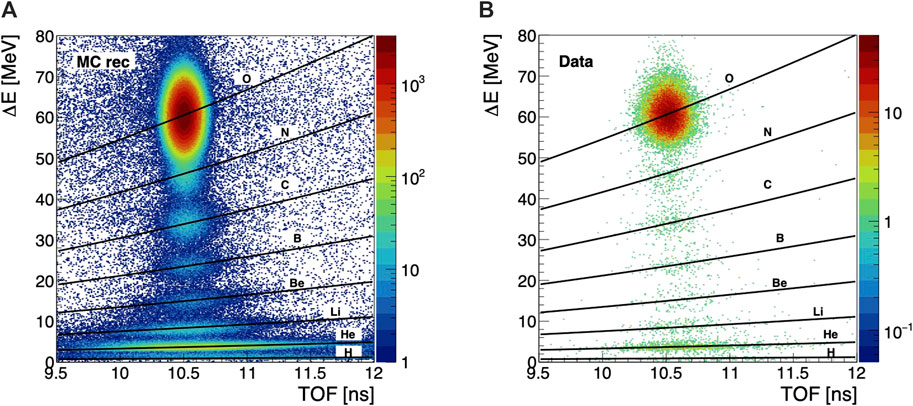
FIGURE 6. (Left) ΔE vs. TOF distribution for the MC simulation, once the detector response is included. (Right) ΔE vs. TOF distribution for the GSI data. The Bethe-Bloch curves are superimposed.
To check the data-MC agreement, the quantities reconstructed by the TW, i.e. ΔE and TOF, have been compared in data and MC. In Figure 7 the comparison is displayed for lithium (Z = 3) and carbon (Z = 6) fragments. The data-MC agreement obtained demonstrate the correct implementation of the ZID algorithm. This agreement is strongly dependent on the ΔE and TOF calibration procedure and on the ΔE and TOF resolutions extracted from data and implemented in MC. Varying these resolutions within the statistical experimental error could have an impact on the fragment charge selection and such variation has therefore been considered in the systematic study discussed in Section 5.
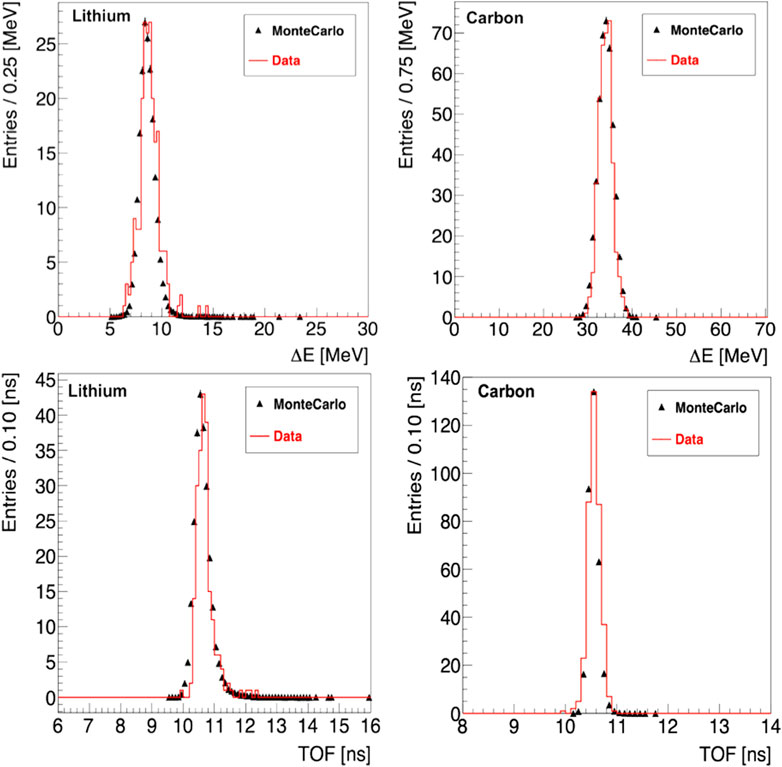
FIGURE 7. Comparison of ΔE and TOF extracted from GSI data and ΔE and TOF extracted from the MC simulations of a
To reconstruct the space position of a fragment that interacts with the TW detector, the front and rear TW hits that provide respectively the (x,z) and (y,z) separate information, have to be matched. The clustering algorithm is used to pair the hits detected in the two layers and to find the proper match, corresponding to the single fragment that crossed the TW in a unique point. This matching procedure is fundamental to retrieve the correct number of ions that hit the scintillator wall, assigning to them unique values of ΔE, TOF, position and charge Z. To combine the hits from the two layers, a simple method that assigns to each hit of a given layer the closest hit of the other one can be implemented.
While the case of a single particle is straightforward the case of two or more fragments impinging on the TW is more complex. Considering for example the case of two fragments: 2 bars in the front and 2 bars in the rear layers are expected to be hit. The simple bar crossing provides in this case 4 possible positions, but only two are related to the real fragment hitting positions, while the other two are the result of the combinatorial algorithm that computes all the possible pairs. In that case, to select the closest hit among orthogonal bars the propagation of the light signal along a given bar and the time difference between the bar edges, as calibrated in [33], is exploited to provide an additional information about where the fragment hit the bar. Such information is crucial to reduce the impact of the possible geometrical hit combinations that increases with the square of the number of detected hits in both layers.
The matching algorithm results are affected by many physical processes that are contributing with unavoidable background sources to the fragments signal: multiple interactions of fragments in a single bar in the same event, secondary fragmentation, fragments crossing multiple bars on the same layer. The impact of all these sources was studied using the FLUKA MC simulation and is detailed here-after.
• The reconstruction of a TW cluster (point in space obtained matching an hit in the front and an hit in the rear layers) starts using the hits from the layer with the highest occupancy, in a given event. In this way, it is possible to improve the handling of the cases in which multiple fragments hit the same bar in one of the 2 TW layers. Such events occur in
• The second process affecting the fragments position reconstruction is the secondary fragmentation occurring within the TW detector itself. This process accounts for
• Another possibility that was considered is the case in which a fragment releases its energy across 2 bars of the same layer. Such event occurs with a
To reduce the impact of this background, the clustering algorithm implements an additional requirement, constraining both hits in the front and rear layer to have the same charge Z when performing the matching. In the final FOOT setup [22] the tracking system and the global reconstruction algorithm will be able to reduce this spurious reconstructed points in the TW. As the data presented in this manuscript were taken in the absence of any tracking system, the charge Z matching between the front and rear hits was required to increase the sample purity. The impact of this choice has been evaluated through the efficiencies study (see Section 4.2.2). To check the data-MC agreement for each TW point the differences between the values of the ΔE and TOF of the two matched hits have been computed for MC and data events, and are shown in Figure 8.
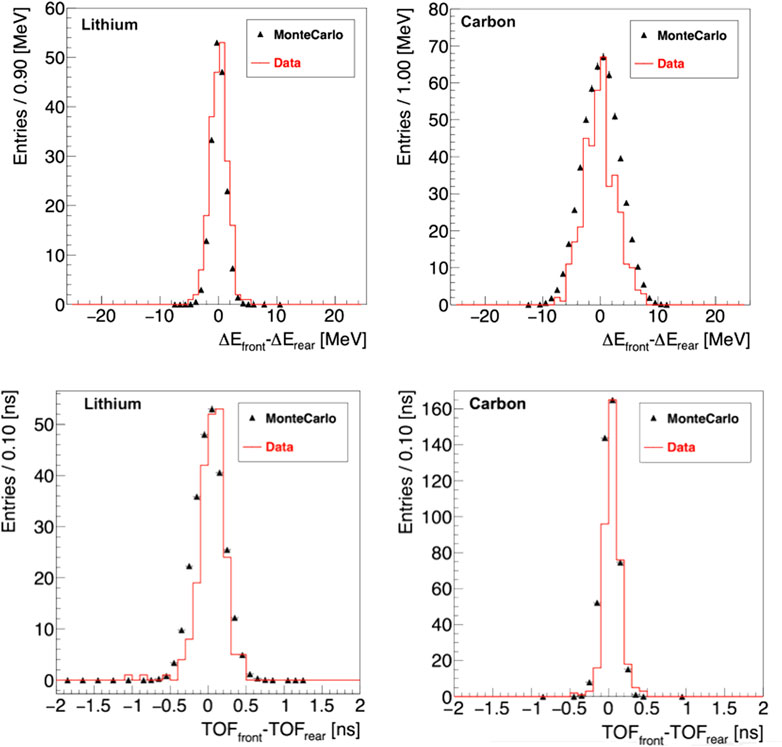
FIGURE 8. Comparison of ΔE and the TOF taken from the 2 TW layers extracted from GSI data and from MC reconstructed simulations of a
To evaluate both the combination of ZID and clustering algorithm efficiency and the fraction of fragments whose charge is not correctly identified, the MC simulation was used. For each reconstructed fragment, the MC information has been accessed to check whether the reconstructed charge was matching the true one. The results are shown in Figure 9 that displays the reconstructed charge (x axis) vs. the true one (y axis, extracted matching the reconstructed energy release with the particle responsible for it). The non-diagonal elements of the matrix have been used to compute the fraction of mis-reconstructed charges for each fragment type.
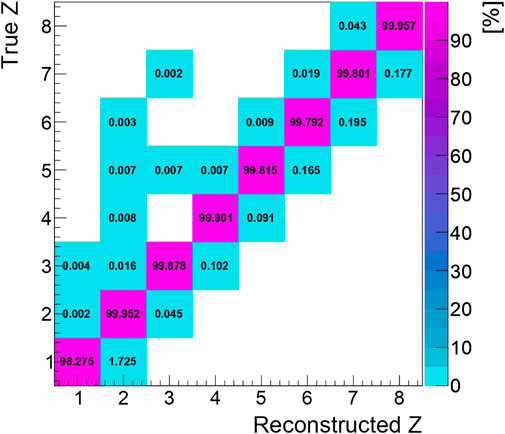
FIGURE 9. MC simulation: correlation between the charge reconstructed by the ZID algorithm (x-axis) and the real charge extracted from the Monte Carlo truth (y-axis). For each bin the probability to reconstruct the charge Z for a given real charge from MC truth is reported.
As shown in Figure 9 the matrix is almost diagonal. The contribution of mis-reconstructed charges has been considered in this manuscript as negligible, being of the order of few percent for (Zrec = 2; Ztrue = 1) and less of 0.2% for all the other elements of the matrix, well below the relative statistical uncertainties on the final fragmentation cross-sections (see Section 4.2). The elements of the matrix that are closest to the diagonal, are easily explained by the reconstruction method limited resolution. The elements in the top left corner are related to the events in which an initial fragment hits, and releases a part of its energy, in two adjacent bars resulting in two distinct hits that can have very low and different charges. All these last contributions, well below 2%, can be neglected when considering the cross section measurements presented in this manuscript.
The fragmentation cross section was computed for each Z population using the following equation:
where Δθ is the experimental setup angular acceptance (5.7°), Emin and Emax are the fragments minimum and maximum kinetic energies, Nfrag(Z) is the number of identified fragments, Nprim is the number of initial
in which:
1) ρ = 1.83 g/cm3 is, for example, the graphite target density;
2) dx = 0.5 cm is the target thickness;
3) NA is the Avogadro’s number;
4) A = 12.0107 g/mol is the graphite mass number.
The thickness of the target was measured accurately by the metrology department of LNS labs of INFN with an uncertainty well below 1%. For that reason, we have considered it totally negligible as far as the uncertainty budget in the measurement is concerned.
In the following paragraphs we will detail the measurements of all the quantities that appear in Eq. 1, the method used to reject the out of target fragmentation and the calculation of the reconstruction efficiencies.
A key quantity entering the cross section calculation is the number of primaries Nprim interacting with the target. The primary ions count was provided by the Start Counter. Indeed a minimum bias trigger requiring a majority of five SC channels over the total eight (see Section 2.1) was implemented. During the GSI data taking, a total of 53 × 103 events, for physics runs, and 83 × 103 events, for calibration runs, have been collected (see Table 1). Further selections are applied to get the final number of primaries Nprim used for the cross section measurement, as explained in the following. A single, well reconstructed track inside the BM has been required in order to reject the events in which multiple tracks are detected (as in the case of pre-target fragmentation events occurred in air or in detectors upstream the target (SC and BM)), and also to reject the events in which the BM was not efficient, reconstructing no tracks. This choice assure the selection of a very clean sample and a correct measurement of the produced fragments angle, impossible without a BM reconstructed track, in spite of a reduced overall statistics. A total of ∼ 32 × 103 events in physics runs, and ∼ 61 × 103 events in calibration runs, were finally selected requiring that the fragments originated from the centre (±1 cm) of the target, corresponding to a forward angular coverage of the experimental setup of
The reconstruction efficiencies [ɛ(Z) in Eq. 1] are defined according to the following equation:
where NTW(Z) are the fragments with charge Z reconstructed by the TW (identified by the ZID and clustering algorithms) and Nprod(Z) are the fragments with charge Z produced in the nuclear interaction between the primary beam and target material (TG), that exit the target and are produced within the TW acceptance. Such efficiency is used to compute the number of fragments that have enough energy to exit from the 5 mm thick target.
The efficiencies were evaluated using the full reconstructed Monte Carlo simulation of the 400 MeV/u
The efficiencies were computed considering for both the numerator and the denominator of Eq. 3 only the primary fragmentation events occurring in the target. A selection performed using the MC truth information was hence implemented, requiring fragments produced in the phase space limited by the TW angular acceptance of Δθ = 5.7° and with a kinetic energy falling in the range (see Eq. 1) of [Emin, Emax] = [100, 600] MeV/u. Such range was identified to exclude the low energy fragments coming mainly from the target fragmentation process. This choice can be understood looking at Figure 10, where the production kinetic energy of He fragments is correlated to their production angle. The bulk of the produced Helium ions is contained in the selected phase space. The use of the same angular and kinetic energy selection for all the heavier produced fragments is justified by the fact that both angular and kinetic energy distribution for these fragments are narrower than the case of Helium [13–16, 20–22]. Hydrogen is not considered in this analysis, due to the threshold set on the TW DAQ that cut-off a not negligible fraction of such fragments, as already mentioned in Section 2.3.
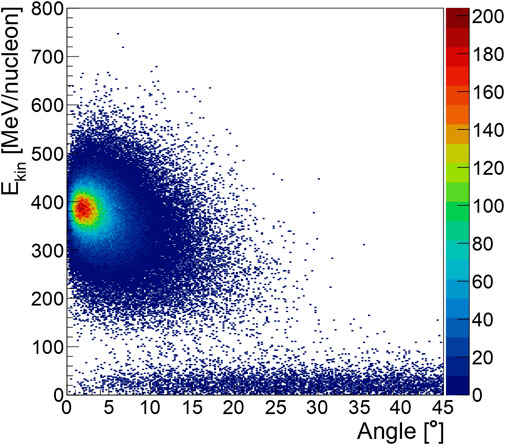
FIGURE 10. MC simulation: Production kinetic energy of He fragments versus their production angle. The contribution of the isotropic low energy target He fragments is clearly visible and well separated from the Helium ions coming from the projectile fragmentation.
The number of fragments detected by the TW (NTW(Z)) was computed using the full TW reconstruction as described in 4.1.1 and 4.1.2. The reconstructed efficiencies, evaluated in the selected phase space (in angular and kinetic energy), hence are taking care of the detector intrinsic efficiency and of the ZID and clustering algorithms reconstruction efficiencies. The calculated values of the efficiencies ɛ(Z), for each fragment, are shown in Table 2.
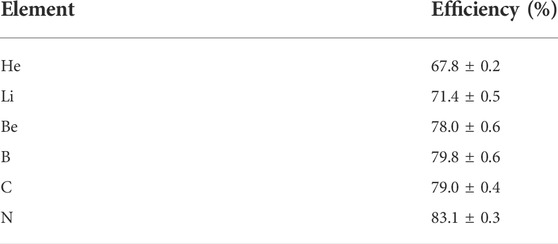
TABLE 2. Integrated efficiencies for fragments with different charge.
The fragments yields Nfrag(Z), in Eq. 1, extracted by the TW detector have contributions from fragmentation interactions taking place inside or outside target. The fragments produced within the target, from a direct interaction of a primary
To evaluate the impact of this background source on the fragment yields Nfrag(Z), the MC simulation was used. Figure 11 shows, with a black continuous line, the energy loss for all the reconstructed particles, including all the primary ions. The contribution of the out-of-target fragmentation (red distribution in Figure 11) to the total can be as large as ∼25% and hence a background subtraction method has to be introduced in data. The remaining fragmentation is the in-target fragmentation (blue distribution in Figure 11), which is our “signal” (∼ 75% of the total fragmentation), while only the ∼ 0.7% of the total is the secondary fragmentation inside the target itself, which is an irreducible background and produces a very small systematic effect on the final cross sections (well within the final experimental uncertainties, see Section 5).
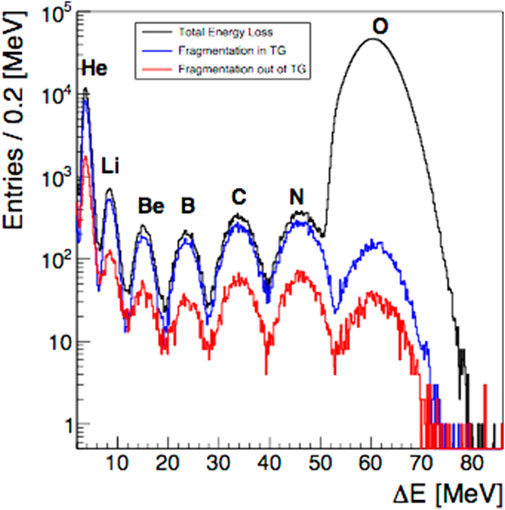
FIGURE 11. Energy loss distribution for the fragments reconstructed by the TW detector (black), primary fragmentation coming from the TG in the TW acceptance (blue) and primary fragmentation out of TG impinging on TW (red). A full MC simulation has been used to disentangle the different contributions.
To understand where the out-of-target fragmentation occurs, the MC simulation has been used. Beside the interactions with the BM windows and the VTX detector planes positions, most of the out-of-target fragmentation
The study performed by means of the MC simulation clearly indicates that the contribution of the out-of-target fragmentation is not negligible and strongly affects the measurement of Nfrag(Z) in Eq. 1. This means that such contribution has to be properly accounted for. Calibration runs acquired without the graphite target were used to measure the contribution of the out-of-target fragmentation directly from the data sample. Each run was properly calibrated to achieve a response, in ΔE and TOF variables, comparable with the ones used to measure the cross section. The yields of each fragment type were measured using the TW reconstruction algorithm described before, for both the data sample (physics runs and calibration runs). The values for run with TG (Signal + Background, physics runs) and without TG (Background, calibration runs) are displayed in Table 3.
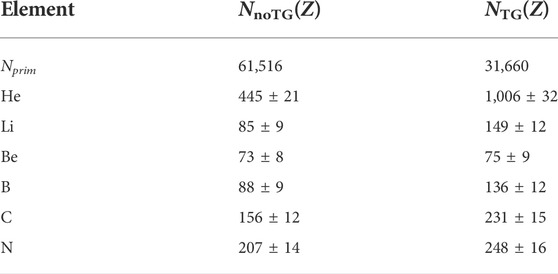
TABLE 3. Fragment yields extracted from GSI data for signal (fragmentation in TG + out of TG) and for background (fragmentation out of TG).
When accounting for the out of target fragmentation, Nfrag(Z) of Eq. 1 has to be corrected, taking into account also the right Nprim normalization, as:
where
From the measurement and the evaluation of all the variables in Eq. 1, the elemental fragmentation cross sections for a 400 MeV/u
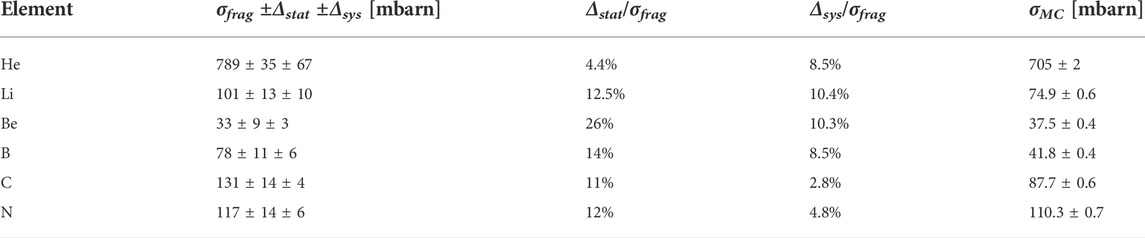
TABLE 4. Elemental fragmentation cross sections measured in this work, for a 400 MeV/u
Two main sources of systematic uncertainties have been studied in detail: the impact of the event selection performed using the BM and of the requirements on the fragments reconstruction inside the TW. The former systematic has been studied performing the cross section measurement implementing different selection criteria when constraining the beam direction projection on the target with respect to the default value of [-1; 1] cm. The explored intervals [(−0.4; 0.4) cm and (−0.7; 0.7) cm] were chosen to verify that the beam shape had a small impact in defining the angular acceptance of the measurement. As the beam was not perfectly Gaussian around the target centre, the cross section measurements in different ranges allowed to verify the dis-uniformity impact. The impact of this systematic uncertainty was found to be less than 1% for all the ions with the only exception of He (
The quality of the BM reconstructed tracks has been checked as well. A tight and a loose selection of the BM hits to be associated to a track, has been implemented and tested to verify the impact on the event preselection on the cross section measurements. The impact of this systematic uncertainty was found to be in the range [1%–4%] for all the ions increasing for the lighter ions.
Another source of systematic uncertainty is related to the charge reconstruction algorithm and has been studied varying in the MC simulation the resolutions, within the experimental precision, in ΔE, Tof and position measurements that affect the identification of the fragments in MC and so the efficiencies evaluation. The only significant contribution was found to be the one related to the Helium yields (
In this manuscript, we presented the measurement of the elemental fragmentation cross sections of a 400 MeV/u oxygen beam interacting with a 5 mm graphite target. A reduced FOOT setup composed of a beam monitor drift chamber and a system of scintillating detectors for the energy loss (ΔE) and the time of flight (TOF) measurements has provided the needed identification capability to resolve fragments with different charge Z. The experimental setup employed at GSI allowed to obtain cross section measurements with an overall relative statistical uncertainty of the order of 10% for most of the detected fragment charges. The systematic uncertainties are below the statistical ones in nearly all the cases, showing that the limited statistics collected severely impacts the presented measurement precision. At the same time there is still room to improve in the future the overall systematic uncertainties, exploiting the full FOOT apparatus and developing more precise strategies for the fragments tracking and identification. Despite the reduced experimental setup and the available statistics the measured elemental fragmentation cross sections were able to fill the gap of the needed measurements for PT and RPS applications. The production cross sections of the measured elements are of the order of 100 mb, with the exception of the production of Be (about one-third lower) and of He which is significantly larger (about 7 time more). In particular the results obtained for the production of He and Li are the first ever measured for a 400 MeV/u
The original contributions presented in the study are included in the article, further inquiries can be directed to the corresponding author.
All authors of the FOOT collaboration have made a substantial, direct, and intellectual contribution to the work and approved it for publication.
The data presented here has been collected within the framework of the ESA IBER 2017 Research Program: “Investigations into Biological Effects of Radiation Using the GSI Accelerator Facility” at the GSI Helmholtzzentrum fuer Schwerionenforschung in Darmstadt (Germany).
The authors declare that the research was conducted in the absence of any commercial or financial relationships that could be construed as a potential conflict of interest.
All claims expressed in this article are solely those of the authors and do not necessarily represent those of their affiliated organizations, or those of the publisher, the editors and the reviewers. Any product that may be evaluated in this article, or claim that may be made by its manufacturer, is not guaranteed or endorsed by the publisher.
1. Durante A, Paganetti A. Nuclear physics in particle therapy: A review. Rep Prog Phys (2016) 79:096702. doi:10.1088/0034-4885/79/9/096702
2. Durante A. Space radiation protection: Destination Mars. Life Sci Space Res (2014) 1:2–9. doi:10.1016/j.lssr.2014.01.002
3. Durante A, Cucinotta A. Physical basis of radiation protection in space travel. Rev Mod Phys (2011) 83:1245–81. doi:10.1103/RevModPhys.83.1245
4. Norbury A, Miller A, Adamczyk A, Heilbronn A, Townsend A, Blattnig A, et al. Nuclear data for space radiation. Radiat Meas (2012) 45:315–63. doi:10.1016/j.radmeas.2012.03.004
5. Krämer A, Durante A. Ion beam transport calculations and treatment plans in particle therapy. Eur Phys J D (2010) 60:195–202. doi:10.1140/epjd/e2010-00077-8
6. Heinbockel A, Slaba A, Blattnig A, Tripathi A, Townsend A, Handler A, et al. Comparison of the transport codes hzetrn, hetc and fluka for a solar particle event. Adv Space Res (2011) 47:1079–88. doi:10.1016/j.asr.2010.11.012
7. Thwaites A. Accuracy required and achievable in radiotherapy dosimetry: Have modern technology and techniques changed our views? J Phys : Conf Ser (2013) 444:012006. doi:10.1088/1742-6596/444/1/012006
8. Sommerer A, Parodi A, Ferrari A, Poljanc A, Enghardt A, Aiginger A. Investigating the accuracy of the fluka code for transport of therapeutic ion beams in matter. Phys Med Biol (2006) 51:4385–98. doi:10.1088/0031-9155/51/17/017
9. Sato A, Kase A, Watanabe A, Niita A, Sihver A. Biological dose estimation for charged-particle therapy using an improved phits code coupled with a microdosimetric kinetic model. Radiat Res (2009) 171:107–17. doi:10.1667/RR1510.1
10. Bohlen A, Cerutti A, Dosanjh A, Ferrari A, Gudowska A, Mairani A, et al. Benchmarking nuclear models of fluka and geant4 for carbon ion therapy. Phys Med Biol (2010) 55:5833–47. doi:10.1088/0031-9155/55/19/014
11. Bolst D, Cirrone GA, Cuttone G, Folger G, Incerti S, Ivanchenko V, et al. Validation of geant4 fragmentation for heavy ion therapy. Nucl Instr Methods Phys Res Section A: Acc Spectrometers, Detectors Associated Equipment (2017) 869:68–75. doi:10.1016/j.nima.2017.06.046
12. Dudouet J, Cussol D, Durand D, Labalme M. Benchmarking geant4 nuclear models for hadron therapy with 95 mev/nucleon carbon ions. Phys Rev C (2014) 89:054616. doi:10.1103/PhysRevC.89.054616
13. Napoli MD, Agodi C, Battistoni G, Blancato AA, Cirrone GAP, Cuttone G, et al. Carbon fragmentation measurements and validation of the geant4 nuclear reaction models for hadrontherapy. Phys Med Biol (2012) 57:7651–71. doi:10.1088/0031-9155/57/22/7651
14. Dudouet J, Labalme M, Cussol D, Finck C, Rescigno R, Rousseau M, et al. Zero-degree measurements of C 12 fragmentation at 95 MeV/nucleon on thin targets. Phys Rev C (2014) 89:064615. doi:10.1103/PhysRevC.89.064615
15. Dudouet J, Juliani D, Labalme M, Cussol D, Angélique JC, Braunn B, et al. Double differential fragmentation cross-section measurements of 95 MeV/u 12C on thin targets for hadrontherapy. Phys Rev C (2013) 88:024606. doi:10.1103/PhysRevC.88.024606
16. Toppi M, Abou-Haidar Z, Agodi C, Alvarez MAG, Aumann T, Balestra F, et al. Measurement of fragmentation cross sections of 12C ions on a thin gold target with the FIRST apparatus. Phys Rev C (2016) 93:064601. doi:10.1103/PhysRevC.93.064601
17. Zeitlin C, Heilbronn L, Miller J, Rademacher SE, Borak T, Carter TR, et al. Heavy fragment production cross sections from 1.05 GeV/nucleon 56Fe in C, Al, Cu, Pb, and CH2 targets. Phys Rev C (1997) 56:388–97. doi:10.1103/PhysRevC.56.388
18. Zeitlin C, Guetersloh S, Heilbronn L, Miller J, Fukumura A, Iwata Y, et al. Fragmentation cross sections of 290 and 400 MeV/nucleon 12C beams on elemental targets beams on elemental targets. Phys Rev C (2007) 76:014911. doi:10.1103/PhysRevC.76.014911
19. Zeitlin C, Miller J, Guetersloh S, Heilbronn L, Fukumura A, Iwata Y, et al. Fragmentation of n 14 , o 16 , ne 20 , and mg 24 nuclei at 290 to 1000 mev/nucleon. Phys Rev C (2011) 83. doi:10.1103/PhysRevC.83.034909
20. Marafini M, Paramatti R, Pinci D, Battistoni G, Collamati F, Lucia ED, et al. Secondary radiation measurements for particle therapy applications: Nuclear fragmentation produced by 4he ion beams in a PMMA target. Phys Med Biol (2017) 62:1291–309. doi:10.1088/1361-6560/aa5307
21. Rovituso M, Schuy C, Weber U, Brons S, Cortés-Giraldo MA, Tessa CL, et al. Fragmentation of 120 and 200 MeV u-1 4he ions in water and PMMA targets. Phys Med Biol (2017) 62:1310–26. doi:10.1088/1361-6560/aa5302
22. Battistoni G, Toppi M, Patera V, Collaboration TF. Measuring the impact of nuclear interaction in particle therapy and in radio protection in space: The foot experiment. Front Phys (2021) 8. doi:10.3389/fphy.2020.568242
23. Mattei I, Alexandrov A, Alunni Solestizi L, Ambrosi G, Argirò S, Bartosik N, et al. Measurement of 12c fragmentation cross sections on c, o, and h in the energy range of interest for particle therapy applications. IEEE Trans Radiat Plasma Med Sci (2020) 4:269–82. doi:10.1109/TRPMS.2020.2972197
24. Montesi M, Lauria A, Alexandrov A, Solestizi LA, Giovanni A, Argirò S, et al. Ion charge separation with new generation of nuclear emulsion films. Open Phys (2019) 17:233–40. doi:10.1515/phys-2019-0024
25. Galati G, Alexandrov A, Alpat B, Ambrosi G, Argirò S, Diaz RA, et al. Charge identification of fragments with the emulsion spectrometer of the foot experiment. Open Phys (2021) 19:383–94. doi:10.1515/phys-2021-0032
26. Rescigno R, Finck C, Juliani D, Spiriti E, Baudot J, Abou Haidar Z, et al. Performance of the reconstruction algorithms of the first experiment pixel sensors vertex detector. Nucl Instr Methods Phys Res Section A: Acc Spectrometers, Detectors Associated Equipment (2014) 767:34–40. doi:10.1016/j.nima.2014.08.024
27. Greiner L, Anderssen E, Matis H, Ritter H, Schambach J, Silber J, et al. A maps based vertex detector for the star experiment at rhic. Nucl Instr Methods Phys Res Section A: Acc Spectrometers Detectors Associated EquipmentInternational Workshop Semiconductor Pixel Detectors Particles Imaging 2010 (2011) 650:68–72. doi:10.1016/j.nima.2010.12.006
28. Galli L, Baldini A, Cei F, Chiappini M, Francesconi M, Grassi M, et al. Wavedaq: An highly integrated trigger and data acquisition system. Nucl Instr Methods Phys Res Section A: Acc Spectrometers Detectors Associated EquipmentFrontier Detectors Frontier Phys 14th Pisa Meet Adv Detectors (2019) 936:399–400. doi:10.1016/j.nima.2018.07.067
29. Traini G, Alexandrov A, Alpat B, Ambrosi G, Argiro S, Arteche D, et al. Performance of the tof detectors in the foot experiment (2020). doi:10.1393/ncc/i2020-20016-5
30. Kraan A, Zarrella R, Alexandrov A, Alpat B, Ambrosi G, Argirò S, et al. Charge identification of nuclear fragments with the foot time-of-flight system. Nucl Instr Methods Phys Res Section A: Acc Spectrometers, Detectors Associated Equipment (2021) 1001:165206. doi:10.1016/j.nima.2021.165206
31. Abou Haidar Z, Agodi C, Alvarez M, Anelli M, Aumann T, Battistoni G, et al. Performance of upstream interaction region detectors for the first experiment at gsi. J Instrum (2012) 7:P02006. doi:10.1088/1748-0221/7/02/P02006
32. Dong Y, Gianluigi S, Sofia C, Andrey A, Behcet A, Giovanni A, et al. The drift chamber detector of the foot experiment: Performance analysis and external calibration. Nucl Instr Methods Phys Res Section A: Acc Spectrometers, Detectors Associated Equipment (2021) 986:164756. doi:10.1016/j.nima.2020.164756
33. Morrocchi M, Belcari N, Bianucci S, Camarlinghi N, Carra P, Ciarrocchi E, et al. Performance evaluation of the tof-wall detector of the foot experiment. IEEE Trans Nucl Sci (2021) 68:1161–8. doi:10.1109/TNS.2020.3041433
34. Ferrari A, Sala PR, Fasso A, Ranft J. Fluka: A multi-particle transport code (program version 2005) (2005). doi:10.2172/877507
35. Böhlen T, Cerutti F, Chin M, Fassò A, Ferrari A, Ortega P, et al. The fluka code: Developments and challenges for high energy and medical applications. Nucl Data Sheets (2014) 120:211–4. doi:10.1016/j.nds.2014.07.049
36. Webber WR, Kish JC, Schrier DA. Individual charge changing fragmentation cross sections of relativistic nuclei in hydrogen, helium, and carbon targets. Phys Rev C (1990) 41:533–46. doi:10.1103/PhysRevC.41.533
37. Webber WR, Kish JC, Schrier DA. Total charge and mass changing cross sections of relativistic nuclei in hydrogen, helium, and carbon targets. Phys Rev C (1990) 41:520–32. doi:10.1103/PhysRevC.41.520
Keywords: fragmentation, cross section, timing detectors, particle therapy, space radioprotection
Citation: Toppi M, Sarti A, Alexandrov A, Alpat B, Ambrosi G, Argirò S, Diaz RA, Barbanera M, Bartosik N, Battistoni G, Belcari N, Biondi S, Bisogni MG, Bon M, Bruni G, Carra P, Cavanna F, Cerello P, Ciarrocchi E, Clozza A, Colombi S, De Lellis G, De Gregorio A, Del Guerra A, De Simoni M, Di Crescenzo A, Di Ruzza B, Donetti M, Dong Y, Durante M, Ferrero V, Fiandrini E, Finck C, Fiorina E, Fischetti M, Francesconi M, Franchini M, Franciosini G, Galati G, Galli L, Giraudo G, Hetzel R, Iarocci E, Ionica M, Iuliano A, Kanxheri K, Kraan AC, La Tessa C, Laurenza M, Lauria A, Torres EL, Marafini M, Massa M, Massimi C, Mattei I, Meneghetti A, Mengarelli A, Mirabelli R, Moggi A, Montesi MC, Morone MC, Morrocchi M, Muraro S, Murtas F, Muscato A, Pastore A, Pastrone N, Patera V, Pennazio F, Peverini F, Placidi P, Pullia M, Ramello L, Reidel C, Ridolfi R, Rosso V, Sanelli C, Sartorelli G, Sato O, Savazzi S, Scavarda L, Schiavi A, Schuy C, Scifoni E, Sciubba A, Sécher A, Selvi M, Servoli L, Silvestre G, Sitta M, Spighi R, Spiriti E, Sportelli G, Stahl A, Tomassini S, Tommasino F, Tioukov V, Traini G, Trigilio A, Valle SM, Vanstalle M, Weber U, Zarrella R, Zoccoli A and Villa M (2022) Elemental fragmentation cross sections for a 16O beam of 400 MeV/u kinetic energy interacting with a graphite target using the FOOT ΔE-TOF detectors. Front. Phys. 10:979229. doi: 10.3389/fphy.2022.979229
Received: 27 June 2022; Accepted: 14 September 2022;
Published: 02 November 2022.
Edited by:
Giuseppe Mandaglio, University of Messina, ItalyReviewed by:
Antonio Trifirò, University of Messina, ItalyCopyright © 2022 Toppi, Sarti, Alexandrov, Alpat, Ambrosi, Argirò, Diaz, Barbanera, Bartosik, Battistoni, Belcari, Biondi, Bisogni, Bon, Bruni, Carra, Cavanna, Cerello, Ciarrocchi, Clozza, Colombi, De Lellis, De Gregorio, Del Guerra, De Simoni, Di Crescenzo, Di Ruzza, Donetti, Dong, Durante, Ferrero, Fiandrini, Finck, Fiorina, Fischetti, Francesconi, Franchini, Franciosini, Galati, Galli, Giraudo, Hetzel, Iarocci, Ionica, Iuliano, Kanxheri, Kraan, La Tessa, Laurenza, Lauria, Torres, Marafini, Massa, Massimi, Mattei, Meneghetti, Mengarelli, Mirabelli, Moggi, Montesi, Morone, Morrocchi, Muraro, Murtas, Muscato, Pastore, Pastrone, Patera, Pennazio, Peverini, Placidi, Pullia, Ramello, Reidel, Ridolfi, Rosso, Sanelli, Sartorelli, Sato, Savazzi, Scavarda, Schiavi, Schuy, Scifoni, Sciubba, Sécher, Selvi, Servoli, Silvestre, Sitta, Spighi, Spiriti, Sportelli, Stahl, Tomassini, Tommasino, Tioukov, Traini, Trigilio, Valle, Vanstalle, Weber, Zarrella, Zoccoli and Villa. This is an open-access article distributed under the terms of the Creative Commons Attribution License (CC BY). The use, distribution or reproduction in other forums is permitted, provided the original author(s) and the copyright owner(s) are credited and that the original publication in this journal is cited, in accordance with accepted academic practice. No use, distribution or reproduction is permitted which does not comply with these terms.
*Correspondence: A. De Gregorio, QW5nZWxpY2EuRGVncmVnb3Jpb0B1bmlyb21hMS5pdA==
Disclaimer: All claims expressed in this article are solely those of the authors and do not necessarily represent those of their affiliated organizations, or those of the publisher, the editors and the reviewers. Any product that may be evaluated in this article or claim that may be made by its manufacturer is not guaranteed or endorsed by the publisher.
Research integrity at Frontiers
Learn more about the work of our research integrity team to safeguard the quality of each article we publish.