- 1Department of Physics and Astronomy, Seoul National University, Seoul, South Korea
- 2Institute of Applied Physics, Seoul National University, Seoul, South Korea
- 3Department of Electrical and Computer Engineering, University of Minnesota, Minneapolis, MN, United States
In eukaryotic cells, RNA polymerase II synthesizes mRNA in three stages, initiation, elongation, and termination, and numerous factors determine how quickly a gene is transcribed to produce mRNA molecules through these steps. However, there are few techniques available to measure the rate of each step in living cells, which prevents a better understanding of transcriptional regulation. Here, we present a quantitative analysis method to extract kinetic rates of transcription from time-lapse imaging data of fluorescently labeled mRNA in live cells. Using embryonic fibroblasts cultured from two knock-in mouse models, we monitored transcription of β-actin and Arc mRNA labeled with MS2 and PP7 stem–loop systems, respectively. After inhibiting transcription initiation, we measured the elongation rate and the termination time by fitting the time trace of transcription intensity with a mathematical model function. We validated our results by comparing them with those from an autocorrelation analysis and stochastic simulations. This live-cell transcription analysis method will be useful for studying the regulation of elongation and termination steps, providing insight into the diverse mechanisms of transcriptional processes.
Introduction
Complex regulation of eukaryotic gene expression starts with transcription, through which information in DNA is copied into mRNA. At the site of transcription, RNA polymerase II (Pol II) reads a DNA code and synthesizes mRNA, and three distinct steps can be considered to comprise the transcription procedure: initiation, elongation, and termination. Initiation is the first step in which Pol II binds to a promoter sequence at the 5ʹ end of a gene [1]. In the elongation step, Pol II reads DNA, synthesizes mRNA, and moves from the 5ʹ end to the 3ʹ end [2]. Termination is the last step in which mRNA and Pol II are released from the 3ʹ end of the gene [3, 4]. Thus, three kinetic rates corresponding to each step can be defined: the initiation rate
In recent years, various RNA sequencing methods have been developed to study elongation and pausing of Pol II at the promoter proximal region, intron-exon junctions, and nucleosomes [5–7]. These methods revealed not only the nascent RNA density in the steady state but also the elongation rate in time-resolved experiments. For such time-resolved measurements, transcription was induced or inhibited to track progression of Pol II after drug treatment, whereby the progression speed of the sequence read density directly reflected the elongation rate [8–11]. Nevertheless, population studies cannot resolve the transcriptional processes occurring at a single gene locus and lack the temporal resolution to investigate fast dynamics in real time.
Live-cell imaging has been applied to study transcriptional dynamics in single cells by labeling mRNA, Pol II, or transcription factors with fluorescent proteins [12, 13]. Fluorescence recovery after photobleaching (FRAP) technique has been used to measure transcriptional kinetic rates by fitting recovery curves with various model functions: half recovery time [14], linear and exponential fitting [15–17], and solutions of rate equations [18–21]. However, there is concern about the accuracy of kinetic modeling using FRAP because recovery curves can be affected by photobleaching, diffusion, and binding of fluorescent particles; additionally, different kinetic models can fit the same experimental data almost equally well [22]. More recently, fluctuation correlation analysis of fluorescently labeled mRNA was used to measure the transcription initiation rate and dwell time of a transcript of a yeast gene [23]. In this analysis, the dwell time consists of the elongation and termination times, which cannot be separated in the steady state. Nevertheless, the authors were able to calculate the elongation rate and the termination time by comparing results from two different constructs bearing a PP7 RNA stem–loop cassette in either the 5ʹ untranslated region (UTR) or 3ʹ UTR [23]. Likewise, another study measured the elongation rate of a reporter gene in living Drosophila embryos by comparing the results from two different positions of an MS2 stem-loop cassette [24]. After that, Coulon et al. developed a dual-color fluctuation correlation analysis for human β-globin reporter mRNA labeled with a PP7 cassette in the second intron and an MS2 cassette in the 3ʹ UTR [25]. Using two autocorrelation functions and a single cross-correlation function, the authors measured the kinetics of transcription and splicing of single mRNAs. Liu et al. also used a two-color MS2/PP7 reporter to infer the initiation rate, elongation rate and termination time of the hunchback gene in developing fruit fly embryos [26]. However, it would be challenging to insert ∼1.5-kb-long MS2 and PP7 cassettes into two different locations in an endogenous gene, which limits the general application of the technique in mammalian cells and tissues.
In this study, we developed a time-resolved transcriptional analysis method to measure the elongation rate and termination time of an endogenous mRNA labeled with one stem–loop cassette. Previously, two knock-in (KI) mouse models, Actb-MBS [27] and Arc-PBS [28], were generated to label β-actin (Actb) and Arc mRNA, respectively. In the former, 24 repeats of the MS2 binding site (MBS) were inserted in the 3′ UTR of the Actb gene [27] (Figure 1A); in the latter, 24 repeats of the PP7 binding site (PBS) were knocked in the 3′ UTR of the Arc gene [28] (Figure 1B). Using mouse embryonic fibroblasts (MEFs) derived from these two mouse models, we investigated the transcriptional dynamics of the Actb and Arc genes. First, by applying our time-resolved analysis method, we measured the elongation rate and the termination time of each transcription allele. Then we measured the initiation rate and the total dwell time using the autocorrelation analysis method [23] and compared the total dwell time with the time-resolved analysis results. We found a highly heterogeneous distribution of the kinetic parameters in each locus of both Actb and Arc genes. Yet, there was a significant difference between Actb and Arc regarding the average transcriptional kinetic rates. This approach allows quantitative measurement of all three kinetic rates of single-color labeled mRNA transcription in live cells, providing opportunities to study diverse transcriptional regulation at the single-allele level with high spatiotemporal resolution.
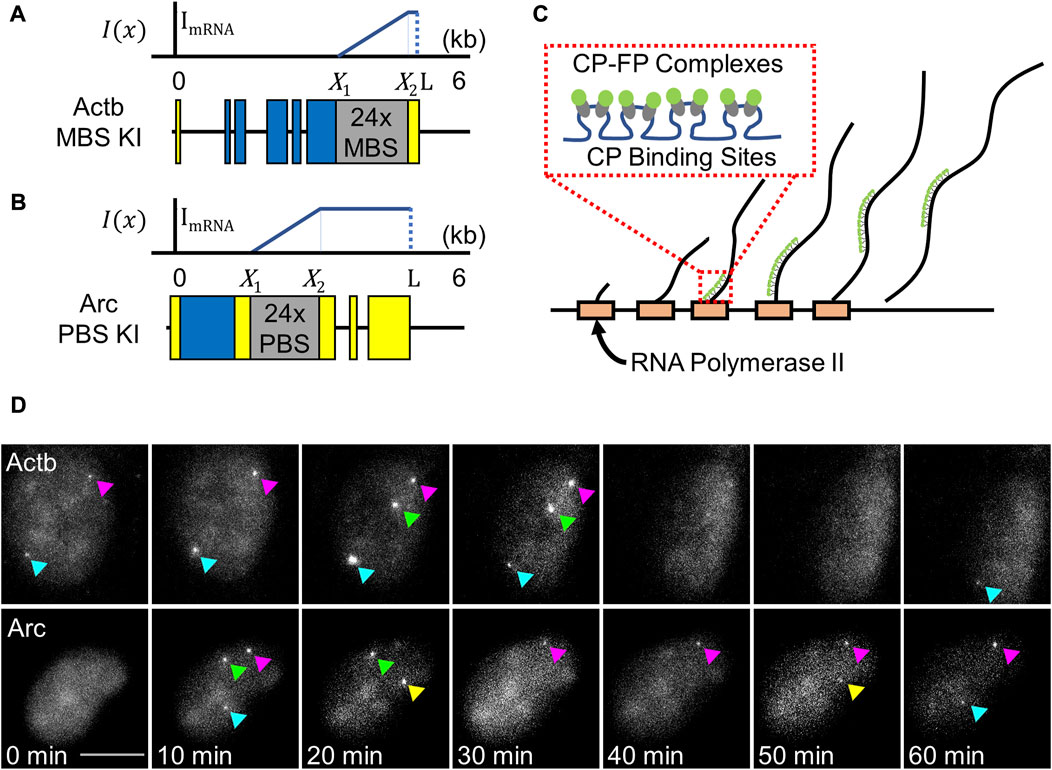
FIGURE 1. Imaging transcription using MS2 and PP7 stem–loop systems. (A,B) Schematic of the Actb-MBS (A) and Arc-PBS (B) knock-in constructs. The fluorescence intensity of a nascent RNA increases as Pol II transcribes the binding sites from
Mathematical models
Time-resolved transcription analysis model
We developed a time-resolved transcription analysis model to determine the transcription elongation rate
We assumed that Pol IIs are distributed uniformly on the gene and move toward the 3ʹ end at a constant speed
The transcription termination time was defined as
If we assume that Pol II and nascent RNAs fall off at the same time from the 3ʹ end of the gene, Eq. 2 also describes the number of nascent RNAs accumulated at the 3ʹ end at time
In the limit that the time interval Δt goes to zero,
This result shows that
Now let us suppose transcription initiation is blocked at time
Based on the previous study of translational dynamics [30], we set the nascent RNA density as a function of the position on the gene and the time after inhibitor addition. Following the formula for the ribosome probability density in the previous study [30], we first modeled the nascent RNA density function R(x, t) using a Heaviside step function:
Because
In Eq. 7, the summation of two Heaviside functions
This density function is depicted in Figure 2A. The first term in Eq. 8 is the nascent RNA density without the termination time effect. In the second term, the amplitude of the Dirac delta function means the number of accumulated nascent RNAs at position
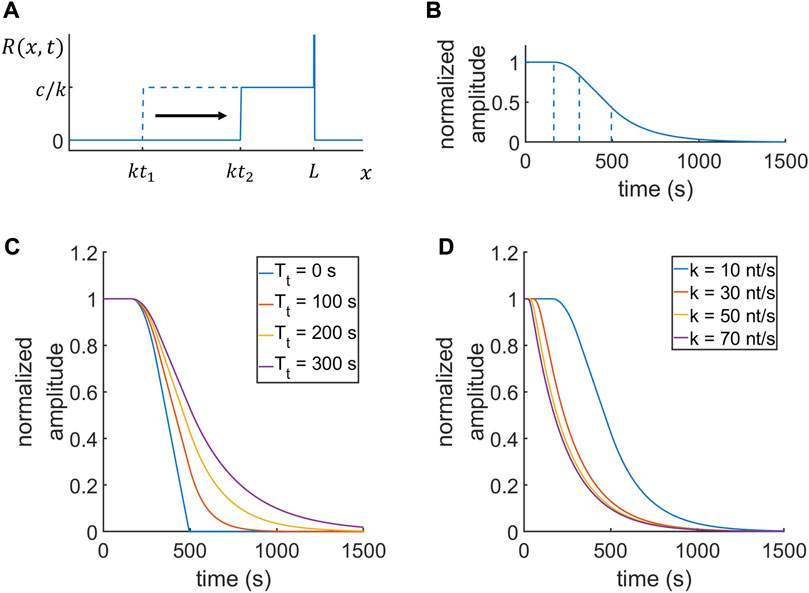
FIGURE 2. Model functional behaviors of the time-resolved transcription analysis. (A) The change in Pol II density distribution from
When Pol II starts to transcribe the stem–loop region
The fluorescence intensity at time
In the Eq. 11, the exponential term in the fourth interval is due to the termination time effect. A normalized fluorescence intensity
This is the model function of time-resolved transcription analysis that can be used for fitting experimental data. With the three fitting parameters,
Autocorrelation analysis model
Larson et al. introduced a mathematical model to analyze transcriptional dynamics using an autocorrelation function of a transcription site intensity trace [23]. We rederived the autocorrelation function in a more concise manner and applied the model to Actb-MBS (Figure 1A) and Arc-PBS (Figure 1B) mRNAs. The autocorrelation function is defined as
where
where
Larson et al. approximated the autocorrelation function in Eq. 14 to consider two special cases in which the position of the stem–loop region was at either the 5ʹ or 3ʹ end of an mRNA. Such approximation cannot be applied for Actb-MBS and Arc-PBS mRNAs; the full autocorrelation function in Eq. 14 needs to be used for a general position of the stem–loop region. The autocorrelation function was calculated based on three assumptions: 1) initiation occurs randomly and evenly; 2) Pol II elongates only in one direction from the 5ʹ end to the 3ʹ end, and there is no reverse translocation; and 3) pre-mRNA is released immediately at the 3ʹ end of the gene.
With the assumption that Pol II can progress only in one direction, the probability density of Pol II dwell time
The time spent for the transition to the next position is exponentially distributed. If
while satisfying constraints given as
The
By integrating with
The last integral term is the
This is the Poisson distribution;
Materials and methods
Cell lines and reagents
Two immortalized cell lines, Actb-MBS KI [32] MEFs and Arc-PBS KI [28] MEFs, were used to image Actb and Arc mRNA, respectively. Lentiviral transduction was used to express MCP-GFP and stdPCP-stdGFP [33] fusion proteins in Actb-MBS and Arc-PBS MEFs, respectively. Cells were seeded in glass-bottom dishes in Dulbecco’s modified Eagle’s medium (DMEM) (11995065, Thermo Fisher Scientific, USA) supplemented with 10% fetal bovine serum (FBS) (10082147, Gibco, US), 1% penicillin/streptomycin (Pen/Strep) (15140122, Gibco, US), and 1% GlutaMAX (35050061, Gibco, USA) and incubated at 37°C and 5% CO2. Prior to imaging, cells were starved for 15–20 h, and the medium was changed to Leibovitz’s L-15 medium without phenol red (21083027 Thermo Fisher Scientific, USA) supplemented with 1% Pen/Strep and 1% GlutaMAX. After placing the cells on a microscope, we stimulated them with a final concentration of 15% FBS. For time-resolved measurement, we blocked transcription initiation by adding 0.5 µM triptolide (T3652, Sigma Aldrich, USA) or 0.3 µM flavopiridol (F3055, Sigma Aldrich, USA) at 10 min after serum stimulation.
Fluorescence microscopy
All images were taken using a wide-field fluorescence microscopy system based on an IX-83 inverted microscope (Olympus) equipped with a UAPON 150×/1.45 NA oil objective (Olympus), iXon Life 888 electron-multiplying charge-coupled device (EMCCD) camera (Andor), SOLA SE u-niR light engine (Lumencor), Chamlide TC top-stage incubator system (Live Cell Instrument), and ET-EGFP filter set (Chroma, ET470/40x, T495lpxr, ET525/50 m). Live-cell imaging was performed at 37°C, and time-lapse z-stack images were taken at an interval of every 8 s over a period of 67 min. Z-stacks were imaged at an interval of 0.5 μm for a total height of 6 μm. The imaging was started right after the inhibitor addition for the time-resolved measurement and serum addition for the auto-correlation analysis (Supplementary Figure S1).
Image analysis
All z-stack images were maximum projected and bleach-corrected via an exponential bleach correction fit using Fiji [34]. Fluorescence intensity time traces of TSs were generated by using HybTrack [35]. The background level was determined by the average intensity of the period in which TS was not automatically detected by HybTrack. For each time trace, transcription ‘ON’ states were distinguished from ‘OFF’ states by two criteria: 1) the TS intensity was higher than 1.5 times the background level, and 2) the durations of both ON and OFF states were equal to or longer than 1 min.
For autocorrelation analysis, we calculated the autocorrelation function of the time traces in the ON-state; time traces longer than the average ON-time were used for analysis. The autocorrelation function was calculated by the multitau algorithm [36]. This algorithm reduces noise in the correlation function at a long lag time. To measure the initiation rate and the total dwell time, we fitted an autocorrelation function of a single ON-time trace with Eq. 14. We used weighted least squares fitting with weights equal to the inverse standard error of the mean. The fitting parameters were the initiation rate
For time-resolved measurements after inhibiting transcription initiation, we analyzed time traces showing a plateau followed by a decreasing signal. In our analysis, we assumed that the gene is fully and evenly occupied by Pol IIs before inhibition of transcription initiation; thus, the fluorescence intensity of TS cannot increase after inhibition. Nonetheless, some data exhibited increasing fluorescence intensity after treatment with triptolide; those time traces were considered not to satisfy the condition of our kinetic model. The selected intensity time traces were fit with the model function with a nonlinear least squares method. The fitting parameters were the elongation rate
Results
Time-resolved transcription analysis
To label Actb and Arc mRNA with green fluorescent proteins (GFPs), we used the MS2- and PP7-GFP systems, respectively. The MS2-GFP system utilizes highly specific binding between the MS2 bacteriophage capsid protein (MCP) and the MBS RNA stem–loop [37]. Constitutive expression of MCP fused with GFP (MCP-GFP) labeled all endogenous β-actin mRNA in mouse embryonic fibroblasts (MEFs) cultured from Actb-MBS KI mice in which 24 repeats of the MBS were inserted in the 3′ UTR of the β-actin gene [27] (Figure 1A). In a similar manner, endogenous Arc mRNA was visualized by expressing PP7 capsid protein (PCP) fused with GFP (PCP-GFP) in MEFs derived from Arc-PBS KI mice bearing 24 repeats of PBS in the Arc gene 3′ UTR [28] (Figure 1B). In Figures 1A,B, the positions of the start and end of the stem–loop cassettes are denoted as
To induce transcription, we starved homozygous Actb-MBS and Arc-PBS MEFs overnight and added serum-containing medium. A few minutes after serum induction, up to four transcription sites appeared in nuclei (Figure 1D). We performed time-resolved experiments by using a small molecule transcription inhibitor, triptolide (Trp) (MW 360.6). It has been shown that triptolide inhibits transcription initiation by preventing transcription bubble formation without significantly affecting the elongation rate [38, 39]. After inhibiting transcription initiation, the region occupied by Pol IIs decreased over time in the direction of elongation (Figure 2A). Then, the normalized intensity of a transcription site declined in 4 steps (Figure 2B). First, the intensity remained constant in
Immediately after adding the initiation inhibitor, we imaged transcription sites in living cells by using fluorescence microscopy. Representative data of the normalized fluorescence intensities of transcription sites in Actb-MBS and Arc-PP7 MEFs are shown in Figures 3A,B, respectively. By fitting the data with Eq. 12, we obtained an average elongation rate of Actb transcription to be 10.4
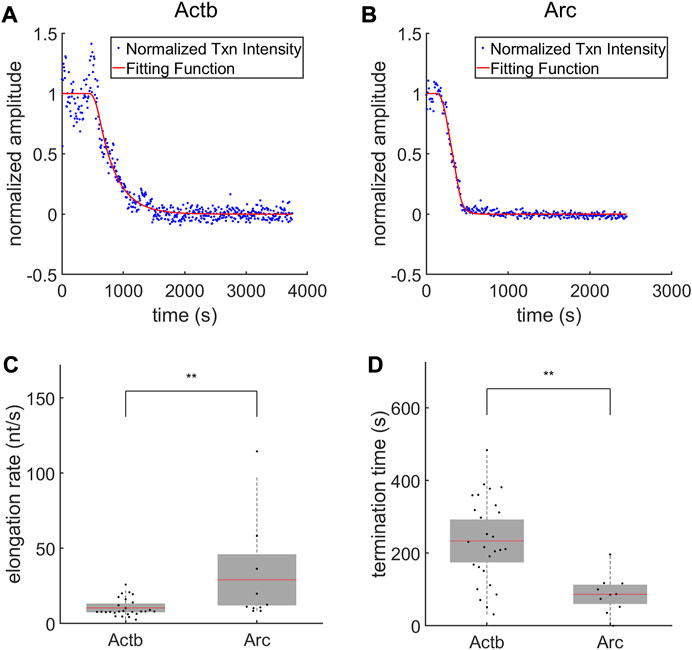
FIGURE 3. Time-resolved analysis of Actb and Arc transcription. (A,B) Representative transcription intensity data (blue dots) and the best fit curves (red lines) of Actb (A) and Arc (B) after the addition of triptolide at
To validate our measurements, we used another transcription inhibitor, flavopiridol (FP) (MW 438.30), which is known to inhibit cyclin-dependent kinase 9 (Cdk9) in the positive transcription elongation factor b (P-TEFb) complex [41]. This P-TEFb inhibitor FP prohibits Pol II release from the promoter proximal pausing to the productive elongation phase, whereas Trp inhibits new Pol II initiation [8]. Although the mechanisms of inhibition by Trp and FP are different, they result in a similar physical state that inhibits transcription initiation. Using FP with the same procedure as in the Trp experiment, we obtained elongation rate and termination time consistent with the Trp results. We measured the elongation rates of Actb and Arc transcription from the FP experiment as 13.3
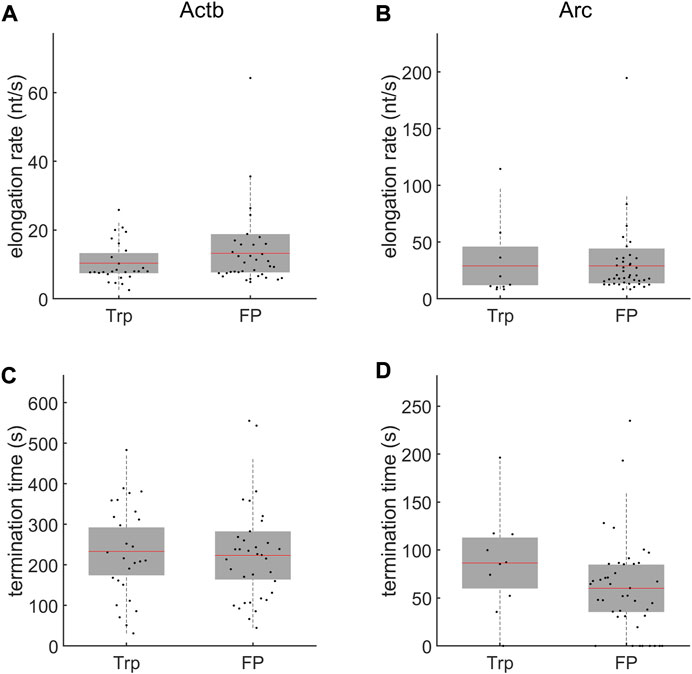
FIGURE 4. Comparison of time-resolved measurements after adding triptolide (Trp) and flavopiridol (FP). (A,B) The elongation rates of Actb (A) and Arc (B). The elongation rates measured after adding Trp and FP were similar for each gene. (C,D) The termination times of Actb (C) and Arc (D). The mean (red line) and standard deviation (SD, gray box) values are indicated. No significant difference was observed between experiments using Trp (n = 27 transcription sites for Actb and 10 for Arc) and FP (n = 35 transcription sites for Actb and 42 for Arc) (
Autocorrelation analysis
Next, we examined whether the time-resolved results are valid by using the autocorrelation analysis described in the section of mathematical models. For the autocorrelation analysis, we recorded the intensity of transcription sites, which showed bursting transcriptional activity without the initiation inhibitors after serum induction (Figures 5A,B). Both the Actb and Arc genes exhibited stochastic switching between active (ON) and inactive (OFF) states after serum induction. The average duration of the ON-state was 15.4 ± 6.6 min (means ± SD) for Actb, which was significantly longer than the 8.6 ± 3.4 min observed for Arc (p < 0.01, t test; Figure 5C). The duration of the OFF state was 6.5 ± 3.4 min for Actb, shorter than the 9.4 ± 4.0 min for Arc (p < 0.01, t test; Figure 5D). These results demonstrate that Actb exhibits transcriptional bursts more frequently in longer time periods than Arc does.
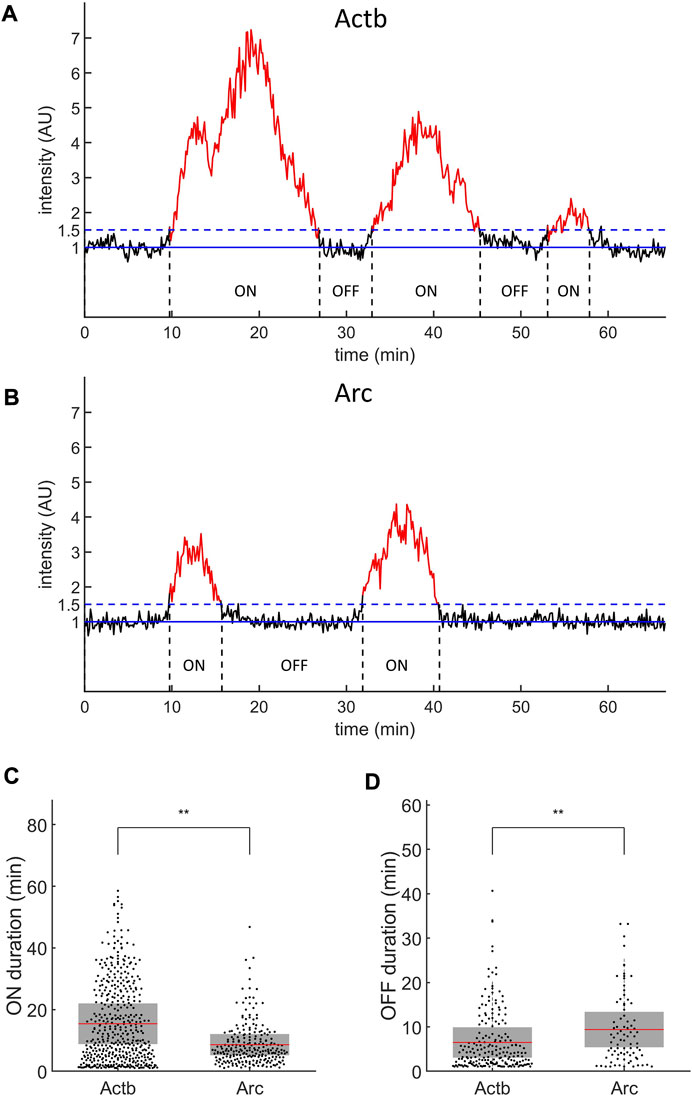
FIGURE 5. Transcription ON and OFF durations of Actb and Arc genes. (A,B) Representative intensity profiles of transcription sites of Actb (A) and Arc (B) genes. The solid blue lines indicate the baseline normalized by the nuclear background. The dashed blue lines indicate the threshold for transcriptional ON (red) and OFF (black) states. AU, arbitrary units. (C,D) ON (C) and OFF (D) durations of Actb (n = 449 for ON and 198 for OFF states) and Arc (n = 234 for ON and 83 for OFF states). The mean (red line) and standard deviation (SD, gray box) values are indicated (*
The initiation rate and total dwell time were measured from the autocorrelation function of transcription intensity traces during ON-times. Because the autocorrelation analysis model was developed for a steady-state condition, we calculated the autocorrelation function from the selected ON-state traces of which durations were longer than the average ON-time of each gene. Then, the selected ON-time duration was 28.9 ± 9.9 min for Actb (183 traces) and 15.5 ± 7.3 min for Arc (82 traces) on average. Before the autocorrelation analysis, we characterized the general behavior of the model function shown in Eq. 14. The autocorrelation amplitude
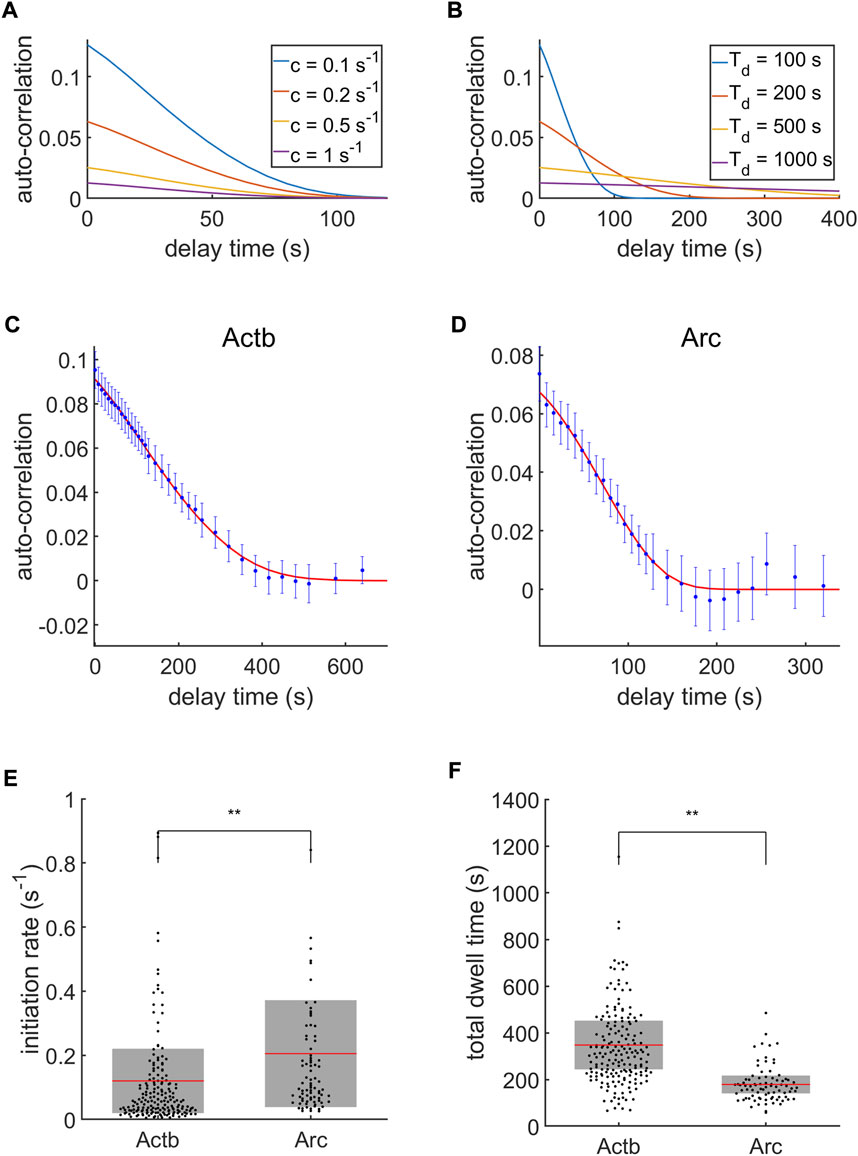
FIGURE 6. Autocorrelation analysis of transcription. (A,B) Autocorrelation model function behaviors with varying initiation rate
Next, we compared the total dwell times from the time-resolved measurements with those from the autocorrelation analysis. Using the results of the time-resolved measurements, the total dwell time can be calculated as.
With this, the total dwell times from the time-resolved measurements were calculated as
Error estimation by simulations
Using simulations, we estimated the errors in the time-resolved measurements for each gene structure of Actb and Arc labeled with the stem-loops. The input parameters of the simulations were initiation rate
The mean time interval is
The elongation process follows the Poisson distribution as shown in Eq. 22. Then, the probability of
In the simulation, the time
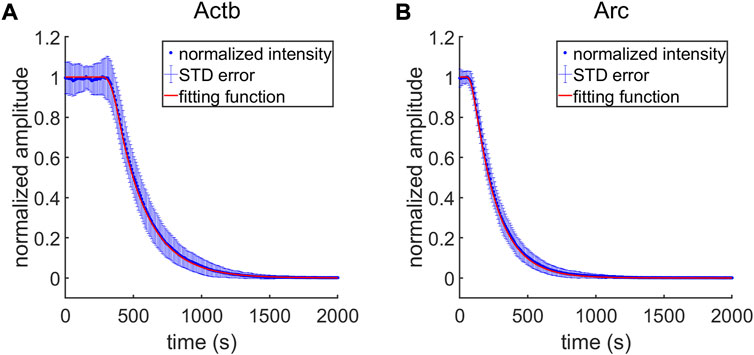
FIGURE 7. Transcription intensities generated by time-resolved computer simulation. (A,B) The averages of normalized transcription intensities are shown as blue dots for each case of Actb (A) and Arc (B) transcription (n = 100 simulations for each gene). The error bar (blue bar) depicts standard deviation of the normalized intensities. The fitting function (red lines) are plotted using the average value of single trace fitting results.
Figure 8 shows the errors in the elongation rate
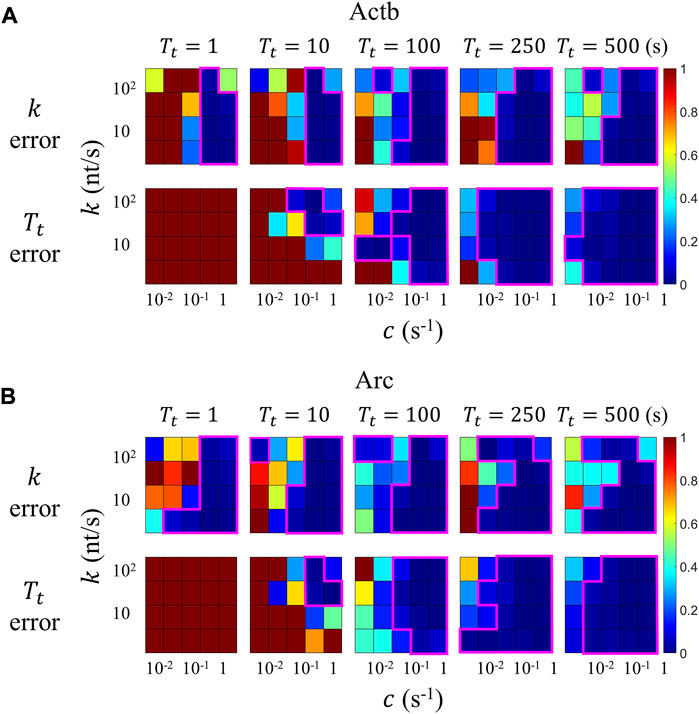
FIGURE 8. Assessment of errors in the time-resolved transcription analysis by using simulations. Simulation input parameters are initiation rate
The areas inside the magenta lines in Figure 8 indicate the regime in which the mean errors are under 10%. The valid region of the time-resolved model is on the lower and right sides of the color map. The time-resolved analysis of our Actb and Arc transcription data yielded the elongation rate
Discussion
In this study, we investigated the transcription kinetics of the Actb and Arc genes by using two analysis methods of live-cell imaging. Because transcription initiation, elongation, and termination dynamic factors cannot be measured separately in the steady state, we used Trp and FP to inhibit transcription initiation and performed time-resolved measurements. For simplicity, we assumed that Pol IIs accumulate at the end of the gene for transcription termination and described it as a Dirac delta function in the Pol II density distribution
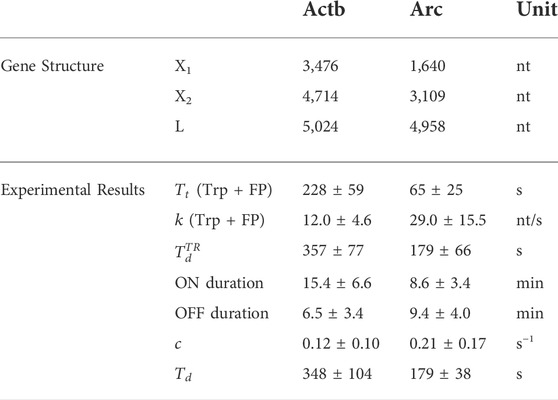
We obtained significantly different elongation rates and termination times for Actb and Arc transcription. The elongation process can include different events such as pausing, traffic jams, backtracking, and so forth [31]. Therefore, the elongation rate obtained in this study represents the overall average elongation rate affected by those complex processes. The Actb and Arc elongation rates were 12.0
Furthermore, the termination time of Actb (228 ± 59 s) was 3.5-fold longer than that of Arc (65 ± 25 s). There are several different types of transcription termination in mammalian cells [4], and the termination of human Actb transcription occurs by Pol II pause-dependent termination type. This Pol II pausing occurs at the G-rich pause sequence downstream of the poly(A) signal (PAS) [43]. In the human Actb gene, nascent transcripts hybridize to the antisense DNA strand and displace the sense DNA strand, forming a structure called an R-loop [44]. The R-loop is formed prevalently over G-rich pause sites behind the elongation complex and induces Pol II pausing. Senataxin, a DNA-RNA helicase, resolves R-loops to allow the 5ʹ-3ʹ exonuclease Xrn2 to degrade the nascent RNA fragment from the poly(A) cleavage site [44]. Similar to human Actb, mouse Actb also has a G-rich region at 450 nucleotides downstream of the PAS; hence, transcription of mouse Actb is also likely to be terminated by the R-loop-dependent pausing mechanism. We determined the termination time, which was defined as the time from reaching the transcription end site (TES) to the release of mRNA, to be approximately 230 s for mouse Actb. This data provides us with information on the timescale of transcription termination by R-loop-dependent pausing. In contrast, the mouse Arc gene does not have a G-rich region downstream of the PAS and exhibits a much shorter transcription termination time of ∼65 s. Therefore, we presume that Arc transcription termination occurs via a different mechanism. The Arc gene has a viral origin and contains sequences that are related to retrotransposon Gag genes [45, 46]. It is also interesting that the transcription termination time of Arc is similar to that of an HIV-1 RNA reporter gene (63.5 s) in U2OS cells [15]. Our new analysis technique to measure termination time can be useful to unravel diverse transcription termination processes.
We note that our time-resolved model has some limitations due to the simple assumption of uniform transcription initiation and elongation rates. In fact, the initiation and elongation processes are more complex, depending on the promoter dynamics [31, 42]. For instance, the inter-polymerase distance distribution is exponential for a Poissonian promoter and is much more complicated for a bursty promoter. Although Actb and Arc genes exhibit ON and OFF transitions as shown in Figure 5, we investigated the transcriptional activity only during the ON states. Because the average duration of the ON states was sufficiently long, on the order of 10 min for both genes, we were able to analyze the transcription dynamics within a single ON state. The average number of Pol IIs on a gene can be estimated as
The transcription initiation rate was not determined by our time-resolved model because we normalized the decreasing intensity by the plateau level
Because of the high GFP background in the nucleus, it was difficult to measure the intensities of single mRNA and transcription sites simultaneously in our live-cell experiments. We expect that background-free RNA imaging techniques such as the MS2-PP7 hybrid stem–loop system combined with split-GFP approaches [47, 48] will allow for measuring both single mRNA and transcription site intensities and extracting all three transcription kinetic rates,
In addition, we expect this analysis method to be used in conjunction with RNA-targeting CRISPR-Cas systems [49–51], through which we could analyze the transcription kinetics of any endogenous RNA without requiring genetic manipulation. Our time-resolved model function was calculated by integrating the product of the Pol II density function and the fluorescence intensity of a nascent RNA. Such model function for a different RNA tagging system can be easily derived following the same steps described herein. This analysis technique will expand our capability to investigate the transcription kinetics of endogenous genes in a highly quantitative manner.
Data availability statement
The results of experimental and simulation data are uploaded at zenodo (https://zenodo.org/record/7089382#.YyYZCnZByUk), and the source codes for analysis and simulation are uploaded at github (https://github.com/Neurobiophysics/SingleCellTxnDyn).
Author contributions
HP designed research; HC developed the mathematical model and performed all experiments, analysis, and simulations; HC and BL developed software; and HC and HP wrote the paper.
Funding
This work was supported by the Creative-Pioneering Researchers Program through Seoul National University, Howard Hughes Medical Institute (HHMI)-Wellcome International Research Scholar Award from the Wellcome Trust (208468/Z/17/Z), and the Basic Science Research Program through the National Research Foundation of Korea (NRF) grant funded by the Korean government (2020R1A2C2007285). For the purpose of open access, the author has applied a CC BY public copyright license to any Author Accepted Manuscript version arising from this submission.
Conflict of interest
The authors declare that the research was conducted in the absence of any commercial or financial relationships that could be construed as a potential conflict of interest.
Publisher’s note
All claims expressed in this article are solely those of the authors and do not necessarily represent those of their affiliated organizations, or those of the publisher, the editors and the reviewers. Any product that may be evaluated in this article, or claim that may be made by its manufacturer, is not guaranteed or endorsed by the publisher.
Supplementary material
The Supplementary Material for this article can be found online at: https://www.frontiersin.org/articles/10.3389/fphy.2022.977125/full#supplementary-material
References
1. Roeder RG. The complexities of eukaryotic transcription initiation: Regulation of preinitiation complex assembly. Trends Biochem Sci (1991) 16(11):402–8. doi:10.1016/0968-0004(91)90164-q
2. Jonkers I, Lis JT. Getting up to speed with transcription elongation by RNA polymerase II. Nat Rev Mol Cel Biol (2015) 16(3):167–77. doi:10.1038/nrm3953
3. Kuehner JN, Pearson EL, Moore C. Unravelling the means to an end: RNA polymerase II transcription termination. Nat Rev Mol Cel Biol (2011) 12(5):283–94. doi:10.1038/nrm3098
4. Proudfoot NJ. Transcriptional termination in mammals: Stopping the RNA polymerase II juggernaut. Science (2016) 352(6291):aad9926. doi:10.1126/science.aad9926
5. Core LJ, Lis JT. Transcription regulation through promoter-proximal pausing of RNA polymerase II. Science (2008) 319(5871):1791–2. doi:10.1126/science.1150843
6. Kwak H, Fuda NJ, Core LJ, Lis JT. Precise maps of RNA polymerase reveal how promoters direct initiation and pausing. Science (2013) 339(6122):950–3. doi:10.1126/science.1229386
7. Churchman LS, Weissman JS. Nascent transcript sequencing visualizes transcription at nucleotide resolution. Nature (2011) 469(7330):368–73. doi:10.1038/nature09652
8. Jonkers I, Kwak H, Lis JT. Genome-wide dynamics of Pol II elongation and its interplay with promoter proximal pausing, chromatin, and exons. elife (2014) 3:e02407. doi:10.7554/elife.02407
9. Danko CG, Hah N, Luo X, Martins A, Core L, Lis J, et al. Signaling pathways differentially affect RNA polymerase II initiation, pausing, and elongation rate in cells. Mol Cel (2013) 50(2):778–222. doi:10.1016/j.molcel.2013.05.025
10. Fuchs G, Voichek Y, Benjamin S, Gilad S, Amit I, Oren M. 4sUDRB-seq: Measuring genomewide transcriptional elongation rates and initiation frequencies within cells. Genome Biol (2014) 15(5):R69–11. doi:10.1186/gb-2014-15-5-r69
11. Veloso A, Kirkconnell KS, Magnuson B, Biewen B, Paulsen MT, Wilson TE, et al. Rate of elongation by RNA polymerase II is associated with specific gene features and epigenetic modifications. Genome Res (2014) 24(6):896–905. doi:10.1101/gr.171405.113
12. Lenstra TL, Rodriguez J, Chen H, Larson DR. Transcription dynamics in living cells. Annu Rev Biophys (2016) 45:25–47. doi:10.1146/annurev-biophys-062215-010838
13. Vera M, Biswas J, Senecal A, Singer RH, Park HY. Single-cell and single-molecule analysis of gene expression regulation. Annu Rev Genet (2016) 50:267–91. doi:10.1146/annurev-genet-120215-034854
14. Kimura H, Sugaya K, Cook PR. The transcription cycle of RNA polymerase II in living cells. J Cel Biol (2002) 159(5):777–82. doi:10.1083/jcb.200206019
15. Boireau S, Maiuri P, Basyuk E, de la Mata M, Knezevich A, Pradet-Balade B, et al. The transcriptional cycle of HIV-1 in real-time and live cells. J Cel Biol (2007) 179(2):291–304. doi:10.1083/jcb.200706018
16. Maiuri P, Knezevich A, De Marco A, Mazza D, Kula A, McNally JG, et al. Fast transcription rates of RNA polymerase II in human cells. EMBO Rep (2011) 12(12):1280–5. doi:10.1038/embor.2011.196
17. Yao J, Ardehali MB, Fecko CJ, Webb WW, Lis JT. Intranuclear distribution and local dynamics of RNA polymerase II during transcription activation. Mol Cel (2007) 28(6):978–90. doi:10.1016/j.molcel.2007.10.017
18. Ben-Ari Ya., Brody Y, Kinor N, Mor A, Tsukamoto T, Spector DL, et al. The life of an mRNA in space and time. J Cel Sci (2010) 123(10):1761–74. doi:10.1242/jcs.062638
19. Darzacq X, Shav-Tal Y, de Turris V, Brody Y, Shenoy SM, Phair RD, et al. In vivo dynamics of RNA polymerase II transcription. Nat Struct Mol Biol (2007) 14(9):796–806. doi:10.1038/nsmb1280
20. Dundr M, Hoffmann-Rohrer U, Hu Q, Grummt I, Rothblum LI, Phair RD, et al. A kinetic framework for a mammalian RNA polymerase in vivo. Science (2002) 298(5598):1623–6. doi:10.1126/science.1076164
21. Yunger S, Rosenfeld L, Garini Y, Shav-Tal Y. Single-allele analysis of transcription kinetics in living mammalian cells. Nat Methods (2010) 7(8):631–3. doi:10.1038/nmeth.1482
22. Mueller F, Mazza D, Stasevich TJ, McNally JG. FRAP and kinetic modeling in the analysis of nuclear protein dynamics: What do we really know? Curr Opin Cel Biol (2010) 22(3):403–11. doi:10.1016/j.ceb.2010.03.002
23. Larson DR, Zenklusen D, Wu B, Chao JA, Singer RH. Real-time observation of transcription initiation and elongation on an endogenous yeast gene. Science (2011) 332(6028):475–8. doi:10.1126/science.1202142
24. Garcia HG, Tikhonov M, Lin A, Gregor T. Quantitative imaging of transcription in living Drosophila embryos links polymerase activity to patterning. Curr Biol (2013) 23(21):2140–5. doi:10.1016/j.cub.2013.08.054
25. Coulon A, Ferguson ML, de Turris V, Palangat M, Chow CC, Larson DR. Kinetic competition during the transcription cycle results in stochastic RNA processing. Elife (2014) 3:e03939. doi:10.7554/elife.03939
26. Liu J, Hansen D, Eck E, Kim YJ, Turner M, Alamos S, et al. Real-time single-cell characterization of the eukaryotic transcription cycle reveals correlations between RNA initiation, elongation, and cleavage. Plos Comput Biol (2021) 17(5):e1008999. doi:10.1371/journal.pcbi.1008999
27. Lionnet T, Czaplinski K, Darzacq X, Shav-Tal Y, Wells AL, Chao JA, et al. A transgenic mouse for in vivo detection of endogenous labeled mRNA. Nat Methods (2011) 8(2):165–70. doi:10.1038/nmeth.1551
28. Das S, Moon HC, Singer RH, Park HY. A transgenic mouse for imaging activity-dependent dynamics of endogenous Arc mRNA in live neurons. Sci Adv (2018) 4(6):eaar3448. doi:10.1126/sciadv.aar3448
29. Tanenbaum ME, Gilbert L, Qi L, Weissman J, Vale R. A protein-tagging system for signal amplification in gene expression and fluorescence imaging. Cell (2014) 159(3):635–46. doi:10.1016/j.cell.2014.09.039
30. Yan X, Hoek T, Vale R, Tanenbaum M. Dynamics of translation of single mRNA molecules in vivo. Cell (2016) 165(4):976–89. doi:10.1016/j.cell.2016.04.034
31. Dobrzynski M, Bruggeman FJ. Elongation dynamics shape bursty transcription and translation. Proc Natl Acad Sci U S A (2009) 106(8):2583–8. doi:10.1073/pnas.0803507106
32. Park HY, Lim H, Yoon YJ, Follenzi A, Nwokafor C, Lopez-Jones M, et al. Visualization of dynamics of single endogenous mRNA labeled in live mouse. Science (2014) 343(6169):422–4. doi:10.1126/science.1239200
33. Wu B, Miskolci V, Sato H, Tutucci E, Kenworthy CA, Donnelly SK, et al. Synonymous modification results in high-fidelity gene expression of repetitive protein and nucleotide sequences. Genes Dev (2015) 29(8):876–86. doi:10.1101/gad.259358.115
34. Schindelin J, Arganda-Carreras I, Frise E, Kaynig V, Longair M, Pietzsch T, et al. Fiji: An open-source platform for biological-image analysis. Nat Methods (2012) 9(7):676–82. doi:10.1038/nmeth.2019
35. Lee BH, Park HY. HybTrack: A hybrid single particle tracking software using manual and automatic detection of dim signals. Sci Rep (2018) 8(1):212–7. doi:10.1038/s41598-017-18569-3
36. Wohland T, Rigler R, Vogel H. The standard deviation in fluorescence correlation spectroscopy. Biophysical J (2001) 80(6):2987–99. doi:10.1016/s0006-3495(01)76264-9
37. Bertrand E, Chartrand P, Schaefer M, Shenoy SM, Singer RH, Long RM. Localization of ASH1 mRNA particles in living yeast. Mol Cel (1998) 2(4):437–45. doi:10.1016/s1097-2765(00)80143-4
38. Vispé S, DeVries L, Creancier L, Besse J, Breand S, Hobson DJ, et al. Triptolide is an inhibitor of RNA polymerase I and II–dependent transcription leading predominantly to down-regulation of short-lived mRNA. Mol Cancer Ther (2009) 8(10):2780–90. doi:10.1158/1535-7163.mct-09-0549
39. Bensaude O. Inhibiting eukaryotic transcription. Which compound to choose? How to evaluate its activity? Which compound to choose? How to evaluate its activity? Transcription (2011) 2(3):103–8. doi:10.4161/trns.2.3.16172
40. Femino AM, Fay FS, Fogarty K, Singer RH. Visualization of single RNA transcripts in situ. Science (1998) 280(5363):585–90. doi:10.1126/science.280.5363.585
41. Chao S-H, Price DH. Flavopiridol inactivates P-TEFb and blocks most RNA polymerase II transcription in vivo. J Biol Chem (2001) 276(34):31793–9. doi:10.1074/jbc.m102306200
42. Ali MZ, Choubey S. Decoding the grammar of transcriptional regulation from RNA polymerase measurements: Models and their applications. Phys Biol (2019) 16(6):061001. doi:10.1088/1478-3975/ab45bf
43. Gromak N, West S, Proudfoot NJ. Pause sites promote transcriptional termination of mammalian RNA polymerase II. Mol Cel Biol (2006) 26(10):3986–96. doi:10.1128/mcb.26.10.3986-3996.2006
44. Skourti-Stathaki K, Proudfoot NJ, Gromak N. Human senataxin resolves RNA/DNA hybrids formed at transcriptional pause sites to promote Xrn2-dependent termination. Mol Cel (2011) 42(6):794–805. doi:10.1016/j.molcel.2011.04.026
45. Ashley J, Cordy B, Lucia D, Fradkin LG, Budnik V, Thomson T. Retrovirus-like Gag protein Arc1 binds RNA and traffics across synaptic boutons. Cell (2018) 172(1-2):262–74 e11. doi:10.1016/j.cell.2017.12.022
46. Pastuzyn ED, Day CE, Kearns RB, Kyrke-Smith M, Taibi AV, McCormick J, et al. The neuronal gene arc encodes a repurposed retrotransposon Gag protein that mediates intercellular RNA transfer. Cell (2018) 172(1-2):275–88 e18. doi:10.1016/j.cell.2017.12.024
47. Wu B, Chen J, Singer RH. Background free imaging of single mRNAs in live cells using split fluorescent proteins. Sci Rep (2014) 4:3615. doi:10.1038/srep03615
48. Park SY, Moon HC, Park HY. Live-cell imaging of single mRNA dynamics using split superfolder green fluorescent proteins with minimal background. RNA (2020) 26(1):101–9. doi:10.1261/rna.067835.118
49. Nelles DA, Fang M, O’Connell M, Xu J, Markmiller S, Doudna J, et al. Programmable RNA tracking in live cells with CRISPR/Cas9. Cell (2016) 165(2):488–96. doi:10.1016/j.cell.2016.02.054
50. Yang L-Z, Wang Y, Li SQ, Yao RW, Luan PF, Wu H, et al. Dynamic imaging of RNA in living cells by CRISPR-Cas13 systems. Mol Cel (2019) 76(6):981–97.e7. e7. doi:10.1016/j.molcel.2019.10.024
Keywords: transcription, live-cell imaging, single-cell analysis, transcription elongation, transcription termination
Citation: Choi H, Lee BH and Park HY (2022) Time-resolved analysis of transcription kinetics in single live mammalian cells. Front. Phys. 10:977125. doi: 10.3389/fphy.2022.977125
Received: 24 June 2022; Accepted: 12 October 2022;
Published: 01 November 2022.
Edited by:
Simonetta Filippi, Campus Bio-Medico University, ItalyReviewed by:
Jong-Bong Lee, Pohang University of Science and Technology, South KoreaSandeep Choubey, Institute of Mathematical Sciences, Chennai, India
Copyright © 2022 Choi, Lee and Park. This is an open-access article distributed under the terms of the Creative Commons Attribution License (CC BY). The use, distribution or reproduction in other forums is permitted, provided the original author(s) and the copyright owner(s) are credited and that the original publication in this journal is cited, in accordance with accepted academic practice. No use, distribution or reproduction is permitted which does not comply with these terms.
*Correspondence: Hye Yoon Park, aHlwQHVtbi5lZHU=
 Hongyoung Choi
 Byung Hun Lee
 Hye Yoon Park