- 1Aerospace Information Research Institute, Chinese Academy of Sciences, Beijing, China
- 2School of Optics and Photonics, Beijing Institute of Technology, Beijing, China
- 3Key Laboratory of Information Photonics Technology, Ministry of Industry and Information Technology of the People’s Republic of China, Beijing, China
- 4Key Laboratory of Photoelectronic Imaging Technology and System, Ministry of Education of the People’s Republic of China, Beijing, China
Free space optical communication (FSOC) is a promising technology for satellite-to-earth communication systems, where vector beams, especially orbital angular momentum (OAM), can further increase the capacity of the optical link. However, atmospheric turbulence along the path can introduce intensity scintillation, wavefront aberrations and severe distortion of spatial patterns, leading to data degradation. Forecasting atmospheric turbulence allows for advanced scheduling of satellite-to-earth data transmission links, as well as the use of adaptive optics (AO) to compensate for turbulence effects and avoid data transmission link performance degradation. Therefore, atmospheric turbulence forecasting is critical for practical applications. In this work, we proposed a hybrid atmospheric turbulence forecasting model based on a two-stage variational mode decomposition (TsVMD) and autoregression model. The variational mode decomposition (VMD) algorithm is first used, to our best knowledge, to denoise the observed atmospheric turbulence dataset, and then is used again to decompose the datasets into several intrinsic mode functions (IMFs). Finally, the autoregression model is used to predict each IMF independently. And the predictions of each IMF are combined to obtain the final atmospheric turbulence predictions. Experiments employing the observed turbulence datasets and two additional methodologies were carried out to verify the performance of the proposed model. The experimental results show that the performance of the proposed model is much superior to that of the comparative methods.
1 Introduction
Free-space optical communication (FSOC) offers flexibility, security, and large-signal bandwidth as compared to traditional microwave communication [1–3]. It has attracted considerable attention due to the increasing demands for high capacity and speed in satellite-to-earth data transmission links [4–8]. Recently, there has been a great amount of research in using spatially structured light for FSOC. Among them, the orbital angular momentum (OAM) modes of light have been used most frequently and effectively to increase the information capacity of optical links [9–12]. However, atmospheric turbulence, mainly generated by vertical wind speed gradients and thermal convection, can significantly limits the practical range of satellite-to-earth optical communication. The non-uniformity of the medium refractive index will cause beam intensity scintillation, resulting in power fluctuations in the optical links as well as time-varying wavefront aberrations and spatial mode distortion, all of which can lead to severe performance degradation of the systems [13–17]. Adaptive optics (AO) is a promising way to compensate for wavefront aberrations caused by atmospheric turbulence. However, AO cannot compensate for all the turbulence effects under all possible conditions [18]. In weak turbulence condition, AO can significantly improve the performance of FSOC, yet it still has limited ability in strong turbulence. Consequently, satellite-to-earth optical communication can only be arranged in mild and weak turbulence conditions to ensure the quality of communication [19–21]. Therefore, forecasting atmospheric turbulence to scheduling the satellite-to-earth communication is crucial and mandatory.
In the field of FSOC, the most relevant and common parameter for the analytical description of the atmospheric turbulence intensity characteristics is the Fried coherence length (
Amounts of studies have been done in atmospheric turbulence forecasting, the most dominant approach is to forecast atmospheric turbulence using mesoscale meteorological parameters. Using various mesoscale numerical models such as Meso-NH, the fifth-generation Penn State/NCAR Mesoscale Model (MM5), the European Center for Medium-Range Weather Forecasts (ECMWF), the Weather Research and Forecasting (WRF) to forecast the spatial distribution of meteorological parameters, and then reconstructing the spatial distribution of atmospheric turbulence base on the relationship between meteorological parameters and atmospheric turbulence parameters. This approach has been applied and validated at many observatories and the results show that the method can play a non-negligible positive role for applications on long-time scales and large-spatial scales, such as astronomical observations [22–34]. However, this approach is not adaptable to satellite-to-earth optical communication, which requires high accuracy and high temporal resolution atmospheric turbulence forecasting.
Atmospheric turbulence is forecasted by meteorological parameters such as temperature, humidity, and wind speed, which means that the accuracy of the forecast results is limited by the accuracy of the meteorological forecast parameters. But in fact, the spatial and temporal scales of atmospheric turbulence are much smaller than the highest resolution typically achieved by mesoscale meteorological forecasts [22]. Lots of studies demonstrated that meteorological parameters forecast is sensitivity to the orography, the horizontal and vertical resolution of mesoscale numerical model which is far more enough to resolve thin atmospheric turbulence layers of tens of meters [35–37]. In several cases, the accuracy of using WRF model to forecast atmospheric turbulence for the next hour is not even as good as the accuracy of using the current value directly [22, 38]. In addition, it is difficult to accurately describe the relationship between meteorological parameters and atmospheric turbulence in either empirical or physical models [39]. Empirical models were developed for a specific condition and location [40], their applicability is questionable, for example, the Submarine Laser Communications (SLC) models which based on the observational data from Mt. Haleakala, Hawaii can hardly achieve satisfactory result elsewhere. Physical models [41] were generally based on some assumption that may cause a reduction in model accuracy or even failure under particular conditions. Recently, some advanced artificial intelligence techniques were used to establish the forecasting models and have demonstrated its prowess by capturing the temporal evolution of atmospheric turbulence remarkably well [42–44], but its forecast accuracy is still limited by its dependence on meteorological forecast data.
Since atmospheric turbulence has a certain short-term correlation, using this property can greatly improve the short-term atmospheric turbulence forecast accuracy and temporal resolution [45, 46]. Several researchers proposed using real-time measurements and filtering techniques to improve the forecast performances on shorter time scales [47, 48]. Despite the unprecedented prediction accuracy achieved, there is still much room for development. The instruments measure atmospheric turbulence by analyzing the amplitude and phase perturbations of a light-wave, which inevitably introduces measurement noise [49]. Therefore, the real-time measurement should be preprocessed to remove noise. The nonlinear and nonstationary features of atmospheric turbulence were not taken into consideration. Hence, the forecast accuracy is limited, especially at sudden changes.
In this study, a new hybrid method, two-stage variational mode decomposition and autoregression model (TsVMD-AR) is proposed, which is based on a two-stage variational model decomposition and an autoregressive model that can overcome these limitations for short-term atmospheric turbulence forecasting. We use variational mode decomposition (VMD) [50] to decompose the observed atmospheric turbulence time-series datasets (Fried parameter
2 Methods
2.1 The whole process of the proposed model
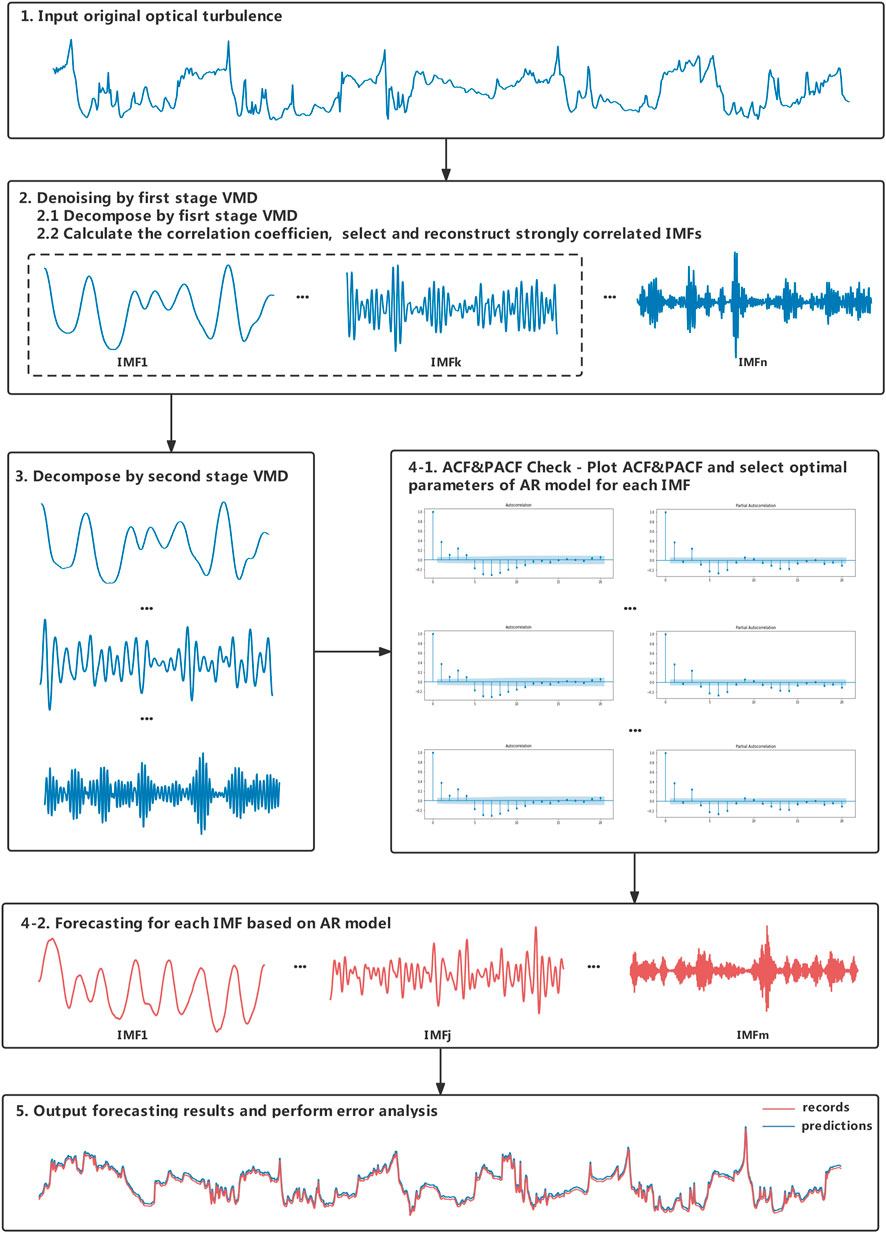
The schematic diagram of TsVMD-AR is depicted in Figure 1. In this model, the two-stage variational mode decomposition was used to denoising and decomposing the observed atmospheric turbulence dataset, and autoregression model was applied to forecast each IMF and obtain the ensemble forecast results. The detailed descriptions are given as follow:
2.1.1 Denoising the observed atmospheric turbulence dataset
The first stage of VMD is used to remove noise from the observed atmospheric turbulence dataset. As mentioned earlier, the observed atmospheric turbulence dataset contains noise, which will seriously reduce the performance of forecast model. So, it is essential to remove the noise before the atmospheric turbulence forecasting. Hence, we propose a joint VMD and correlation analysis (CA) denoising algorithm.
First, decomposing the observed atmospheric turbulence dataset using VMD algorithm. Decomposition models such as Empirical Mode Decomposition (EMD) and Local mean decomposition (LMD) have some inherent limitations such as sensitivity to noise and sampling, and mode aliasing etc. So, we use VMD to decomposes the observed atmospheric turbulence dataset into a sequence of IMFs having both informative and noisy components.
Secondly, classifying the IMFs using CA. Atmosphere turbulence is a multiplicative noise that appears as the sum of a useful signal and multiple frequency noise signals in the frequency domain. Regarding the high frequency components decomposed by VMD as noisy mode and discard them directly is the common practice. Although this method has acceptable noise reduction effect, it often loses useful signals. To minimize the signal loss, we introduce correlation analysis to calculate the correlation coefficient between each IMF and the observed atmospheric turbulence dataset, classify and remove the weak correlation components [51].
2.1.2 Decomposing the denoised dataset
The second stage VMD was used to decompose the denoised atmospheric turbulence dataset. By the first stage VMD, the observed atmospheric turbulence dataset is decomposed and the relevant IMFs are selected and reconstructed. Although the noise in the observed atmospheric turbulence dataset is removed, there is still one problem that remains: the denoised atmospheric turbulence dataset is nonlinear and nonstationary. However, the traditional AR model is based on the assumption that the datasets being used to make predictions are stationary and linear. Therefore, we again use variational mode decomposition to decompose the denoised atmospheric turbulence dataset into several components that can be individually forecasted.
2.1.3 Forecast the atmospheric turbulence
The final step is training AR model for each IMF and use it to forecast the atmospheric turbulence. Since each IMF has different correlation properties, it is necessary to select the appropriate AR order for each IMF independently and train them separately. The qualitative procedures to choose the best order are the Bayesian information criterion (BIC) studied by Schwartz [52] and the Akaike information criterion (AIC) of Akaike.
First, plot the autocorrelation coefficient figure and partial autocorrelation coefficient figure of each IMF to select the order of the autoregression model, use BIC and AIC to select the optimal parameters. Secondly, divide each of the IMF into two sub-sets: the training set for training the AR model and the test set for evaluate the mode. Finally, each predicted IMF is summed to obtain the final forecast result.
In details, the complete procedure of the proposed TsVMD-AR framework is conducted as follows:
Step 1. Collect observed atmospheric turbulence data
Step 2. Use VMD to denoising the observed atmospheric turbulence data:
Step 2-1. Use VMD to decompose the observed atmospheric turbulence data
Step 2-2. Calculate the correlation coefficient between each component and the observed atmospheric turbulence data, removing weakly correlated components and reconstructing strongly correlated IMFs.
Step 3. Used VMD to decompose the denoised data into several components
Step 4. Forecast for each component using AR model
Step 4-1. Plot the autocorrelation coefficient figure (ACF) and the partial autocorrelation coefficient figure (PACF) of each component obtained in step 3 to select optimal values of parameters p, d, and q in the AR model.
Step 4-2. Divide each of the components into two sub-sets: the train set for training AR model and test set for validating the model. Given the test set, predict each component based on the AR model of each mode obtained in step 3
Step 5. Output the final forecasting result by add up each forecasting result, and perform error analysis.
2.2 Variational mode decomposition
VMD algorithm is fully adaptive algorithm that decompose an original time series into an ensemble of band-limited IMFs [50]. The constrained variational formulation can be constructed as follow
where
The above constrained problem can be transformed into following unconstrained one by quadratic penalty function
The solution of Eq. 1 is obtained by found the saddle point of augmented Lagrange in a sequence of iterative sub-optimizations call alternate direction method of multipliers (ADMM) [53]. The
In the iterative process, the center frequency and bandwidth of IMFs are continuously updated until the following stop condition is satisfied:
2.3 Correlation analysis
The correlation coefficient [54] can be expressed as follows:
where
2.4 Autoregression model
Autoregression mode is very flexible at handling time-series patterns which use uses a linear combination of past values of the target to make forecasts [55]. The value of atmospheric turbulence at time
where
In order to determine the orders of the autoregression mode, ACF and PACF are used. For a finite atmospheric turbulence dataset with
where
The PACF can be attained as:
3 Case study
3.1 Study area and data description
In this study, the proposed approach is applied to the China Remote Sensing Satellite Ground Station (RSGS,
3.2 Performance evaluation criteria
Two types of criteria were adopted in this paper to evaluate the forecasting performance of the proposed model. The accuracy of the forecast is assessed using mean absolute error (MAE), mean absolute percentage error (MAPE), and root mean square error (RMSE). The specific computational formulas are defined as follows:
For tendencies forecasting accuracy, a dimensionless indicator (IA) is used for comparisons between different models. IA is defined as follows:
For a “perfect” model, the MAE, MAPE and RMSE are equivalent to 0, the IA is equivalent to 1.
3.3 Model process
In the proposed TsVMD-AR method, the observed sequences are denoised using the first stage of VMD. To achieve better noise removal, the number of decompositions needs to be well predetermined. Lower frequency signals contain more features that contribute to the prediction results, and as the number of decompositions increases, so does the high frequency part of the signal components and the noise becomes more pronounced and less predictive. Based on our experiments, we found that the optimal number of decompositions for the first stage of VMD is 12, as the correlation between the observed time series and the decomposed components rapidly weaken after this point. Figure 2B shows the results of the first stage VMD, Figure 2A and Table 1 show the correlation coefficients between the observed time series and the decomposed components. The denoising of observed datasets can be completed by removing weakly correlated IMFs and reconstructing strongly correlated IMFs. Based on our experiments, we removed the weakly correlated components with correlation coefficients less than 0.2.
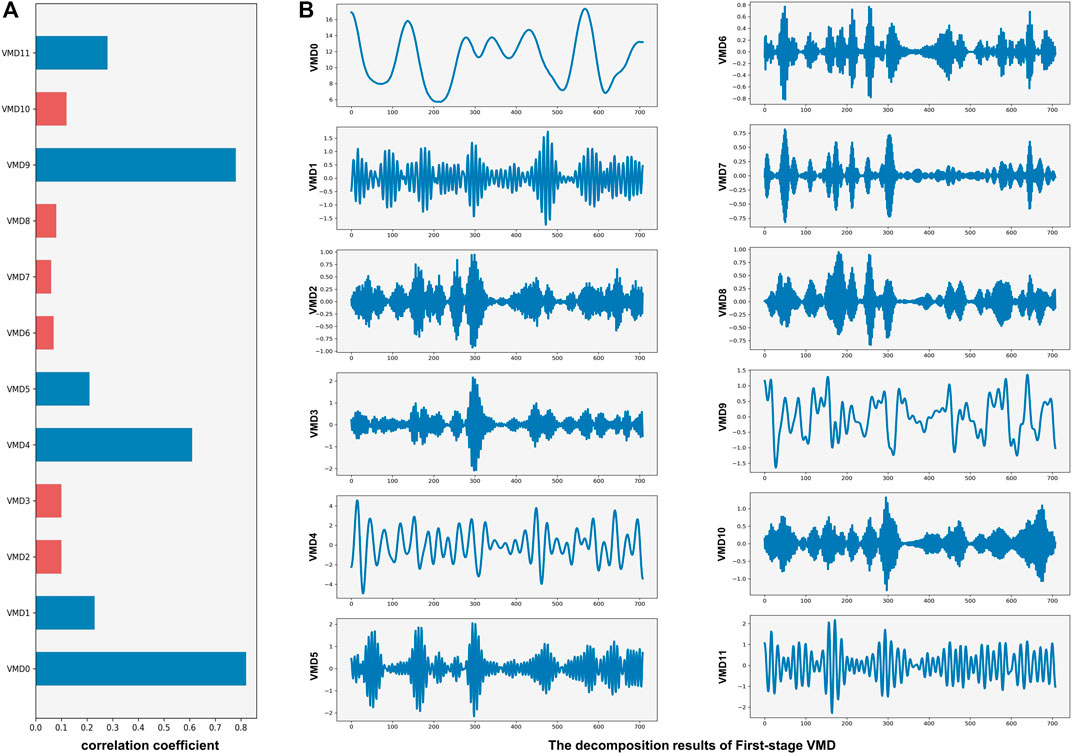
FIGURE 2. First-stage VMD results and correlation coefficients of period 1. The correlation coefficients between the observed time series and the decomposed Components (A), the results of the first stage VMD (B).

TABLE 1. The correlation coefficient between the observed time series and the decomposed components.
The second stage VMD decomposes the denoised atmospheric turbulence datasets into IMFs to decrease the non-stationary and non-linear characteristics, hence making them easy to forecast. It is also hard to tell how many components the datasets should be decomposed into. Too few components may not correctly extract features within the dataset, while too many components may over-decompose, leading to reduced accuracy and unnecessary computational overhead. Empirically, the suitable number of components is taken as 4.
After the decomposition of atmospheric turbulence datasets, autoregression model is applied to each IMF. In this work, AR is employed for the prediction of each component and the order of model is determined via the plots of ACF and the PACF.
4 Results and analysis
The forecasting results of the proposed approach and contrast methods, including WRF and seasonal autoregressive integrated moving average (SARIMA), are analyzed to evaluate the TsVMD-AR model’s forecasting performance. In this study, WRF Version 3.7 is used to obtain the atmospheric turbulence forecasting results for RSGS. The optimal values of parameters p, d, and q in the SARIMA model are determined using Akaike’s Information Criteria (AIC). Python 3.9 is used to analyze and plot the experimental results.
The forecasting results of the proposed method and the contrast methods for the period 1 (20 December 2021–5 January 2022) are shown in Figure 3A. Clearly, the forecasting results of the proposed method are more consistent with the observed value’s trend, and its forecasting accuracy is significantly higher, especially for abrupt changes. The 2D histograms of the scatter plot for observed and predicted values is shown in Figures 3B1–B3. As can be seen, the proposed method can obtain the most homogeneous and closest regression line distribution. In summary, the proposed method best fits the observed value and also has the best forecasting effect.
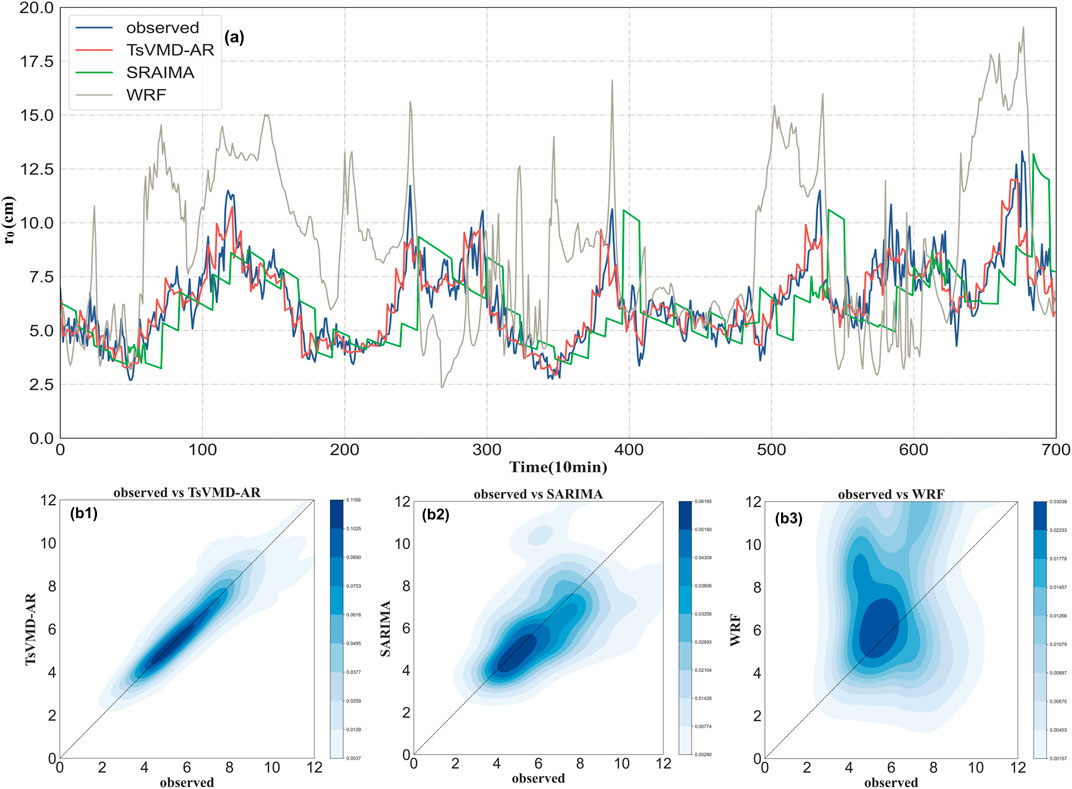
FIGURE 3. Forecasting results of the proposed method and the contrast method for period 1: (A) observed atmospheric turbulence (blue) and forecasting results of TsVMD-AR (red), SARIMA (green) and WRF (grey); 2D histograms of observed atmospheric turbulence verse forecasting results of TsVMD-AR (B1), SARIMA (B2) and WRF (B3).
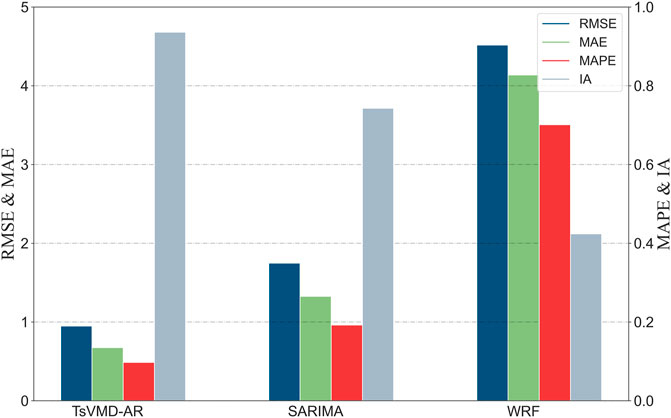
Figure 4 illustrate the comparison of the evaluation criteria for different forecasting models. Considering Figure 4 and Table 2 together, the proposed method significantly outperforms all other forecasting models, both in terms of the level prediction indices (MAE, MAPE, and RMSE) and the directional forecasting indicator (IA).
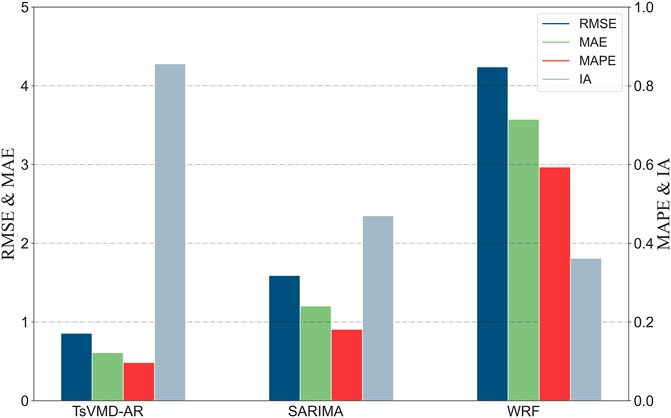
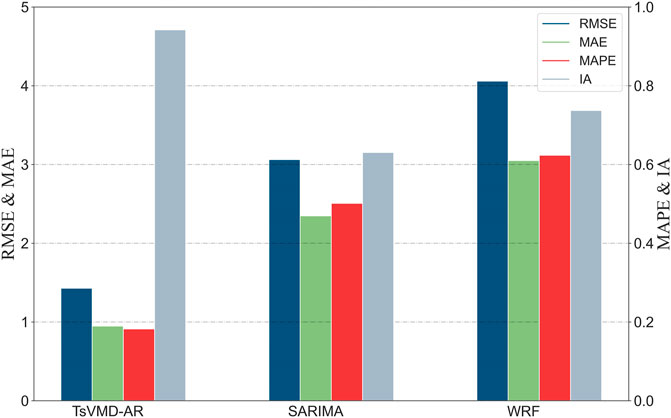
To further investigate the performance of the proposed method in different periods, the same experimental analysis has been performed in Period 2 and Period 3. The forecasting results of Period 2 and 3 are given in Figures 5–8. The same conclusion as Period 1 can be obtained. The performance of the proposed method is further verified.
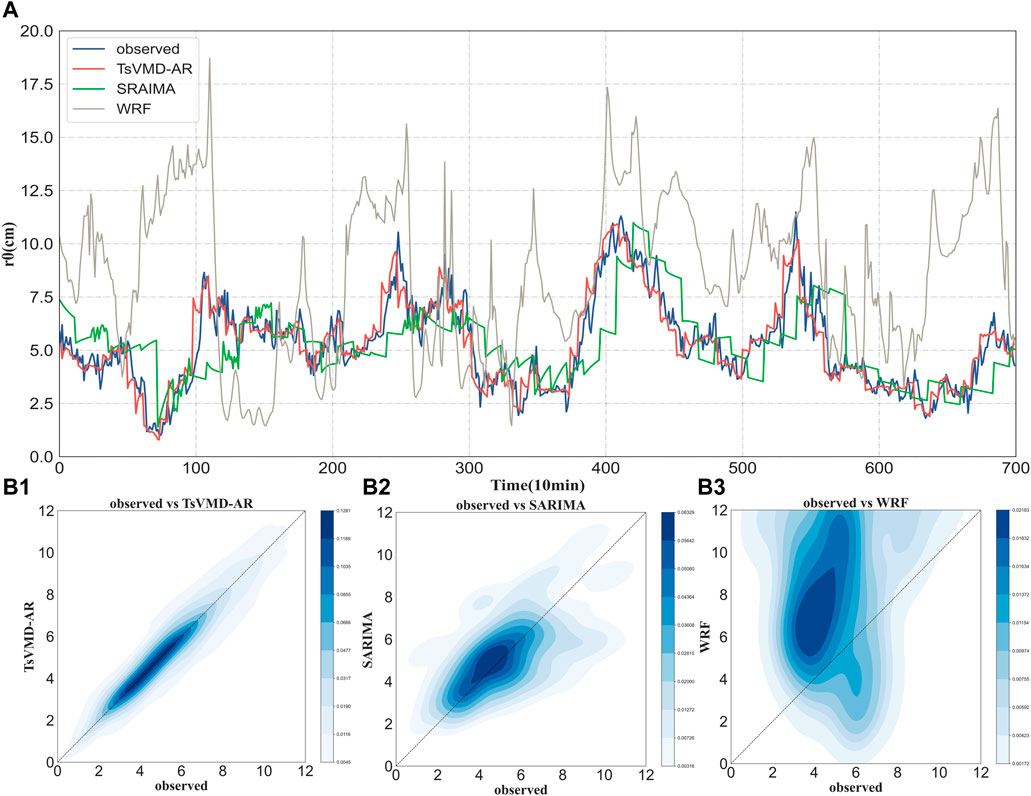
FIGURE 5. Forecasting results of the proposed method and the contrast method for period 2: (A) observed atmospheric turbulence (blue) and forecasting results of TsVMD-AR (red), SARIMA (green) and WRF (grey); 2D histograms of observed atmospheric turbulence verse forecasting results of TsVMD-AR (B1), SARIMA (B2) and WRF (B3).
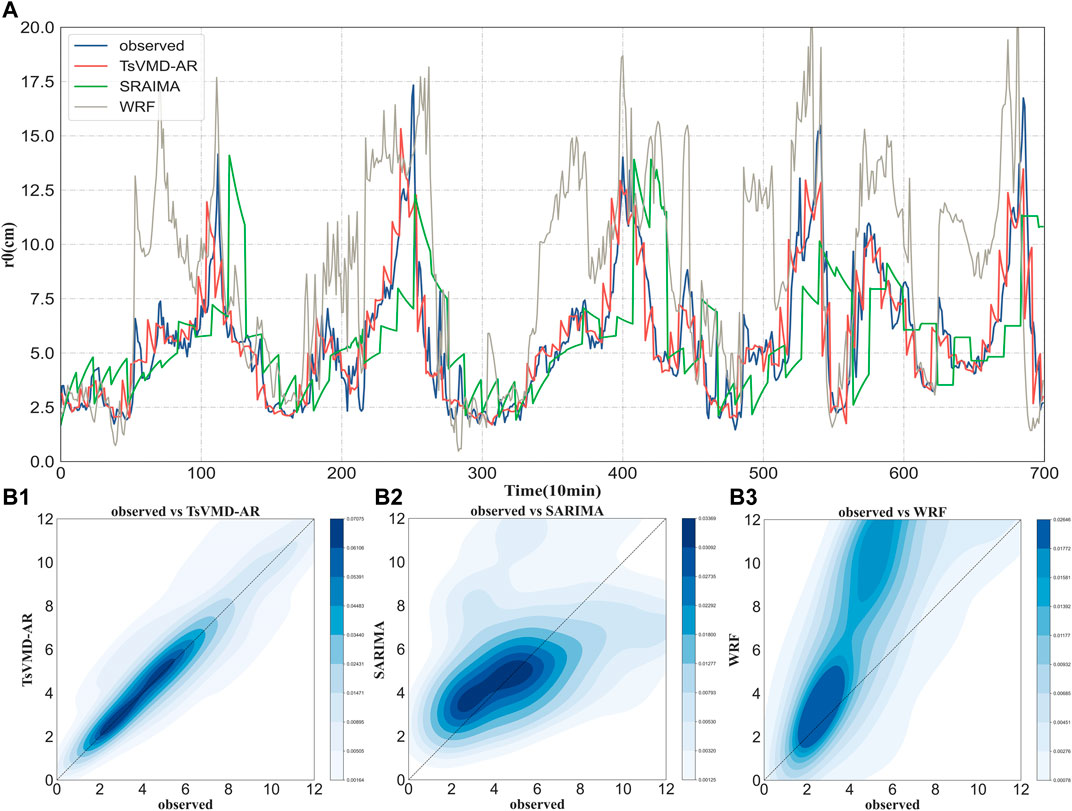
FIGURE 7. Forecasting results of the proposed method and the contrast method for period 3: (A) observed atmospheric turbulence (blue) and forecasting results of TsVMD-AR (red), SARIMA (green), and WRF (grey); 2D histograms of observed atmospheric turbulence verse forecasting results of TsVMD-AR (B1), SARIMA (B2), and WRF (B3).
Furthermore, by comparing WFR with SARIMA and TsVMD-AR, it is shown that autoregression models are superior to physical models. As shown in Table 2, the RMSE, MAPE, and MAE of the proposed method and SARIMA model are reduced by 74.5%, 80.2%, 78.5%, and 49.4%, 53.9%, 52.4% compared with the WRF model. The IA values of TsVMD-AR, SARIMA, and WRF are relatively close at 0.91, 0.61, and 0.50, respectively. The main reason is that the physical model cannot sufficiently take into account the influence of terrain and features. Thus, it can only get good trend results but has a large gap in forecasting accuracy when compared to autoregressive models.
In particular, TsVMD-AR has certain advantages over SARIMA. The RMSE, MAPE, and MAE of the proposed method is reduced by 48.4%, 53.2%, and 52.7%, respectively, when compared to the SARIMA model. It may be attributed to the following factors:
(1) Because the observed datasets contain various types of noise, the observed values do not accurately reflect the true atmospheric turbulence characteristics of the atmosphere and are therefore difficult to predict. The decomposition-based denoising process can effectively compensate for the effect of data noise.
(2) Due to the violent fluctuations and dramatic variations of the atmospheric turbulence, it is difficult to extract and evaluate the variation patterns directly by autoregressive models, and therefore it is impossible to obtain satisfactory forecasting results. After VMD decomposition on the dataset, the decomposed IMFs is more stable and relatively more regular. The interference and coupling between multi-scale feature information in the dataset is reduced. This makes the complex internal features of the dataset, including linear and nonlinear features, easier to obtain and reduces the difficulty of the forecasting model. As a result, the prediction performance of the decomposition-ensemble based autoregressive method is significantly improved.
(3) The proposed method extract the low to high frequency information in the dataset by VMD, which can better capture and forecast the sudden changes in atmospheric turbulence. Therefore, the proposed method has better prediction accuracy at peaks and valleys compared to the SARIMA model.
5 Conclusion
Atmospheric turbulence can significantly degrade the performance of optical communication systems. Therefore, atmospheric turbulence prediction is crucial for FSOC. To improve the accuracy and stability of the prediction, a decomposition-set learning method called TsVMD-AR is proposed in this paper. In this model, VMD and CA techniques are firstly used to decompose the original datasets, identify and remove the noise IMFs. Next, VMD is used again to extract low to high frequency information from the dataset to reducing the nonlinearity and non-stationary of the dataset, as well as interference and coupling between feature information at different scales. Finally, an autoregression model with high stability and accuracy is used to forecast each IMF.
To investigate the forecasting performance of the proposed model, a comparison experiment with the WRF and SARIMA models was conducted using the observed dataset of RSGS. The qualitative and quantitative results show that the proposed TsVMD-AR model is apparently superior in comparison to other models and is suitable for daily atmospheric turbulence forecasting. The high accuracy and high temporal resolution atmospheric turbulence forecasting based on this method can support advanced scheduling and adaptive optical compensation for the satellite-to-Earth optical data-transmission link, which can avoid data transmission link performance degradation and significantly improve the reliability of the satellite-to-Earth data transmission link.
Data availability statement
The raw data supporting the conclusion of this article will be made available by the authors, without undue reservation.
Author contributions
All authors listed have made a substantial, direct, and intellectual contribution to the work and approved it for publication.
Conflict of interest
The authors declare that the research was conducted in the absence of any commercial or financial relationships that could be construed as a potential conflict of interest.
Publisher’s note
All claims expressed in this article are solely those of the authors and do not necessarily represent those of their affiliated organizations, or those of the publisher, the editors and the reviewers. Any product that may be evaluated in this article, or claim that may be made by its manufacturer, is not guaranteed or endorsed by the publisher.
References
1. Jahid A, Alsharif MH, Hall TJ. A contemporary survey on free space optical communication: Potentials, technical challenges, recent advances and research direction. J Netw Comp Appl (2022) 200:103311. doi:10.1016/j.jnca.2021.103311
2. Sadiku MNO, Musa SM, Nelatury SR. Free space optical communications: An overview. Eur Scientific J ESJ (2016) 12(9):55. doi:10.19044/esj.2016.v12n9p55
3. Zhu Z, Janasik M, Fyffe A, Hay D, Zhou Y, Kantor B, et al. Compensation-free high-dimensional free-space optical communication using turbulence-resilient vector beams. Nat Commun (2021) 12(1):1666. doi:10.1038/s41467-021-21793-1
4. Böhmer K, Gregory M, Heine F, Kämpfner H, Lange R, Lutzer N, et al. Laser communication terminals for the European data relay system. In: Free-Space Laser Communication Technologies XXIV; February 2012; San Francisco, California, United States (2012).
5. Chen M, Liu C, Rui D, Xian H. Performance verification of adaptive optics for satellite-to-ground coherent optical communications at large zenith angle. Opt Express (2018) 26(4):4230. doi:10.1364/oe.26.004230
6. Hemmati H, Biswas A, Djordjevic IB. Deep-space optical communications: Future perspectives and applications. Proc IEEE (2011) 99(11):2020–39. doi:10.1109/jproc.2011.2160609
7. Oaida BV, Wu W, Erkmen BI, Biswas A, Andrews KS, Kokorowski M, Wilkerson M. Optical link design and validation testing of the Optical Payload for Lasercomm Science (OPALS) system. In: Free-Space Laser Communication and Atmospheric Propagation XXVI; March 2014; San Francisco, California, United States (2014).
8. Smutny B, Kaempfner H, Muehlnikel G, Sterr U, Wandernoth B, Heine F, et al. 5.6 Gbps optical intersatellite communication link. In: Free-Space Laser Communication Technologies XXI; February 2009; San Francisco, California, United States (2009).
9. Wang J, Yang JY, Fazal IM, Ahmed N, Yan Y, Huang H, et al. Terabit free-space data transmission employing orbital angular momentum multiplexing. Nat Photon (2012) 6(7):488–96. doi:10.1038/nphoton.2012.138
10. Fu S, Zhai Y, Zhou H, Zhang J, Wang T, Liu X, et al. Experimental demonstration of free-space multi-state orbital angular momentum shift keying. Opt Express (2019) 27(23):33111. doi:10.1364/oe.27.033111
11. Fu S, Zhai Y, Zhou H, Zhang J, Wang T, Yin C, et al. Demonstration of free-space one-to-many multicasting link from orbital angular momentum encoding. Opt Lett (2019) 44(19):4753. doi:10.1364/ol.44.004753
12. Krenn M, Handsteiner J, Fink M, Fickler R, Ursin R, Malik M, et al. Twisted light transmission over 143 km. Proc Natl Acad Sci U S A (2016) 113(48):13648–53. doi:10.1073/pnas.1612023113
13. Li M, Li B, Zhang X, Song Y, Chang L, Chen Y. Investigation of the phase fluctuation effect on the BER performance of DPSK space downlink optical communication system on fluctuation channel. Opt Commun (2016) 366:248–52. doi:10.1016/j.optcom.2016.01.003
14. Yang Q, Li L, Guo P, Wang Q, Yu S, Tan L, et al. Effects of atmospheric turbulence on fiber-coupled DPSK system in Satellite-to-Ground downlink. Results Phys (2018) 11:938–43. doi:10.1016/j.rinp.2018.10.056
15. Kang HJ, Yang J, Chun BJ, Jang H, Kim BS, Kim YJ, et al. Free-space transfer of comb-rooted optical frequencies over an 18 km open-air link. Nat Commun (2019) 10(1):4438. doi:10.1038/s41467-019-12443-8
16. Fu S, Gao C. Influences of atmospheric turbulence effects on the orbital angular momentum spectra of vortex beams. Photon Res (2016) 4(5):B1. doi:10.1364/prj.4.0000b1
17. Baykal Y. Scintillation index in strong oceanic turbulence. Opt Commun (2016) 375:15–8. doi:10.1016/j.optcom.2016.05.002
18. Wang Y, Xu H, Li D, Wang R, Jin C, Yin X, et al. Performance analysis of an adaptive optics system for free-space optics communication through atmospheric turbulence. Sci Rep (2018) 8(1):1124. doi:10.1038/s41598-018-19559-9
19. Liu C, Chen S, Li X, Xian H. Performance evaluation of adaptive optics for atmospheric coherent laser communications. Opt Express (2014) 22(13):15554. doi:10.1364/oe.22.015554
20. Wang Y, Xu H, Li D, Wang R, Jin C, Yin X, et al. Performance analysis of an adaptive optics system for free-space optics communication through atmospheric turbulence. Sci Rep (2018) 8(1):1124. doi:10.1038/s41598-018-19559-9
21. Yang L, Yao K, Wang J, Cao J, Lin X, Liu X, et al. Performance analysis of 349-element adaptive optics unit for a coherent free space optical communication system. Sci Rep (2019) 9(1):13150. doi:10.1038/s41598-019-48338-3
22. Giordano C, Vernin J, Vazquez Ramio H, Munoz-Tunon C, Varela AM, Trinquet H. Atmospheric and seeing forecast: WRF model validation with in situ measurements at ORM. Monthly Notices R Astronomical Soc (2013) 430(4):3102–11. doi:10.1093/mnras/stt117
23. Liu LY, Giordano C, Yao YQ, Vernin J, Chadid M, Wang HS, et al. Optical turbulence characterization at LAMOST site: Observations and models. Mon Not R Astron Soc (2015) 451(3):3299–308. doi:10.1093/mnras/stv1165
24. Masciadri E, Egner S. First seasonal study of optical turbulence with an atmospheric model. Publications Astronomical Soc Pac (2006) 118(849):1604–19. doi:10.1086/509906
25. Masciadri E, Lascaux F, Fini L. Mose: Operational forecast of the optical turbulence and atmospheric parameters at European southern observatory ground-based sites – I. Overview and vertical stratification of atmospheric parameters at 0–20 km. Monthly Notices R Astronomical Soc (2013) 436(3):1968–85. doi:10.1093/mnras/stt1708
26. Masciadri E, Vernin J, Bougeault P. 3D mapping of optical turbulence using an atmospheric numerical model. Astron Astrophys Suppl Ser (1999) 137(1):203–16. doi:10.1051/aas:1999475
27. Masciadri E, Vernin J, Bougeault P. 3D numerical simulations of optical turbulence at the Roque de Los Muchachos Observatory using the atmospherical model Meso-Nh. Astron Astrophys (2001) 365(3):699–708. doi:10.1051/0004-6361:20000050
28. Osborn J, Sarazin M. Atmospheric turbulence forecasting with a general circulation model for Cerro Paranal. Monthly Notices R Astronomical Soc (2018) 480(1):1278–99. doi:10.1093/mnras/sty1898
29. Qian X, Yao Y, Wang H, Zou L, Li Y, Yin J. Validation of the WRF model for estimating precipitable water vapor at the ali observatory on the Tibetan plateau. Publ Astron Soc Pac (2020) 132(1018):125003. doi:10.1088/1538-3873/abc22d
30. Qian X, Yao Y, Zou L, Wang H, Yin J, Li Y. Modelling of atmospheric optical turbulence with the weather research and forecasting model at the ali observatory, tibet. Monthly Notices R Astronomical Soc (2021) 505(1):582–92. doi:10.1093/mnras/stab1316
31. Qing C, Wu X, Huang H, Tian Q, Zhu W, Rao R, et al. Estimating the surface layer refractive index structure constant over snow and sea ice using Monin-Obukhov similarity theory with a mesoscale atmospheric model. Opt Express (2016) 24(18):20424. doi:10.1364/oe.24.020424
32. Qing C, Wu X, Li X, Luo T, Su C, Zhu W. Mesoscale optical turbulence simulations above Tibetan plateau: First attempt. Opt Express (2020) 28(4):4571. doi:10.1364/oe.386078
33. Qing C, Wu X, Li X, Zhu W, Qiao C, Rao R, et al. Use of weather research and forecasting model outputs to obtain near-surface refractive index structure constant over the ocean. Opt Express (2016) 24(12):13303. doi:10.1364/oe.24.013303
34. Yang Q, Wu X, Han Y, Qing C. Estimation of behavior of optical turbulence during summer in the surface layer above the Antarctic Plateau using the Polar WRF model. Appl Opt (2021) 60(14):4084. doi:10.1364/ao.419473
35. Mahalov A, Moustaoui M, Grubišić V. A numerical study of mountain waves in the upper troposphere and lower stratosphere. Atmos Chem Phys (2011) 11(11):5123–39. doi:10.5194/acp-11-5123-2011
36. Cassano JJ, DuVivier AK. Evaluation of WRF model resolution on simulated mesoscale winds and surface fluxes near Greenland. Monthly Weather Rev (2013) 141(3):941–63. doi:10.1175/mwr-d-12-00091.1
37. Iriza A, Dumitrache RC, Lupascu A, Stefan S. Studies regarding the quality of numerical weather forecasts of the WRF model integrated at high-resolutions for the Romanian territory. Atmósfera (2016) 29(1):11–21. doi:10.20937/atm.2016.29.01.02
38. Giordano C, Rafalimanana A, Ziad A, Aristidi E, Chabe J, Fantei-Caujole Y, et al. Contribution of statistical site learning to improve optical turbulence forecasting. Monthly Notices R Astronomical Soc (2021) 504(2):1927–38. doi:10.1093/mnras/staa3709
39. Basu S, He P Imaging and Applied Optics 2014, 2014. SeattleWashington: Optica Publishing Group.Quantifying the dependence of temperature and refractive index structure parameters on atmospheric stability using direct and large-eddy simulations
40. Abahamid A, Vernin J, Benkhaldoun Z, Jabiri A, Azouit M, Agabi A. Seeing, outer scale of optical turbulence, and coherence outer scale at different astronomical sites using instruments on meteorological balloons. Astron Astrophys (2004) 422:1123–7. doi:10.1051/0004-6361:20040215
41. Hong-shuai W, Yong-qiang Y, Xuan Q, Li-yong L, Yi-ping W, Jun-rong L. Method of modeling atmospheric optical turbulence. Chin Astron Astrophysics (2013) 37(3):345–56. doi:10.1016/j.chinastron.2013.07.006
42. Wang Y, Basu S. Using an artificial neural network approach to estimate surface-layer optical turbulence at Mauna Loa, Hawaii. Opt Lett (2016) 41(10):2334. doi:10.1364/ol.41.002334
43. Jellen C, Oakley M, Nelson C, Burkhardt J, Brownell C. Machine-learning informed macro-meteorological models for the near-maritime environment. Appl Opt (2021) 60(11):2938. doi:10.1364/ao.416680
44. Su C, Wu X, Luo T, Wu S, Qing C. Adaptive niche-genetic algorithm based on backpropagation neural network for atmospheric turbulence forecasting. Appl Opt (2020) 59(12):3699. doi:10.1364/ao.388959
45. Vernin J, Munoz-Tunón C. The temporal behaviour of seeing. New Astron Rev (1998) 42(6-8):451–4. doi:10.1016/s1387-6473(98)00051-7
46. Masciadri E, Martelloni G, Turchi A. Optical turbulence forecast: New perspectives. In: Optical sensors and sensing congress. Washington, DC: Optica Publishing Group (2020).
47. Masciadri E, Martelloni G, Turchi A. Filtering techniques to enhance optical turbulence forecast performances at short time-scales. Monthly Notices R Astronomical Soc (2020) 492(1):140–52. doi:10.1093/mnras/stz3342
48. Turchi A, Martelloni G, Masciadri E. Evaluation of filtering techniques to increase the reliability of weather forecasts for ground-based telescopes. In: Adaptive Optics Systems VI; July 2018; Austin, Texas, United States (2018). International Society for Optics and Photonics.
49. Tokovinin A, Kornilov V. Accurate seeing measurements with MASS and DIMM. Monthly Notices R Astronomical Soc (2007) 381(3):1179–89. doi:10.1111/j.1365-2966.2007.12307.x
50. Dragomiretskiy K, Zosso D. Variational mode decomposition. IEEE Trans Signal Process (2014) 62(3):531–44. doi:10.1109/tsp.2013.2288675
51. He Y, Sheng Z, Zhu Y, He M. Adaptive variational mode decomposition method for eliminating instrument noise in turbulence detection. J Atmos Oceanic Tech (2021) 38(1):31–46. doi:10.1175/jtech-d-20-0004.1
52. Schwartz MN, Elliott DL. Mexico wind resource assessment project. Golden, Colorado United States: National Renewable energy laboratory (1995).
53. Hestenes MR. Multiplier and gradient methods. J Optim Theor Appl (1969) 4(5):303–20. doi:10.1007/bf00927673
54. Li Y, Chen X, Yu J. Research on ship-radiated noise denoising using secondary variational mode decomposition and correlation coefficient. Sensors (2018) 18(1):48. doi:10.3390/s18010048
Keywords: turbulence forecasting, free-space optical communication, two-stage variational mode decomposition, autoregression model, correlation analysis
Citation: Li Y, Li L, Guo Y, Zhang H, Fu S, Gao C and Yin C (2022) Atmospheric turbulence forecasting using two-stage variational mode decomposition and autoregression towards free-space optical data-transmission link. Front. Phys. 10:970025. doi: 10.3389/fphy.2022.970025
Received: 15 June 2022; Accepted: 04 July 2022;
Published: 08 August 2022.
Edited by:
Yangjian Cai, Soochow University, ChinaReviewed by:
Qi Chang, National University of Defense Technology, ChinaMuhsin Gokce, TED University, Turkey
Copyright © 2022 Li, Li, Guo, Zhang, Fu, Gao and Yin. This is an open-access article distributed under the terms of the Creative Commons Attribution License (CC BY). The use, distribution or reproduction in other forums is permitted, provided the original author(s) and the copyright owner(s) are credited and that the original publication in this journal is cited, in accordance with accepted academic practice. No use, distribution or reproduction is permitted which does not comply with these terms.
*Correspondence: Yalin Li, bGl5YWxpbkBhaXJjYXMuYWMuY24=
 Yalin Li
 Lang Li2,3,4
 Shiyao Fu