- 1Department of Ophthalmology, The Second Affiliated Hospital of Zhejiang University, School of Medicine, Hangzhou, Zhejiang, China
- 2Intellegent Information Processing Research Institute, School of Mechanical, Electrical and Information Engineering, Shandong University, Weihai, Shandong, China
- 3College of Media Engineering, Communication University of Zhejiang, Hangzhou, China
- 4College of Computer Science, Hangzhou Dianzi University, Hangzhou, China
Purpose: To develop a deep learning method to automatically monitor the implantable collamer lens (ICL) position and quantify subtle alterations in the anterior chamber using anterior segment optical coherence tomography (AS-OCT) images for high myopia patients with ICL implantation.
Methods: In this study, 798 AS-OCT images of 203 patients undergoing ICL implantation at our eye center from April 2017 to June 2021 were involved. A deep learning system was developed to first isolate the corneoscleral, ICL, and lens, and then quantify clinical important parameters in AS-OCT images (central corneal thickness, anterior chamber depth, and lens vault).
Results: The deep learning system was able to accurately isolate the corneoscleral, ICL, and lens with the Dice coefficient ranging from 0.911 to 0.960, and all the F1 scores
Conclusion: The deep learning method provides reliable detection and quantification of AS-OCT scans for postoperative ICL implantation, which can simplify and optimize the management of clinical outcomes of ICL implantations. Also, this is a step towards an objective measurement of the postoperative vault, making the data more comparable and repeatable to each other.
Introduction
High myopia has become a major public health issue regarding its increasing prevalence around the world, with 10% of the world’s population estimated to be affected by 2050 [1, 2]. Nevertheless, for the correction of high myopia, current mainstream laser-assisted refractive surgery can be risky due to the thinning of corneal as well as structural alterations in corneal biomolecules [3]. In recent years, the phakic intraocular lens has been widely accepted as an option for high myopia patients with its wide refractive correction range and preservation of accommodation. One of the most worldwide-used phakic intraocular lens types is the posterior chamber phakic intraocular lens (EVO ICL; STAAR Surgical), which involves placing an intraocular lens inside the eye without manipulating the lens itself [4, 5]. Since the ICL is implanted in the posterior chamber, it is crucial to monitor physiological changes in the eye that may lead to adverse postoperative events. For example, the inappropriate distance between the posterior ICL surface and the anterior crystalline lens (lens vault, LV) can lead to the risk of specific complications, such as anterior subcapsular (ASC) cataracts, and considerable endothelial cell loss [5, 6]. Therefore, the management of the postoperative follow-ups is essential to the long-term success of ICL implantation.
The development of the anterior segment optical coherence tomography (AS-OCT) enables the acquisition and visualization of high-resolution images of the anterior segment structures [7, 8]. With its non-invasive character, the device has been widely used in post-operative follow-up for ICL implantation. Nevertheless, current technology typically requires manual identification and measurement of the structures, which would not be clinically viable to manually label each parameter individually in crowded ophthalmology clinics. Hence, an objective method is required to automatically identify and measure each scan.
Deep learning, a subfield of artificial intelligence (AI), has proven to be effective for automatically analyzing ocular images, including AS-OCT images [9–14]. However, there is no attempt to automatically analyze AS-OCT images following ICL implantations in patients, to whom an appropriate method to manage the follow-ups can prevent major postoperative complications. Herein, this study aims to develop a fully automatic method based on deep learning to monitor the ICL position and identify subtle alterations in the anterior chamber for patients receiving ICL surgery, which could promptly evaluate postoperative risks and discover adverse events.
Methods
Subjects
This work included 203 patients undergoing posterior chamber phakic intraocular lens (EVO ICL; STAAR Surgical) implantation between April 2017 and June 2021 at the Eye Center, the Second Affiliated Hospital of Zhejiang University, College of Medicine, China. The surgeries were performed by senior surgeons. Patients with a history of cataracts, glaucoma, uveitis, or ocular surgery that could affect structures in AS-OCT were excluded. The postoperative scans were obtained from the swept-source Casia SS-1000 AS-OCT (Tomey Corporation, Nagoya, Japan).
The Ethics Committee of the Second Affiliated Hospital of Zhejiang University, College of Medicine, approved this study. All methods adhered to the tenets of the Declaration of Helsinki.
Deep learning system development
To fully automatically obtain the values in the AS-OCT images following ICL implantation in clinical practices, the deep learning system consists of two approaches: the detection approach and the quantification approach (Figure 1). We developed the system using 598 images (75%) for training, and the remaining 200 images for testing.
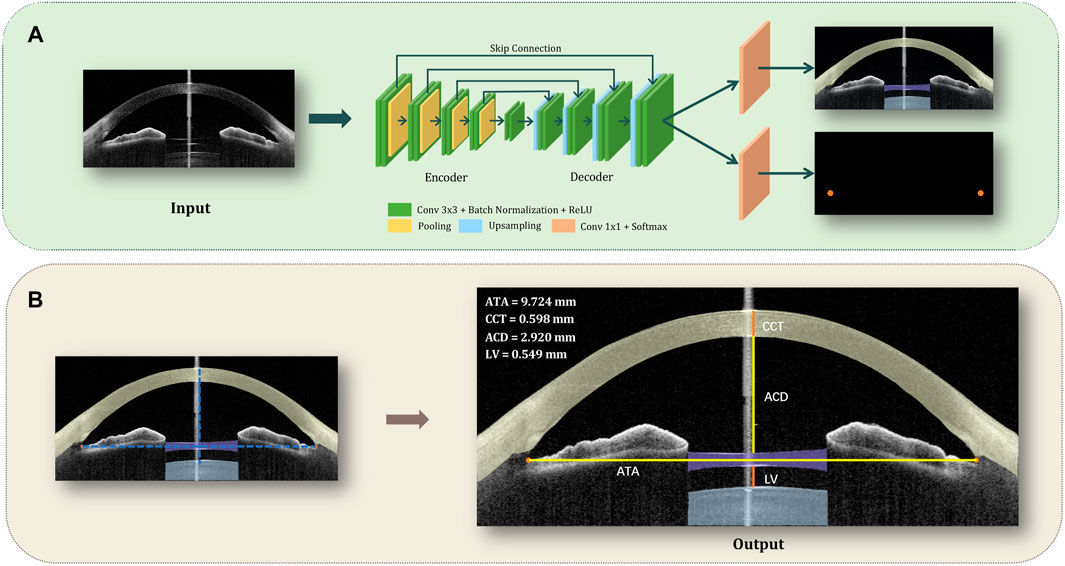
FIGURE 1. Flowchart of the deep learning system, which is able to monitor the ICL position and recognize subtle alterations in the anterior chamber using AS-OCT images for patients with ICL. (A). The detection approach: each AS-OCT image was manually segmented into 5 parts (the corneosclera, ICL, lens, and angle recess points for both left and right) and put into an improved U-Net architecture for the training process. Then, the test images went through the detection approach to generate the segmentation map. (B). The quantification approach: the centroid of the maximum connected area of the angle recess area was calculated and defined as the final coordinate of the points. Then we connected the left and the right angle recess, and make the perpendicular bisector of ATA, which represents the line of axis oculi. Afterward, the intersections of the contour and the axis oculi were connected to calculate CCT, ACD, and LV respectively.
The detection approach involved automated recognition of the corneoscleral, ICL, natural lens, and angle recess points (Figure 1A): Each AS-OCT image was manually segmented into 5 parts (the corneosclera, the ICL, the natural lens, and the angle recess points for both left and right) to guide the training of an improved U-Net network. The U-shape network was composed of an encoder, decoder, and skip connection. The encoder was made up of four downsampling blocks, and each downsampling block consisted of two CBRs followed by a pooling layer, while CBR is referred to as conv
Then, the quantification approach automatically obtained central corneal thickness (CCT), anterior chamber depth (ACD), and LV (Figure 1B): To automatically obtain the values, we calculated the centroid of the maximum connected area of the angle recess area, which was the final location coordinate of the point. Then we connected the left and right angle recess points (angle recess to angle recess, ATA), and make the perpendicular bisector of ATA, which represents the line of axis oculi. Afterward, the intersections of the contour and the axis oculi were connected to calculate CCT, ACD, and LV respectively.
For network implementation, we used the Pytorch platform with an Nvidia GeForce RTX 3090 GPU. During model optimization, the number of training epochs was set to 150, and the batch size was set to 1. Dice loss was implemented with a learning rate of 0.00003. We applied an RMSprop optimizer with a weight decay of
Performance of the deep learning system
To assess the performance of the system, we evaluated the segmentation performance and the quantification performance respectively.
The segmentation performances were assessed using the Dice coefficient, which indicates the similarity between the manual and automated segmentation. Besides, we used the error of X-coordinate, Y-coordinate and absolute values to assess the performance of the two angle recess points segmentation, and precision, recall, F1 score and mean IoU to evaluate the performance of the corneosclera, ICL, and the lens segmentation. For comparison, the ResNet-18, state-of-the-art ReLayNet [15], and DeepLabel V3+ (commonly used for OCT segmentation) [16] models were also implemented.
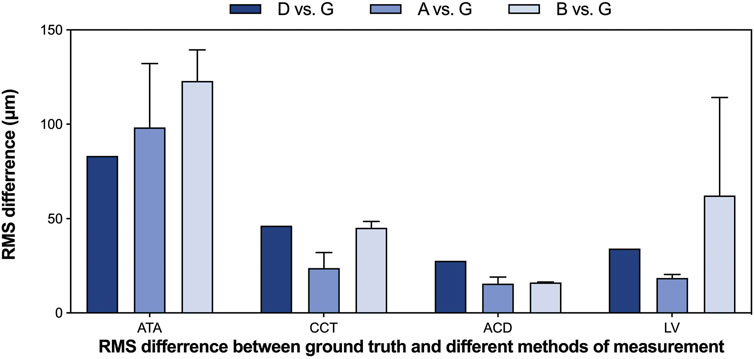
To assess the accuracy, reproducibility, and repeatability of the measurement, we performed various tests involving the following measurements: G-the ground truth, D-the deep learning system, A-expert s, B-expert c. The ground truth measurements were obtained by manually labeling the edges of the corneosclera, ICL, natural lens, and angle recess points in the test sets and connecting the intersections of the contour and the axis oculi to calculate CCT, ACD, and LV respectively. The relative error, defined as the ratio of the absolute error (D vs. G) and the ground truth value, was used to evaluate the accuracy of the measurements. Bland-Altman plots were used to visualize the distribution of discrepancy between the measurements of ground truth and the deep learning system. The intraclass correlation coefficient (ICC) was used to indicate the degree of agreement and correlation between individual measurements (G vs. D; G vs. A; G vs. B). ICCs of 0.41–0.60, 0.60–0.80, and 0.80–1.00 were taken as moderate, substantial, and excellent agreement, respectively [17]. The root mean square (RMS) difference was calculated to assess human-ground truth differences and machine-ground truth differences, as well as the repeatability of different methods.
Results
Patient characteristics
In total, 798 AS-OCT images from 203 patients (406 eyes) collected from April 2017 to June 2021 were included for analysis after 5 images were excluded (due to poor quality). We used 598 images from 102 patients (204 eyes) for training and validation (training:validation = 7:1) and 200 images from 101 patients (202 eyes) for testing. In the test set, 2 test images were further excluded in the measurement step due to invalid segmentation. The patients were in stable recovery with a mean follow-up period of 130 days. The mean and standard deviation of participant age was
Segmentation performance
To create the line of axis oculi in the quantification approach, we segmented the angle recess area in the first step. The segmentation performance of the angle recess area was evaluated using the error of X-coordinate, Y-coordinate, absolute value, and Dice coefficient. The system was able to locate the angle recess area accurately. The mean-variance of the left angle recess area was
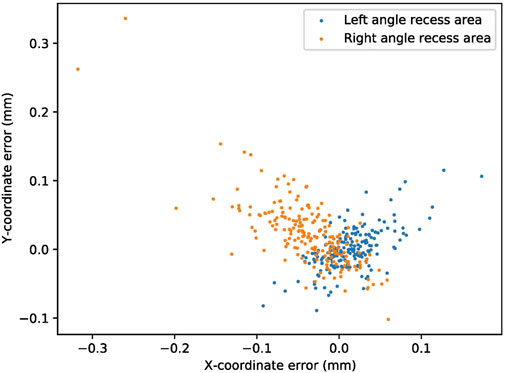
FIGURE 2. The segmentation performance of the angle recess area. The blue and orange dots represent the X-coordinate and Y-coordinate errors of the angle recess area, respectively.
To obtain the edges of the corneoscleral, ICL, and natural lens, these structures were also separated in the first step. Table 1 lists the segmentation performance of the corneosclera, ICL, and natural lens (using the Dice score, mean IoU, precision, recall, and F1 score), which indicated that the network possessed the ability to accurately identify the structures. The Dice score of these structures ranged from 0.911 to 0.960, and the mean IoU ranged from 0.868 to 0.923. The precision, recall, and F1 score of these structures ranged from 0.945 to 0.971, 0.894 to 0.976, and 0.926 to 0.960 respectively. Compared with previous models, the numerical results showed that our U-Net-based method outperformed the Deep Label V3+ and ReLayNet models (Supplementary Table S2), especially in recognizing the corneoscleral.
Measurement performance
Based on the performance of the segmentation step, we developed an automatic method to quantify these essential anterior segment parameters (ATA, CCT, ACD, and LV). Table 2 lists the outcomes of the automated measurements and ground truth.
We evaluated the accuracy of automated measurements using relative errors between the output measurements and the ground truth, as shown in Figure 3. The relative errors indicated the high accuracy of the deep learning measurement. More specifically, for all measurements of ATAs and ACDs, 89% of CCTs and 95% of LVs, the relative error between automated measurements and ground truth was within 10% compared with the ground truth.
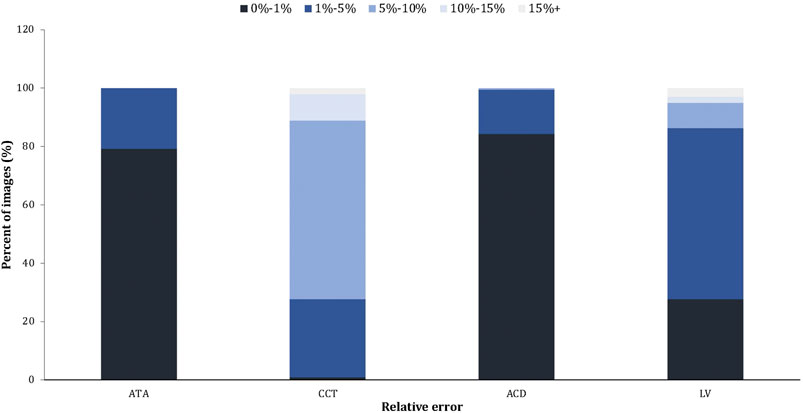
FIGURE 3. The relative error of the automated measurement (Machine vs. Ground truth). The relative error = the absolute error/the ground truth × 100%.
We also assessed the degree of agreement and correlation between measurements using ICCs. The ICCs between the deep learning method and the ground truth of ATA, CCT, ACD, and LV ranged from 0.928 to 0.995, indicating excellent agreement between the automated method and the ground truth. The Bland-Altman plots (Figure 4) also confirmed the excellent agreement and acceptable limits of agreement between the automated method and the ground truth, with the bias ranging from −0.05 to 0.01 mm. Furthermore, the RMS difference between ground truth and various methods of measurement (Figure 5) showed that human-ground truth differences were not significantly different from machine-ground truth differences in most cases. In addition, the error bars of RMS differences between A, B, and G measurements showed that the deep learning method (without error bars) possessed better repeatability than human experts.
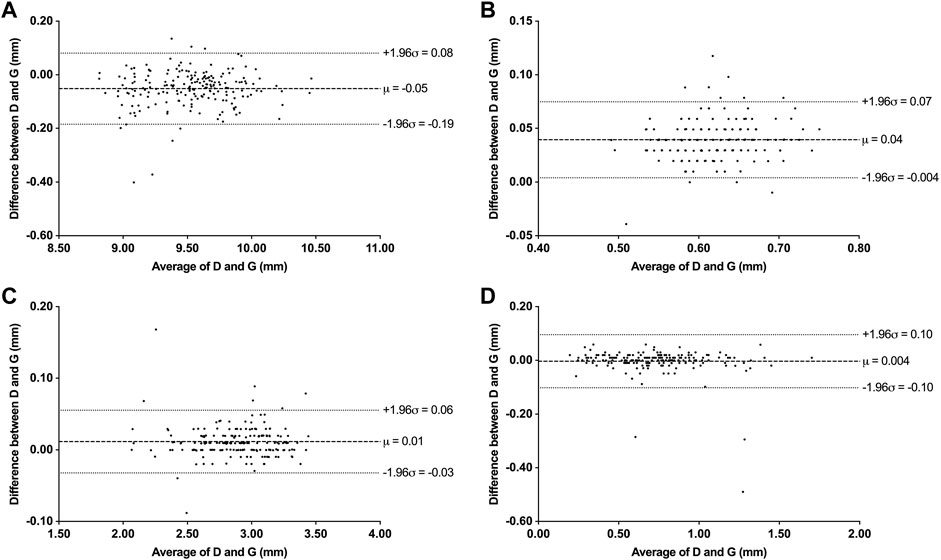
FIGURE 4. Bland-Altman plots between deep learning system (D) and ground truth (G) measurements. (A) Bland-Altman plots for ATA. (B) Bland-Altman plots for CCT. (C) Bland-Altman plots for ACD. (D) Bland-Altman plots for LV.
Discussion
Postoperative follow-ups should be effectively managed to prevent major complications for patients undergoing ICL implantation. With the development of the AS-OCT, subtle changes in the anterior chamber could be discovered and quantified during the follow-ups. In this study, we presented a deep learning method to automatically monitor the position of ICL and promptly identify minor changes in the anterior chamber, including detecting the main structures (the angle recess area, corneoscleral, ICL, and natural lens) and quantifying the anterior chamber parameters (ATA, CCT, ACD, and vault) in AS-OCT images for postoperative ICL patients. The method was based on the U-Net architecture and achieved human expert-level performance.
U-Net, comprising an encoder and a decoder network connected by skip connections, has been showing great promises in segmenting medical images [18–23], including assisting in clinical follow-ups [24–26]. In this study, we developed an improved U-Net architecture for the segmentation module, which includes the segmentation of angle recess points and other structures. Traditionally, in localizing key points of ophthalmic images, the convolutional neural networks (CNN) regression method, such as ResNet18, is usually applied to output the coordinates of the target point [13]. Nevertheless, in our multi-task application scenario, using one network for each task would increase the computation and training costs, and tasks cannot promote each other’s performance through interaction. In this study, a more simplified and efficient method was introduced. The method regarded the localization task as finding the segmentation map of the target point regions and the centroids of their largest connected region, to obtain the coordinates. In this way, the two tasks can be completed with only an improved U-Net, without integrating multiple networks, enhancing the simplicity and versatility of the model. Compared with previous models, our method showed a higher accuracy with an absolute error of 0.037 mm for the left angle recess area and 0.063 mm for the right angle recess area (0.487, 0.389 for the Resnet-18 model). In addition, the angle recess points are the key anatomic landmark in the next quantification process, whose performance can be affected by the radius of the points. Therefore, it is crucial to select a proper value for the radius. When trained on the same training data, we found that the performance peaked at 20 pixels (Supplementary Figure S1). For segmentation of the other structures, besides a high Dice coefficient, the module also achieved a high F1 score and mIoU, showing its great potential in accurately isolating AS-OCT structures. For comparison, this method also outperformed the RelayNet and DeepLabel V3+ models in identifying different structures, especially for corneoscleral (Dice coefficient 0.925 vs. 0.888 vs. 0.960). Furthermore, ICCs between automated values and the ground truth were relatively high, making it a reliable method to assist in follow-ups in daily practice.
It is an important mitigation of vault-related adverse events to closely observe ICLs with insufficient or excessive vault [5]. Previous studies showed the risk of cataract formation increases when the vault is low (
Besides the vault-related adverse event, the endothelial cell loss and other subtle changes in the anterior chamber should also be aware. The loss of endothelial cells varied across studies, while it is considered that the largest loss occurs during the early postoperative period, and the surgical procedure is the main cause of the loss [28]. Our deep learning system can separate the corneosclera accurately (with the Dice score, mean IoU, precision, recall and F1 score
There are also some limitations to our study. First, our study only included a relatively small data set with a specific population (Chinese), which would benefit from external validation of other ethnic groups. Second, the AS-OCT images were obtained from a single type of equipment (Casia SS-1000 AS-OCT). This should be further investigated if there is any difference among measurements of various types of equipment. Finally, to better monitor the postoperative risks, the method could be further developed into a web-based or app-based dataset, which can also record other information during the follow-ups. Above all, there has been an acceleration of adopting new models of healthcare delivery following the rapid changes to healthcare systems during COVID-19 [38].
In summary, we developed a deep learning method to manage the follow-ups after ICL implantations, which can monitor the position of ICL and identify the subtle changes in the anterior chamber with high performance in both the segmentation and measurement process. This method could assess the postoperative risk and discover the complications timely, which can assist patients and ophthalmologists in daily practice. Also, it is a relatively objective approach to obtain the measurements in AS-OCT images, which can make the data between different studies more comparable and repeatable to each other, including eliminating the deviation caused by the image rotation and personal equation.
Data availability statement
The datasets presented in this article are not readily available because they contain identifying patient information. Requests to access the datasets should be directed to the Second Affiliated Hospital of Zhejiang University, School of Medicine.
Ethics statement
Written informed consent was obtained from the individual(s) for the publication of any potentially identifiable images or data included in this article.
Author contributions
YS, JL, PX, YW, SH, GJ, SW, and JY contributed to conception and design of the study. YS collected and prepared the dataset. JL programmed the deep learning system. YS and PC performed manual measurements. YS, JL, and PX performed the statistical analysis. YS wrote the first draft of the manuscript. PX contributed to the main revision of the first draft. All authors contributed to manuscript revision, read, and approved the submitted version. JY and SW supervised the study.
Funding
1) National Natural Science Foundation Regional Innovation and Development Joint Fund (U20A20386), 2) National key research and development program of China (2019YFC0118400), 3) Key research and development program of Zhejiang Province (2019C03020), 4) National Natural Science Foundation of China (81870635), 5) Clinical Medical Research Center for Eye Diseases of Zhejiang Province (2021E50007), 6) Natural Science Foundation of Shandong Province (2022HWYQ-041).
Conflict of interest
The authors declare that the research was conducted in the absence of any commercial or financial relationships that could be construed as a potential conflict of interest.
Publisher’s note
All claims expressed in this article are solely those of the authors and do not necessarily represent those of their affiliated organizations, or those of the publisher, the editors and the reviewers. Any product that may be evaluated in this article, or claim that may be made by its manufacturer, is not guaranteed or endorsed by the publisher.
Supplementary material
The Supplementary Material for this article can be found online at: https://www.frontiersin.org/articles/10.3389/fphy.2022.969683/full#supplementary-material
References
1. Holden BA, Fricke TR, Wilson DA, Jong M, Naidoo KS, Sankaridurg P, et al. Global prevalence of myopia and high myopia and temporal trends from 2000 through 2050. Ophthalmology (2016) 123(5):1036–42. doi:10.1016/j.ophtha.2016.01.006
2. Morgan IG, Ohno-Matsui K, Saw SM. Lancet (2012) 379(9827):1739–48. doi:10.1016/S0140-6736(12)60272-4
3. Brenner LF, Alio JL, Vega-Estrada A, Baviera J, Beltran J, Cobo-Soriano R. Clinical grading of post-LASIK ectasia related to visual limitation and predictive factors for vision loss. J Cataract Refract Surg (2012) 38(10):1817–26. doi:10.1016/j.jcrs.2012.05.041
4. Kim TI, Alio Del Barrio JL, Wilkins M, Cochener B, Ang M. Refractive surgery. The Lancet (2019) 393(10185):2085–98. doi:10.1016/s0140-6736(18)33209-4
5. Packer M. Meta-analysis and review: Effectiveness, safety, and central port design of the intraocular collamer lens. Clin Ophthalmol (2016) 10:1059–77. doi:10.2147/opth.s111620
6. Yang W, Zhao J, Sun L, Zhao J, Niu L, Wang X, et al. Four-year observation of the changes in corneal endothelium cell density and correlated factors after Implantable Collamer Lens V4c implantation. Br J Ophthalmol (2021) 105(5):625–30. doi:10.1136/bjophthalmol-2020-316144
7. Ang M, Baskaran M, Werkmeister RM, Chua J, Schmidl D, Aranha Dos Santos V, et al. Anterior segment optical coherence tomography. Prog Retin Eye Res (2018) 66:132–56. doi:10.1016/j.preteyeres.2018.04.002
8. Thomas R. Anterior segment optical coherence tomography. Ophthalmology (2007) 114(12):2362–3. doi:10.1016/j.ophtha.2007.05.050
9. Ting DSW, Lin H, Ruamviboonsuk P, Wong TY, Sim DA. Artificial intelligence, the internet of things, and virtual clinics: Ophthalmology at the digital translation forefront. Lancet Digit Health (2020) 2(1):e8–e9. doi:10.1016/s2589-7500(19)30217-1
10. Gulshan V, Peng L, Coram M, Stumpe MC, Wu D, Narayanaswamy A, et al. Development and validation of a deep learning algorithm for detection of diabetic retinopathy in retinal fundus photographs. JAMA (2016) 316(22):2402–10. doi:10.1001/jama.2016.17216
11. Ting DSW, Cheung CY, Lim G, Tan GSW, Quang ND, Gan A, et al. Development and validation of a deep learning system for diabetic retinopathy and related eye Diseases using retinal images from multiethnic populations with diabetes. JAMA (2017) 318(22):2211–23. doi:10.1001/jama.2017.18152
12. Fu H, Baskaran M, Xu Y, Lin S, Wong DWK, Liu J, et al. A deep learning system for automated angle-closure detection in anterior segment optical coherence tomography images. Am J Ophthalmol (2019) 203:37–45. doi:10.1016/j.ajo.2019.02.028
13. Xu BY, Chiang M, Pardeshi AA, Moghimi S, Varma R. Deep neural network for scleral spur detection in anterior segment OCT images: The Chinese American eye study. Transl Vis Sci Technol (2020) 9(2):18. doi:10.1167/tvst.9.2.18
14. Pham TH, Devalla SK, Ang A, Soh ZD, Thiery AH, Boote C, et al. Deep learning algorithms to isolate and quantify the structures of the anterior segment in optical coherence tomography images. Br J Ophthalmol (2021) 105(9):1231–7. doi:10.1136/bjophthalmol-2019-315723
15. Roy AG, Conjeti S, Karri SPK, Sheet D, Katouzian A, Wachinger C, et al. ReLayNet: Retinal layer and fluid segmentation of macular optical coherence tomography using fully convolutional networks. Biomed Opt Express (2017) 8(8):3627–42. doi:10.1364/boe.8.003627
16.L-C Chen, Y Zhu, G Papandreou, F Schroff, and H Adam, 2018. Encoder-decoder with atrous separable convolution for semantic image Segmentation2018. Cham: Springer International Publishing.
17. Chen CC, Barnhart HX. Assessing agreement with intraclass correlation coefficient and concordance correlation coefficient for data with repeated measures. Comput Stat Data Anal (2013) 60:132–45. doi:10.1016/j.csda.2012.11.004
18. Ibtehaz N, Rahman MS. MultiResUNet : Rethinking the U-Net architecture for multimodal biomedical image segmentation. Neural Netw (2020) 121:74–87. doi:10.1016/j.neunet.2019.08.025
19. Sirinukunwattana K, Pluim JPW, Chen H, Qi X, Heng PA, Guo YB, et al. Gland segmentation in colon histology images: The glas challenge contest. Med Image Anal (2017) 35:489–502. doi:10.1016/j.media.2016.08.008
20. Ronneberger O, Fischer P, Brox T. U-net: Convolutional networks for biomedical image segmentation. Med Image Comput Computer-Assisted Intervention—MICCAI (2015) 9351:234–41.
21. Yu LQ, Yang X, Chen H, Qin J, Heng PA. Volumetric ConvNets with mixed residual connections for automated prostate segmentation from 3D MR images. In: Thirty-First Aaai Conference on Artificial Intelligence; February 4 –9, 2017; San Francisco (2017). p. 66–72.
22. Christ PF, Mohamed Ezzeldin A, Ettlinger F, Tatavarty S, Bickel M, Bilic P, et al. Automatic liver and lesion segmentation in CT using cascaded fully convolutional neural networks and 3D conditional random fields. International conference on medical image computing and computer-assisted intervention: September 18th to 22nd 2022;Singapore 2016. p. (pp. 415–23).
23. Wang S, He KL, Nie D, Zhou SH, Gao YZ, Shen DG. CT male pelvic organ segmentation using fully convolutional networks with boundary sensitive representation. Med Image Anal (2019) 54:168–78. doi:10.1016/j.media.2019.03.003
24.Y Li, J Yang, Y Xu, J Xu, X Ye, G Taoet al. 2020. Learning tumor growth via follow-up volume prediction for lung Nodules2020. Cham: Springer International Publishing.
25. Tao G, Zhu L, Chen Q, Yin L, Li Y, Yang J, et al. Prediction of future imagery of lung nodule as growth modeling with follow-up computed tomography scans using deep learning: A retrospective cohort study. Transl Lung Cancer Res (2022) 11(2):250–62. doi:10.21037/tlcr-22-59
26. Zhang Y, Zhang X, Ji Z, Niu S, Leng T, Rubin DL, et al. An integrated time adaptive geographic atrophy prediction model for SD-OCT images. Med Image Anal (2021) 68:101893. doi:10.1016/j.media.2020.101893
27. Fernandes P, Gonzalez-Meijome JM, Madrid-Costa D, Ferrer-Blasco T, Jorge J, Montes-Mico R. Implantable collamer posterior chamber intraocular lenses: A review of potential complications. J Refract Surg (2011) 27(10):765–76. doi:10.3928/1081597x-20110617-01
28. Montes-Mico R, Ruiz-Mesa R, Rodriguez-Prats JL, Tana-Rivero P. Posterior-chamber phakic implantable collamer lenses with a central port: A review. Acta Ophthalmol (2021) 99(3):e288–e301. doi:10.1111/aos.14599
29. Rodriguez-Una I, Rodriguez-Calvo PP, Fernandez-Vega Cueto L, Lisa C, Fernandez-Vega Cueto A, Alfonso JF. Intraocular pressure after implantation of a phakic collamer intraocular lens with a central hole. J Refract Surg (2017) 33(4):244–9. doi:10.3928/1081597x-20170110-01
30. Nam SW, Lim DH, Hyun J, Chung ES, Chung TY. Buffering zone of implantable Collamer lens sizing in V4c. BMC Ophthalmol (2017) 17(1):260. doi:10.1186/s12886-017-0663-4
31. Fernandez-Vigo JI, Macarro-Merino A, Fernandez-Vigo C, Fernandez-Vigo JA, De-Pablo-Gomez-de-Liano L, Fernandez-Perez C, et al. Impacts of implantable collamer lens V4c placement on angle measurements made by optical coherence tomography: Two-year follow-up. Am J Ophthalmol (2017) 181:37–45. doi:10.1016/j.ajo.2017.06.018
32. Yan Z, Miao H, Zhao F, Wang X, Chen X, Li M, et al. Two-year outcomes of visian implantable collamer lens with a central hole for correcting high myopia. J Ophthalmol (2018) 2018:1–9. doi:10.1155/2018/8678352
33. Alfonso JF, Fernandez-Vega-Cueto L, Alfonso-Bartolozzi B, Montes-Mico R, Fernandez-Vega L. Five-year follow-up of correction of myopia: Posterior chamber phakic intraocular lens with a central port design. J Refract Surg (2019) 35(3):169–76. doi:10.3928/1081597x-20190118-01
34. Gonzalez-Lopez F, Mompean B, Bilbao-Calabuig R, Vila-Arteaga J, Beltran J, Baviera J. Dynamic assessment of light-induced vaulting changes of implantable collamer lens with central port by swept-source OCT: Pilot study. Transl Vis Sci Technol (2018) 7(3):4. doi:10.1167/tvst.7.3.4
35. Gonzalez-Lopez F, Bilbao-Calabuig R, Mompean B, Luezas J, Ortega-Usobiaga J, Druchkiv V. Determining the potential role of crystalline lens rise in vaulting in posterior chamber phakic collamer lens surgery for correction of myopia. J Refract Surg (2019) 35(3):177–83. doi:10.3928/1081597x-20190204-01
36. Alfonso JF, Fernandez-Vega L, Lisa C, Fernandes P, Jorge J, Montes Mico R. Central vault after phakic intraocular lens implantation: Correlation with anterior chamber depth, white-to-white distance, spherical equivalent, and patient age. J Cataract Refract Surg (2012) 38(1):46–53. doi:10.1016/j.jcrs.2011.07.035
37. Strenk SA, Strenk LM, Guo S. Magnetic resonance imaging of the anteroposterior position and thickness of the aging, accommodating, phakic, and pseudophakic ciliary muscle. J Cataract Refract Surg (2010) 36(2):235–41. doi:10.1016/j.jcrs.2009.08.029
Keywords: ICL (implantable collamer lens), anterior segment optical coherence tomography (AS-OCT), follow-up, high myopia, vault, deep learning, artificial neural network
Citation: Sun Y, Li J, Xu P, Chen P, Wang Y, Hu S, Jia G, Wang S and Ye J (2022) Automatic quantifying and monitoring follow-ups for implantable collamer lens implantation using AS-OCT images. Front. Phys. 10:969683. doi: 10.3389/fphy.2022.969683
Received: 15 June 2022; Accepted: 15 August 2022;
Published: 30 August 2022.
Edited by:
Minbiao Ji, Fudan University, ChinaReviewed by:
Yu Zhao, Technical University of Munich, GermanyJiancheng Yang, Swiss Federal Institute of Technology Lausanne, Switzerland
Copyright © 2022 Sun, Li, Xu, Chen, Wang, Hu, Jia, Wang and Ye. This is an open-access article distributed under the terms of the Creative Commons Attribution License (CC BY). The use, distribution or reproduction in other forums is permitted, provided the original author(s) and the copyright owner(s) are credited and that the original publication in this journal is cited, in accordance with accepted academic practice. No use, distribution or reproduction is permitted which does not comply with these terms.
*Correspondence: Juan Ye, eWVqdWFuQHpqdS5lZHUuY24=; Shuai Wang, c2h1YWl3YW5nLnRhaUBnbWFpbC5jb20=
†The first two authors contributed equally to this work.
 Yiming Sun
 Jinhao Li
 Peifang Xu
 Pengjie Chen1
 Gangyong Jia
 Shuai Wang

