Corrigendum: Active optical clock lasing on the Cs 7S1/2-6P3/2 transition under a weak magnetic field
 Tiantian Shi
 Jianxiang Miao
 Jia Zhang
 Jingbiao Chen
- 1State Key Laboratory of Advanced Optical Communication Systems and Networks, Institute of Quantum Electronics, School of Electronics, Peking University, Beijing, China
- 2Hefei National Laboratory, Hefei, China
In the bad-cavity limit, the collective atomic dipole is highly coherent, resulting in the phase information of an active optical clock (AOC) laser primarily stored in the atomic gain medium. Therefore, compared with the good-cavity laser, the sensitivity of an AOC laser to cavity fluctuations is greatly reduced, as characterized by the suppressed cavity-pulling effect. In this work, the AOC lasing on the cesium 7S1/2-6P3/2 clock transition with a natural linewidth of 1.81 MHz under a weak magnetic field is achieved. We calculate the Zeeman spectra of upper and lower states of clock transition, and measure the beat-note spectrum between different Zeeman-sublevel transitions of 7S1/2-6P3/2. Moreover, the cavity-pulling, temperature, power, and linewidth characteristics of the AOC laser are demonstrated under a weak magnetic field. Such an emerging laser can be applied as a narrow-linewidth local oscillator, as well as an active optical frequency standard, which is promising for the field of precision measurement.
1 Introduction
The ultranarrow-linewidth laser with long coherence time has an irreplaceable status in the field of precision measurement. One of the most important applications is the measurement of time or frequency realized by the state-of-the-art optical atomic clocks [1–3], with implications for the geodetic surveys [4], searching for the variation of fundamental constants [5], gravitational wave detection [6], and test of general relativity [7].
Consequently, great efforts have been put into the development of extremely coherent light sources. Three of the most widely used techniques include the Pound–Drever–Hall (PDH) technique using highly stable optical Fabry-Pérot (F-P) resonators [8,9], the spectral-hole burning in cryogenic crystals [10,11], and the stimulated emission of radiation from the atomic gain medium of the active optical clock (AOC) technique to realize mHz-linewidth superradiant lasers [12–18] and frequency stabilized bad-cavity lasers [19,20]. In the first approach, the laser frequency is stabilized to an optical reference cavity with the ultra-stable length to narrow the laser linewidth, which has realized the most-coherent oscillator with the narrowest linewidth of 10 mHz [9]. However, the mirrors of the reference cavity inevitably vibrate due to the thermal Brownian motion noise, limiting the narrowing of laser linewidth and increasing the system complexity. With the second method, frequency stabilizes to a steady-state pattern of spectral holes in cryogenically cooled crystals. The frequency stability has reached
For the bad-cavity laser, the coherence is stored in the collective atom dipole, that is, the gain medium, and the stimulated emission of radiation can be realized when driven by the weak intracavity photon field. Working in the bad-cavity limit, where the atomic decay rate Γgain is much smaller than the cavity dissipation rate κ, only weak cavity-induced feedback on the atomic dipole. Consequently, the laser frequency is mainly determined by the atomic radiation rather than the cavity-mode frequency, which is similar to the hydrogen maser in the microwave domain [21]. The cavity-pulling coefficient is reduced to
In this work, we demonstrated the AOC lasing on the cesium 7S1/2-6P3/2 clock transition under a weak magnetic field using the thermal atomic ensemble. Due to the Zeeman effect, level splitting of 7S1/2 and 6P3/2 states occurs under the action of a magnetic field, which is calculated in the Section 3.1.1. Moreover, the cavity-pulling, temperature, power, magnetic field, and linewidth characteristics of the AOC laser under a weak magnetic field are analyzed in Section 3.2.1, Section 3.2.2, Section 3.2.3, Section 3.2.4, and Section 3.2.5, respectively.
2 Experimental methods
The experimental scheme and relevant energy levels are depicted in Figures 1A,B, respectively. A cloud of thermal cesium atoms in a vapor cell provided the gain medium, which was pumped by the linearly polarized 459 nm interference filter configuration–extended cavity diode laser (IF-ECDL). Moreover, the frequency of the IF-ECDL was stabilized to cesium 6S1/2(F = 4)—7P1/2(F = 3) hyperfine transition by the modulation transfer spectrum (MTS). The natural linewidth of cesium 6S1/2-7P1/2 transition at the wavelength of 459.3 nm is 2π × 126 kHz [24], while the laser linewidth of the IF-ECDL is around 13.3 kHz [25], which is much smaller than that of the corresponding atomic natural linewidth. Moreover, the cesium atoms were pumped by the 459 nm laser through the velocity-selective mechanism. In this work, the pumping power was adjustable in the range of 8–13 mW. Assuming that the pumping light intensity was I = 10 mW/mm2, only atoms in the direction of the cavity mode with a velocity of
FIGURE 1
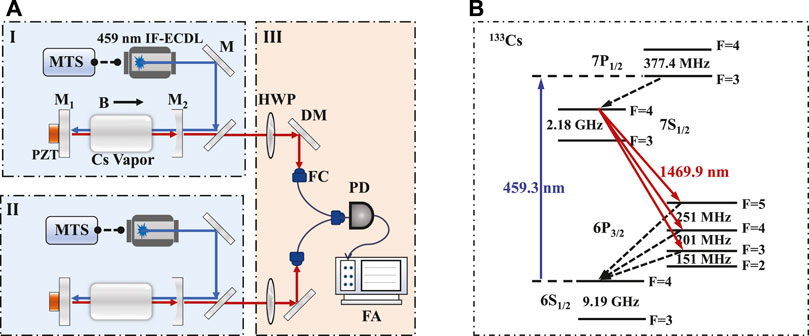
FIGURE 1. Working principle of the 1,470 nm AOC laser. (A) Sketch of the experimental setup for AOC lasing under a weak magnetic field. MTS, modulation transfer spectroscopy; IF-ECDL, interference filter configuration extended cavity diode laser; M, high-reflection coated mirror; M1 and M2, cavity mirrors; PZT, piezoelectric ceramic; HWP, half-wave plate; DM, dichroic mirror coated with anti-reflection at 1,470 nm and high-reflection at 459 nm; FC, fiber coupler; PD, photodetector; FA, frequency analyzer. (B) Hyperfine level scheme for the 133Cs atom shows the 1,470 nm transition as the AOC lasing using 459 nm transition for pumping.
The realization of 1,470 nm lasing is shown in Figure 1B. First, the cesium atoms are pumped from the 6S1/2 (F = 4) ground state to the 7P1/2 (F = 3) state by the 459 nm laser, and then decay to the 7S1/2 (F = 4) upper level by spontaneous radiation. Second, the atoms at the 7S1/2 (F = 4) state decay to 6P3/2 (F = 5, 4, 3) lower levels. Third, the atoms at 6P3/2 (F = 5, 4, 3) levels return to the 6S1/2 ground state and then pumped to the 7P1/2 state again by the continuous-wave 459 nm laser. In the steady state, the population inversion can be built up between 7S1/2 (F = 4) and 6P3/2 (F = 5), 7S1/2 (F = 4) and 6P3/2 (F = 4), and 7S1/2 (F = 4) and 6P3/2 (F = 3) levels, respectively. This result is experimentally demonstrated in our previous work, as given in [27]. In this work, we chose the 7S1/2 (F = 4) to 6P3/2 (F = 5) transition as the clock-transition laser, because the power of stimulated emission between this transition is biggest.
Through the weak feedback of a low-finesse optical cavity consisting of a plane mirror M1 and a plano-concave mirror M2 separated by a distance L = 18 cm, the stimulated emission of radiation on the 7S1/2-6P3/2 transition at a wavelength of 1,470 nm was achieved. The reflectivities of M1 and M2 at the wavelength of 1,470 nm were, separately, 46.5% and 24.5%, and both with anti-reflective coatings at 459 nm. The spontaneous decay rate of cesium 7S1/2-6P3/2 transition is Γ0 = 2π × 1.81 MHz [28], and the Doppler broadening of the 7S1/2 excited state is ΓD = 2π × 8.23 MHz under the condition of pumping light intensity of I = 10 mW/mm2 [26]. Therefore, the atomic decay rate is Γgain = Γ0 + ΓD = 2π × 10 MHz, which is much smaller than the cavity dissipation rate κ = 2π × 244 MHz.
To study the characteristics of active optical frequency standard at a weak external magnetic field, we built two 1,470 nm laser systems, as shown as parts I and II in Figure 1A. A weak magnetic field was induced axially in the vapor cell of part I, while another vapor in part II without applying an additional magnetic field. A double-layer mu-metal magnetic shielding was applied outside each vapor cell to isolate the geomagnetic field. The 1,470 nm laser output from part II only had one frequency mode used as the frequency reference. In part I, the upper and lower levels of 1,470 nm clock transition split under the weak magnetic field, which led to different clock transitions between Zeeman levels of 7S1/2 and 6P3/2 states. The beat-note signal between clock transitions of Zeeman levels input a polarization-maintaining fiber, then was detected by the photodetector (PD) connecting a frequency analyzer (FA). Meanwhile, the beat-note signal between lasers from part I and part II were also measured by the FA. A half-wave plate (HWP) in front of the fiber coupler (FC) was used to adjust the laser power for optical heterodyning.
3 Results
3.1 Theory results
3.1.1 Zeeman spectra of clock-transition levels
Under the weak magnetic field, considering
The Hamiltonian matrix element H is in megahertz. I and J are the nuclear spin and angular momentum, K = F(F + 1) − J(J + 1) − I(I + 1), and A and B represent the magnetic dipole and electric quadrupole constants, respectively. μB and gJ are the Bohr magneton and the Lange g factor, respectively, and μN and gI are the nuclear Bohr magneton and the nuclear g factor, respectively. The first term, second term, and the third therm of Eq. 1 depict the contribution from the zero field, electron Zeeman effect, and nuclear Zeeman effect, respectively. The contribution of nuclear spin is negligible because gI is much smaller than gJ of the cesium atom.
For the 7S1/2 state of cesium, I = 7/2, J = 1/2, the total angular momentum F = I − J = 3 and F = I + J = 4. Under an external magnetic field, the 7S1/2 state splits into (2J + 1)(2I + 1) = 16 Zeeman sublevels. gJ ≈ 2 and A = h ⋅ 545.90 MHz [31]. The electric quadrupole constant B is zero for the state with J = 1/2. Therefore, the Hamiltonian of the cesium 7S1/2 state for each value of m is expressed as follows:
For the 6P3/2 state of cesium, I = 7/2, J = 3/2. The total angular momentum
The Hamiltonian of 7S1/2 and 6P3/2 states for each value of m can be separately expressed in the following matrix form.
and
Solving the eigenvalues of the matrices, we obtain the splitting of energy levels as a function of the magnetic field strength for 7S1/2 and 6P3/2 states, as shown in Figure 2.
FIGURE 2
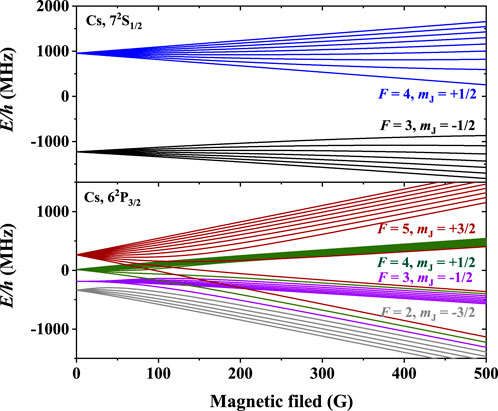
FIGURE 2. Splitting of the energy levels as a function of magnetic-field strength for the 7S1/2 upper level and the 6P3/2 lower level of clock transition. The blue and black lines represent the Zeeman sublevels of 7S1/2 F = 4 and F = 3. The red, green, purple, and gray lines are the Zeeman sublevels of 6P3/2 F = 5, F = 4, F = 3, and F = 2.
3.1.2 Laser linewidth
Working in the bad-cavity limit, the AOC laser has the advantage of the suppressed cavity-pulling effect expressed as the smaller cavity-pulling coefficient, that is, the rate of change of the laser frequency ω with respect to the cavity-mode frequency ωc [12,33].
where the cavity-pulling coefficient is p = 0.039 in this work. The laser frequency mainly depends on the atomic transition and is robust to the change of the cavity length caused by the environmental noise.
Contrary to the good-cavity lasers, AOC utilizes a bad cavity with the cavity dissipation rate being much wider than the atomic decay rate. Therefore, the frequency is insensitive to the cavity-length noise, which helps to narrow the laser linewidth. Without considering the influence of inhomogeneous Doppler broadening and the homogeneous power broadening, and according to the Shawlow–Townes quantum–limited linewidth in the bad-cavity regime [34], the laser linewidth can be expressed as
where n is the average intracavity photon number, and
3.2 Experimental results
Applying a weak magnetic field along the direction of light propagation to the vapor cell in part I of Figure 1A, of which intensity is between 0 and 4 G, the beat-note spectra between different Zeeman sublevels of 1,470 nm clock transition are observed. The subgraphs from top to bottom in Figure 3 represent the beat-note spectrum under a magnetic field of 0.5 G, 1.5 G, and 4 G, respectively. Obviously, under the zero magnetic field, the AOC laser output from the optical cavity of part I contains only one frequency component, and no beat-note signal can be observed by PD in Figure 1A. However, according to Figure 2, the energy levels of 7S1/2 and 6P3/2 split under an external magnetic field. Therefore, there are different transitions between Zeeman sublevels of 7S1/2 F = 4 and 6P3/2 F = 5. With the increase in the magnetic field, the splitting of energy level increases, resulting in the increase of frequency components of the AOC laser and the peaks of beating signal splitting from one to multiple.
FIGURE 3
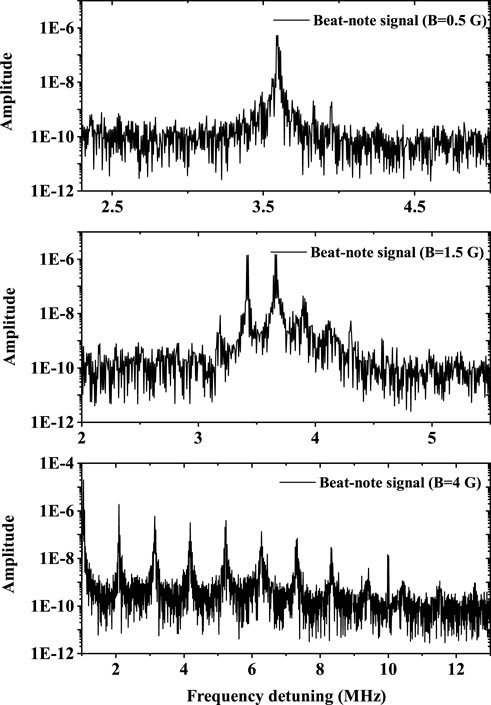
FIGURE 3. Beat-note signal between Zeeman sublevels of 1,470 nm clock-transition output from part I of Figure 1A under different external magnetic fields. The subgraphs from top to bottom represent the results with an external magnetic field of 0.5 G, 1.5 G, and 4 G, respectively.
Next, we analyze the cavity-pulling, temperature, power, magnetic field, and linewidth characteristics of the beat-note signal between Zeeman sublevels of 1,470 nm clock transition under the magnetic field of 0.5 G. In addition, the characteristics of the beat-note signal between 1,470 nm laser output from part I and part II of Figure 1A are studied simultaneously for comparison.
3.2.1 Cavity-pulling effect
According to Eq. 6, the bad-cavity coefficient is 0.039, which means that the influence of cavity-pulling noise on the laser frequency is suppressed by a factor of around 25. First, under zero magnetic field, we measured the central frequency of the beat-note signal between AOC laser, separately, output from part I and part II with the change of cavity-mode frequency of part I, as shown in the red dots in Figure 4. The experimental data were fitted linearly with a slope of 0.045 ± 0.002, which is close to the theoretical value of 0.039. For comparison, under a magnetic field of 0.5 G, the central frequency of the beat-note signal between Zeeman sublevels generated from part I with the change of its cavity-mode frequency is also depicted by the black square dots in Figure 4. Because the lasing generated from part I shared one optical cavity, the influence of common-mode noise induced by cavity-length fluctuation on the central frequency of the beat-note spectrum is greatly suppressed with the fitted cavity-pulling coefficient being only 0.009 ± 0.0003 depicted by the black dotted line.
FIGURE 4
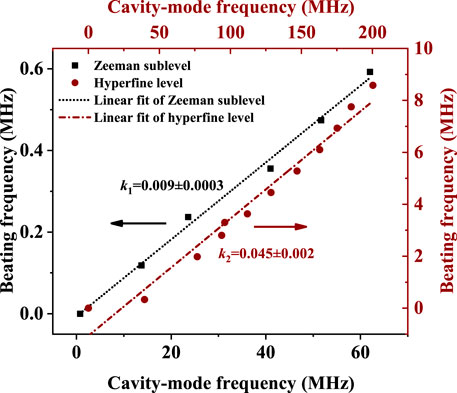
FIGURE 4. Beat-note frequency with the change of cavity-mode frequency. The black square dots are the experimental data of beat-note signal between Zeeman sublevels generated in the part I of Figure 1A under a magnetic field of 0.5 G. The data are fitted linearly with a slope of 0.009 ± 0.0003 (black dotted line). The red dots represent the experimental data of beat-note signal between AOC lasers generated in the part I and part II of Figure 1A without an applied magnetic field. Its linear fitting result is indicated by the red dotted line with a slope of 0.045 ± 0.002.
3.2.2 Temperature characteristic
Moreover, we measured the change of beat-note frequency with the temperature of atomic vapor placed in part I. The red dots in Figure 5 represent the beat-note signal of laser, separately, output from part I and part II, of which frequency is almost linearly changed with the vapor temperature and the slope is 379.8 ± 29.08 kHz/°C. The change in vapor temperature causes the cavity-length variation, which leads to the change in the beat-note frequency [35]. As for the result, as shown by the black square dots in Figure 5, of the beat-note signal between Zeeman sublevels, the fitted slope is only 57.14 ± 4.77 kHz/°C. The smaller slope is owing to the lasers sharing one cavity, which will reduce the influence of temperature change in the beat-note frequency. In addition, this result is similar to the experimental value reported in [20], where the cavity length is stabilized by the optical phase–locking loop technique.
FIGURE 5
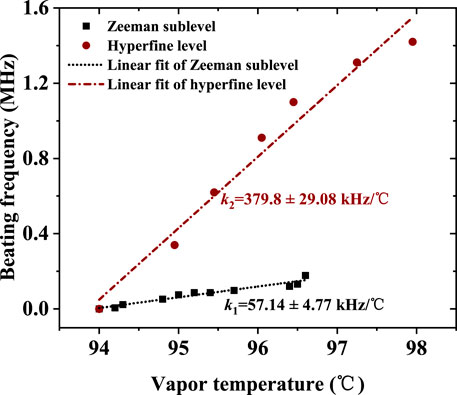
FIGURE 5. Beat-note frequency with the change of vapor temperature. The black square dots are the experimental data of beat-note signal between Zeeman sublevels generated in the part I of Figure 1A under a magnetic field of 0.5 G. The data are fitted linearly with a slope of 57.14 ± 4.77 kHz/°C (black dotted lines). The red dots represent the experimental data of the beat-note signal between AOC lasers generated in the part I and part II of Figure 1A without applied magnetic field. Its linear fitting result is indicated by the red dotted line with a slope of 379.8 ± 29.08 kHz/°C.
3.2.3 Power characteristic
Next, we measured the beat-note frequency versus the power of the 459 nm laser. Figure 6 depicts the beating signal between laser output from part I and part II with a fitted slope of 0.481 ± 0.066 MHz/mW. Here, the experimental result of Zeeman sublevels is not shown, because the central frequency is almost constant with the change of pumping power. However, the pumping power greatly influences the output power of each transition between Zeeman sublevels. The beat-note signal disappears if the laser power changes by more than 1 mW.
FIGURE 6
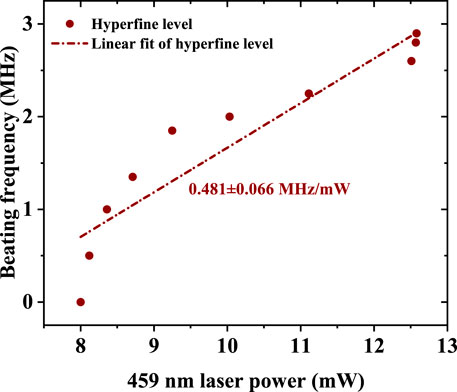
FIGURE 6. Beat-note frequency with the change of power of 459 nm laser. The red dots are the experimental data of the beat-note signal between AOC lasers generated in the part I and part II of Figure 1A without an applied magnetic field. Its linear fitting result is indicated by the red dotted line with a slope of 0.481 ± 0.066 MHz/mW.
3.2.4 Magnetic field characteristic
Under a weak magnetic field, we measured the central frequency of the beat-note signal between Zeeman sublevels with the change in the magnetic field, as depicted in the black square dots in Figure 7. The slope is − 395.8 ± 46.91 kHz/G using linear fitting. At present, the continuous variation range of the beat-note signal with the magnetic field is very small at around 2 MHz. According to Figure 3, the frequency component of the beat-note spectrum becomes complex, and it is difficult to continuously measure the frequency change of one of the beating spectra.
FIGURE 7
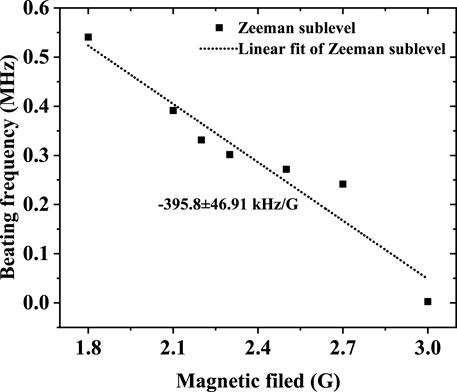
FIGURE 7. Beat-note frequency with the change of an external magnetic field. The black square dots are the experimental data of beat-note signal between Zeeman sublevels generated in the part I of Figure 1A. The data are fitted linearly with a slope of −395.8 ± 46.91 kHz/G (black dotted lines).
In this work, 7S1/2 (F = 4)-6P3/2 (F = 5) transition is used to realize 1,470 nm lasing. Under an external magnetic field, the 7S1/2 (F = 4) and 6P3/2 (F = 5) hyperfine levels are split into 9 and 11 Zeeman sublevels, respectively. The transition selection rule under a weak field satisfies the condition of ΔF = 0, ±1 (except for F = 0 → F = 0), ΔmF = 0, ±1. Therefore, there are 27 kinds of Zeeman transitions. Because the result shown in Figure 7 of the study is measured by the heterodyne beat, there are many beat-note signals between different Zeeman sublevels. It is difficult to distinguish which transition corresponds to each beat-note signal. We can only measure the change in the center frequency of one of the beat-note signals with the magnetic field. Limited by the measurement method, we cannot give a direct theoretical result of the beat-note frequency with the change in the magnetic field in the current study. We leave this problem for future investigations.
3.2.5 Linewidth characteristic
Finally, we analyzed the linewidth characteristic of the beat-note signal between Zeeman sublevel transition between 7S1/2 and 6P3/2 states under an external magnetic field of 0.5 G. A typical beat-note signal is shown in Figure 8 with the resolution bandwidth of 62 Hz. The relative Lorentzian fit linewidth of the power spectrum of the beat-note signal is 100 Hz. It indicates that the relative noise between two modes of Zeeman sublevels is 70 Hz. Although this value is much wider than the quantum-limited linewidth calculated by Eq. 7, it is narrower than the linewidth measured by beating between two identical 1,470 nm lasers [35]. This is because the lasing share one common cavity, and the impact of noises induced by the cavity-length fluctuation, vapor temperature change, and pumping power fluctuation on the linewidth broadening is greatly suppressed. Although the common noise is largely reduced, the residual technical noises, such as the fluctuations of vapor-cell temperature, external magnetic field, and pumping laser power, still influence the laser linewidth. The influence of each type of technical noise on linewidth broadening is analyzed as follows.
FIGURE 8
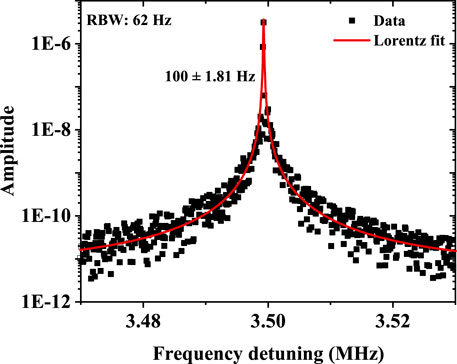
FIGURE 8. Typical beat-note spectrum between Zeeman sublevels of 1,470 nm clock-transition output from part I of Figure 1A under an external magnetic field of 0.5 G (RBW: 62 Hz). The linewidth of the experimental data (black square dots) is obtained by using the Lorentzian fit (red line).
First, the residual temperature fluctuations of the atomic vapor cell are the main factor resulting in the linewidth broadening. According to Figure 5, the slope of the beat-note frequency between different Zeeman sublevels with the change in vapor temperature is 57.14 ± 4.77 kHz/°C. The temperature stability of the vapor cell at a short-time scale is better than 1 × 10⁻⁵. Therefore, after eliminating the most common- mode noise, the influence of residual temperature fluctuations on the relative noise is around 50 Hz at the vapor temperature of 95°C. Second, the contribution of residual power fluctuations of a pumping laser to linewidth broadening is negligible. Third, the applied magnetic field on the atomic vapor is 0.5 G. We installed two layers of mu-metal shield to isolate external magnetic field disturbance, for which the expected stability of magnetic field exceeds ×1 10–4 at a short-time scale. According to Figure 7, the slope of the beat-note frequency with the change of magnetic field is around − 395.8 ± 46.91. Consequently, the linewidth broadening induced by residual fluctuations of the magnetic field is smaller than 20 Hz. In summary, the linewidth broadening induced by the residual technical noises is estimated to be around 70 Hz, which agrees with the measured linewidth as shown in Figure 8. Next, we will further optimize the temperature and magnetic stabilities using a double-layer vapor cell and a multi-layer magnetic shielding, respectively, to narrow the laser linewidth.
In this work, the only beat-note linewidth is given to quantify the instantaneous stability of the 1,470 nm laser. However, the better way to evaluate the frequency stability of a clock is the Allan deviation. Since there still exists the technical noises, especially the temperature drift of the cesium atoms in long timescales, affecting the long-term stability of the 1,470 nm laser, we used the beat-note linewidth between two 1,470 nm Zeeman-sublevel transitions to represent the instantaneous stability. We leave the optimization of the long-term stability for future investigations.
4 Discussion
In this work, we realized the AOC lasing of cesium 7S1/2-6P3/2 transition under a weak magnetic field. The beat-note spectrum is observed between different Zeeman- sublevel transitions. The central frequency of the power spectrum of the beat-note signal versus the cavity-mode frequency, vapor temperature, pumping power under a magnetic field of 0.5 G, respectively, is investigated. Since the Zeeman sublevel transition output from one cavity, the common-mode noises caused by the fluctuation of cavity length, vapor temperature, and pumping power are greatly suppressed. Therefore, the Lorentz fitting linewidth of the beat-note spectrum between Zeeman sublevels is narrower than that between two 1,470 nm lasers’ output from two systems. Further studies about the influence of residual noises on the linewidth broadening will be carried out. Such an AOC laser, whose frequency mainly depends on the atomic transition, can be applied as a stable light source, for example, in passive optical clocks.
Data availability statement
The raw data supporting the conclusions of this article will be made available by the authors, without undue reservation.
Author contributions
JC conceived the idea of the four-level active optical clock. TS performed the experiments and carried out the theoretical calculations. TS wrote the manuscript. JM and JZ provided revisions. All authors contributed equally to the discussions of the results.
Funding
This research was funded by the National Natural Science Foundation of China (NSFC) (91436210), Innovation Program for Quantum Science and Technology (2021ZD0303200), China Postdoctoral Science Foundation (BX2021020), and Wenzhou Major Science and Technology Innovation Key Project (ZG2020046).
Acknowledgments
We give our best wishes on the occasion of Yiqiu Wang’s 90th birthday. The authors would like to thank Wang for many useful discussions about the realization of active optical frequency standard. In particular, Jingbiao Chen sincerely thanks Wang for his support for the idea of active optical clock put forward as early as 2005. In order to encourage young researchers to explore innovative ideas in depth, Wang specially wrote an article to support the idea of active optical clock. His attitude to scientific investigation is the primordial force that propels us forward.
Conflict of interest
The authors declare that the research was conducted in the absence of any commercial or financial relationships that could be construed as a potential conflict of interest.
Publisher’s note
All claims expressed in this article are solely those of the authors and do not necessarily represent those of their affiliated organizations, or those of the publisher, the editors, and the reviewers. Any product that may be evaluated in this article, or claim that may be made by its manufacturer, is not guaranteed or endorsed by the publisher.
References
1. Oelker E, Hutson RB, Kennedy CJ, Sonderhouse L, Bothwell T, Goban A, et al. Demonstration of 4.8 × 10⁻¹⁷ stability at 1 s for two independent optical clocks. Nat Photon (2019) 13:714–9. doi:10.1038/s41566-019-0493-4
2. Brewer SM, Chen J-S, Hankin AM, Clements ER, Chou CW, Wineland DJ, et al. 27Al+ quantum-logic clock with a systematic uncertainty below 10−18. Phys Rev Lett (2019) 123:033201. doi:10.1103/PhysRevLett.123.033201
3.Boulder Atomic Clock Optical Network Collaboration. Frequency ratio measurements at 18-digit accuracy using an optical clock network. Nature (2021) 591:564–9. doi:10.1038/s41586-021-03253-4
4. McGrew WF, Zhang X, Fasano RJ, Schäffer SA, Beloy K, Brown RC. Atomic clock performance enabling geodesy below the centimetre level. Nature (2018) 564:87–90. doi:10.1038/s41586-018-0738-2
5. Godun RM, Nisbet-Jones PBR, Jones JM, King SA, Johnson LAM, Margolis HS, et al. Frequency ratio of two optical clock transitions in 171Yb+ and constraints on the time variation of fundamental constants. Phys Rev Lett (2014) 113:210801. doi:10.1103/PhysRevLett.113.210801
6. Kolkowitz S, Pikovski I, Langellier N, Lukin MD, Walsworth RL, Ye J. Gravitational wave detection with optical lattice atomic clocks. Phys Rev D (2016) 94:124043. doi:10.1103/PhysRevD.94.124043
7. Takamoto M, Ushijima I, Ohmae N, Yahagi T, Kokado K, Shinkai H, et al. Test of general relativity by a pair of transportable optical lattice clocks. Nat Photon (2020) 14:411–5. doi:10.1038/s41566-020-0619-8
8. Kessler T, Hagemann C, Grebing C, Legero T, Sterr U, Riehle F, et al. A sub-40-mhz-linewidth laser based on a silicon single-crystal optical cavity. Nat Photon (2012) 6:687–92. doi:10.1038/NPHOTON.2012.217
9. Matei DG, Legero T, Häfner S, Grebing C, Weyrich R, Zhang W, et al. 1.5μm lasers with sub-10 mhz linewidth. Phys Rev Lett (2017) 118:263202. doi:10.1103/PhysRevLett.118.263202
10. Cook S, Rosenband T, Leibrandt DR. Laser-frequency stabilization based on steady-state spectral-hole burning in Eu3+:Y2SiO5. Phys Rev Lett (2015) 114:253902. doi:10.1103/PhysRevLett.114.253902
11. Oswald R, Nevsky AY, Schiller S. Burning and reading ensembles of spectral holes by optical frequency combs: Demonstration in rare-earth-doped solids and application to laser frequency stabilization. Phys Rev A (Coll Park) (2021) 104:063111. doi:10.1103/PhysRevA.104.063111
12. Chen J. Active optical clock. Sci Bull (Beijing) (2009) 54:348–52. doi:10.1007/s11434-009-0073-y
13. Wang Y. Optical clocks based on stimulated emission radiation. Sci Bull (Beijing) (2009) 54:347. doi:10.1007/s11434-009-0064-z
14. Meiser D, Ye J, Carlson DR, Holland MJ. Prospects for a millihertz-linewidth laser. Phys Rev Lett (2009) 102:163601. doi:10.1103/PhysRevLett.102.163601
15. Norcia MA, Cline JRK, Muniz JA, Robinson JM, Hutson RB, Goban A, et al. Frequency measurements of superradiance from the strontium clock transition. Phys Rev X (2018) 8:021036. doi:10.1103/PhysRevX.8.021036
16. Laske T, Winter H, Hemmerich A. Pulse delay time statistics in a superradiant laser with calcium atoms. Phys Rev Lett (2019) 123:103601. doi:10.1103/PhysRevLett.123.103601
17. Schäffer SA, Tang M, Henriksen MR, Jørgensen AA, Christensen BTR, Thomsen JW. Lasing on a narrow transition in a cold thermal strontium ensemble. Phys Rev A (Coll Park) (2020) 101:013819. doi:10.1103/PhysRevA.101.013819
18. Liu H, Jäger SB, Yu X, Touzard S, Shankar A, Holland MJ, et al. Rugged mhz-linewidth superradiant laser driven by a hot atomic beam. Phys Rev Lett (2020) 125:253602. doi:10.1103/PhysRevLett.125.253602
19. Kazakov GA, Schumm T. Active optical frequency standard using sequential coupling of atomic ensembles. Phys Rev A (Coll Park) (2013) 87:013821. doi:10.1103/PhysRevA.87.013821
20. Shi T, Pan D, Chen J. Realization of phase locking in good-bad-cavity active optical clock. Opt Express (2019) 27:22040–52. doi:10.1364/OE.27.022040
21. Goldenberg HM, Kleppner D, Ramsey NF. Atomic hydrogen maser. Phys Rev Lett (1960) 5:361–2. doi:10.1103/PhysRevLett.5.361
22. Yu D, Chen J. Laser theory with finite atom-field interacting time. Phys Rev A (Coll Park) (2008) 78:013846. doi:10.1103/PhysRevA.78.013846
23. Yu D, Chen J. Four-level superradiant laser with full atomic cooperativity. Phys Rev A (Coll Park) (2010) 81:053809. doi:10.1103/PhysRevA.81.053809
24. Vasilyev AA, Savukov IM, Safronova MS, Berry HG. Measurement of the 6s − 7p transition probabilities in atomic cesium and a revised value for the weak charge QW. Phys Rev A (Coll Park) (2002) 66:020101. doi:10.1103/PhysRevA.66.020101
25. Shi T, Miao J, Pan D, Chen J. Optimization of pumping light for Cs four-level active optical clock. In: Joint conference of the IEEE international frequency control symposium (IEEE IFCS) and IEEE international symposium on applications of ferroelectrics. 19-23 July 2020, Keystone, CO, USA, IEEE (2020). 10.1109/IFCS-ISAF41089.2020.9234825.
26. Xu Z, Pan D, Zhuang W, Chen J-B. Experimental scheme of 633 nm and 1359 nm good-bad cavity dual-wavelength active optical frequency standard. Chin Phys Lett (2015) 32:083201. doi:10.1088/0256-307x/32/8/083201
27. Pan D, Xue X, Chen J. Detailed problems in cesium active optical clock. In: IEEE international frequency control symposium (IFCS), 09-12 May 2016, New Orleans, LA, USA, (2016).
28. Heavens OS. Radiative transition probabilities of the lower excited states of the alkali metals. J Opt Soc Am (1961) 51:1058–61. doi:10.1364/JOSA.51.001058
29. Yin B, Shay TM. Theoretical model for a faraday anomalous dispersion optical filter. Opt Lett (1991) 16:1617–9. doi:10.1364/OL.16.001617
30. Dressler ET, Laux AE, Billmers RI. Theory and experiment for the anomalous faraday effect in potassium. J Opt Soc Am B (1996) 13:1849–58. doi:10.1364/JOSAB.13.001849
31. Gilbert SL, Watts RN, Wieman CE. Hyperfine-structure measurement of the 7s state of cesium. Phys Rev A (Coll Park) (1983) 27:581–2. doi:10.1103/PhysRevA.27.581
32. Steck DA. Cesium D line data (2019). available online at revision 2.2.1 http://steck.us/alkalidataNovermber 21, 2019).
33. Bohnet JG, Chen Z, Weiner JM, Meiser D, Holland MJ, Thompson JK. A steady-state superradiant laser with less than one intracavity photon. Nature (2012) 484:78–81. doi:10.1038/nature10920
34. Kuppens SJM, van Exter MP, Woerdman JP. Quantum-limited linewidth of a bad-cavity laser. Phys Rev Lett (1994) 72:3815–8. doi:10.1103/PhysRevLett.72.3815
Keywords: bad-cavity limit, suppressed cavity-pulling effect, quantum-limited linewidth, Zeeman effect, beat-note spectrum, active optical frequency standard
Citation: Shi T, Miao J, Zhang J and Chen J (2022) Active optical clock lasing on the Cs 7S1/2-6P3/2 transition under a weak magnetic field. Front. Phys. 10:967255. doi: 10.3389/fphy.2022.967255
Received: 12 June 2022; Accepted: 18 July 2022;
Published: 12 August 2022.
Edited by:
Andrea Bertoldi, ParisTech Institut d’Optique Graduate School, FranceReviewed by:
Shayne Bennetts, University of Amsterdam, NetherlandsGeorgy Kazakov, Vienna University of Technology, Austria
Copyright © 2022 Shi, Miao, Zhang and Chen. This is an open-access article distributed under the terms of the Creative Commons Attribution License (CC BY). The use, distribution or reproduction in other forums is permitted, provided the original author(s) and the copyright owner(s) are credited and that the original publication in this journal is cited, in accordance with accepted academic practice. No use, distribution or reproduction is permitted which does not comply with these terms.
*Correspondence: Tiantian Shi, tts@pku.edu.cn