- 1Institute of Neuroscience and Medicine-1 (INM-1), Forschungszentrum Jülich, Jülich, Germany
- 2Department of Physics, School of Mathematics and Natural Sciences, Bergische Universität Wuppertal, Wuppertal, Germany
- 3Department of Neurology, Center for Movement Disorders and Neuromodulation, Medical Faculty, Heinrich-Heine University Düsseldorf, Düsseldorf, Germany
- 4Institute of Clinical Neuroscience and Medical Psychology, Medical Faculty, Heinrich-Heine University Düsseldorf, Düsseldorf, Germany
- 5C. and O. Vogt Institute for Brain Research, Medical Faculty, Heinrich-Heine University Düsseldorf, Düsseldorf, Germany
In recent years, the microscopy technology referred to as Polarized Light Imaging (3D-PLI) has successfully been established to study the brain’s nerve fiber architecture at the micrometer scale. The myelinated axons of the nervous tissue introduce optical birefringence that can be used to contrast nerve fibers and their tracts from each other. Beyond the generation of contrast, 3D-PLI renders the estimation of local fiber orientations possible. To do so, unstained histological brain sections of 70 μm thickness cut at a cryo-microtome were scanned in a polarimetric setup using rotating polarizing filter elements while keeping the sample unmoved. To address the fundamental question of brain connectivity, i. e., revealing the detailed organizational principles of the brain’s intricate neural networks, the tracing of fiber structures across volumes has to be performed at the microscale. This requires a sound basis for describing the in-plane and out-of-plane orientations of each potential fiber (axis) in each voxel, including information about the confidence level (uncertainty) of the orientation estimates. By this means, complex fiber constellations, e. g., at the white matter to gray matter transition zones or brain regions with low myelination (i. e., low birefringence signal), as can be found in the cerebral cortex, become quantifiable in a reliable manner. Unfortunately, this uncertainty information comes with the high computational price of their underlying Monte-Carlo sampling methods and the lack of a proper visualization. In the presented work, we propose a supervised machine learning approach to estimate the uncertainty of the inferred model parameters. It is shown that the parameter uncertainties strongly correlate with simple, physically explainable features derived from the signal strength. After fitting these correlations using a small sub-sample of the data, the uncertainties can be predicted for the remaining data set with high precision. This reduces the required computation time by more than two orders of magnitude. Additionally, a new visualization of the derived three-dimensional nerve fiber information, including the orientation uncertainty based on ellipsoids, is introduced. This technique makes the derived orientation uncertainty information visually interpretable.
1 Introduction
The centerpiece of human brain connectivity is the connectome-a comprehensive description of how neurons and brain regions are interconnected. It is the indispensable foundation for understanding how brain dynamics and function emerge from their underlying structural (neural) substrate [1, 2]. This general concept of the connectome was a key driver in the field of connectivity research in the last two decades. It has triggered impressive advancements in in-vivo and postmortem neuroimaging, in particular, Diffusion MRI (dMRI) [3–5], but also of light microscopic and electron microscopic techniques applicable to postmortem brain tissue, aiming for cross-validation of connectivity analysis results [6]. A major challenge for any imaging technique is that the human brain is a vastly complex organ built-up of about 86 billion neurons interacting in differently sized neural networks with each other. A neuron exhibits a slender projection, i. e., an axon that may be surrounded by myelin sheaths. Myelinated axons (here referred to as nerve fibers) do have calibers at the order of 1 μm [7] and transmit signals sometimes over millimeters or even centimeters [8].
Recently, label-free optical imaging techniques, such as polarization microscopy [9, 10], optical coherence tomography [11] and harmonic generation microscopy [12], have been adopted to visualize and trace nerve fibers in the brain. These techniques rely on intrinsic tissue contrasts sensed by the used techniques instead of classical staining [13, 14]. Another novel approach is clearing, i. e., rendering tissue transparent, after which the tissue is treated with fluorescent dyes and imaged with fluorescence microscopy [15–17]. Multi-Photon Fluorescent Microscopy has also been used for high-resolution in-depth scanning in regions of interest in histological brain sections [18–20]. While the mentioned techniques achieve (sub-)micrometer resolution, imaging neural structures at the nanoscale can only be provided by electron microscopy [21, 22]. However, most of these microscopic approaches are limited to small volumes and/or numbers of samples which prevents addressing the entire human brain in a reasonable time frame [6].
Three-Dimensional Polarized Light Imaging (3D-PLI [9, 10]) has emerged as a unique imaging technique capable of contrasting nerve fibers and fiber tracts in white and gray matter, quantifying their spatial courses connecting different brain regions, and covering serial whole-human brain sections at a few micrometer resolution. Polarization microscopy as a tool for connectivity analysis was elaborated in numerous studies on normal and pathologically impaired nervous tissue for more than a century [23, 24]. However, its application to histological brain sections and the reconstructions thereof aiming to compare with dMRI results experienced a considerable boost in the last decade [9, 10, 25–31].
Compared to other microscopic techniques, 3D-PLI has the distinct advantage of enabling the direct estimation of three-dimensional fiber orientation information in unstained brain sections. This is achieved by probing the orientation-dependent birefringence of myelinated nerve fibers using oblique polarimetric measurements [32]. The fiber orientation is estimated by fitting an effective biophysical model of the interaction of light with the specimen to the acquired measurement data pixel per pixel. The confidence in the inferred fiber orientation has to be investigated to avoid misinterpretation and identify potential methodical artifacts.
Uncertainty measures for nonlinear parametric models are typically obtained from Markov Chain Monte Carlo (MCMC) sampling [33–36]. Informally speaking, the goal of MCMC sampling is to reconstruct the full posterior probability distribution of the model parameters given the likelihood of the observed measurement data and prior knowledge by generating a representative sample of the distribution. Recently, MCMC sampling was applied to 3D-PLI, resulting in accurate maps of the uncertainties of in-plane fiber orientation, out-of-plane fiber orientation, and birefringence [37]. The huge drawback of MCMC sampling is its high computational cost as it requires thousands of samples per pixel which yields computation times of hundreds of core hours for single brain sections. This computational burden severely limits the applicability of MCMC for whole-brain analysis. Another difficulty regarding the uncertainty measures lies in the interpretation of the results: while the two-dimensional maps of the angular uncertainties, in principle, provide the derived information, fiber orientations are three-dimensional. Hence, a three-dimensional visualization that captures the full three-dimensional probability density of the fiber orientation is necessary to make the obtained data more interpretable. Therefore, this work’s contributions are twofold: we developed a strategy to estimate the parameter uncertainties based on a machine learning model. We introduced an intuitive visualization of three-dimensional fiber orientation uncertainty via ellipsoids.
The problem of excessive computation times for MCMC sampling also arises in dMRI analysis, where orientation uncertainty serves as an important prerequisite for probabilistic tractography algorithms [36]. Recently, GPU implementations have been presented to reduce the runtimes in DWI as the computations can be parallelized voxelwise [35, 38]. Still, exemplary resulting runtimes amount to approx. One hour for processing a brain volume of 410,000 voxels with the popular diffusion tensor model [35]. In 3D-PLI, one individual brain section can consist of millions of pixels at mesoscopic resolution and up to a billion pixels at microscopic resolution. Although the computation times for MCMC sampling in 3D-PLI and DWI per voxel are not the same, GPU acceleration alone is insufficient for whole brain processing in 3D-PLI. Bootstrapping approaches (like the wild bootstrap [39] or non-local bootstrap [40]) represent an alternative for the calculation of confidence measures. Still, they come with similar computational complexity as MCMC sampling as they typically require at least hundreds of iterations of resampling the measurement data and refitting the model [41]. For example, the bootstrap sample time alone of a SPARC phantom [42] measured with Mean Apparent Propagator MRI (MAP) [43] is still 0.4 h for 208 voxels on 40 CPU threads.
Instead, we propose learning the uncertainty from the data by examples. The assumption is that pixels with similar signal strengths and underlying nerve fiber properties for each brain section express similar uncertainties of the model parameters. We expect high confidence for strong signals, and for weak signals, we expect low confidence in the derived model parameters. Based on a machine learning model which relates features derived from the signal strength with the uncertainties of the biophysical parameters, these can be predicted instead of explicitly calculated via MCMC. The idea to use machine learning to predict the uncertainty of physical model parameters was already applied in different fields such as weather forecasting [44], hydrology [45, 46], power grid dynamics modeling [47] and fluid dynamics [48, 49]. In 3D-PLI, we found clear and physically explainable correlations between the parameter credible intervals and parameters derived from the birefringence properties of the tissue. A regression model fits these correlations for a few pixels. The trained model then predicts the credible intervals for the remaining majority of pixels.
A recent overview of visualization techniques for fiber orientation uncertainty is given in [50]. As 3D-PLI currently models one nerve fiber orientation per voxel, we focused on visualization techniques for this case. The most common method introduced in [41] utilizes a three-dimensional circular cone whose main axis is given by the fiber orientation and whose radius indicates the confidence of the orientation. The circularity implies that the underlying orientation uncertainty must be circularly symmetric. In histological imaging techniques such as 3D-PLI, the in-plane orientation can typically be derived with much higher confidence than the out-of-plane orientation. These differences are neglected by the visualization based on circular cones. In principle, cones with ellipsoidal base areas, as proposed in [51], can display an anisotropic fiber orientation probability. Yet, these still suffer from one fundamental disadvantage of cones: for very high angular uncertainty, the base area of the cones diverges to infinity. Hence, regions of high orientation uncertainty are intrinsically hard to display in a visually comprehensible way using cones. As an alternative, we propose a visualization with ellipsoids which is well known from Diffusion Tensor Imaging [52, 53]. Ellipsoids naturally allow elliptically symmetric orientation probability densities via the ellipsoids’ two semi-axes and become spherical in the case of diverging orientation uncertainty. While ellipsoidal visualizations are not new, fiber orientation uncertainty in 3D-PLI represents a valuable new application for them.
This publication is organized as follows: We give a short review of 3D-PLI and showcase the relevant correlations between the derived parameters. Afterward, a regression model to predict the uncertainty measures and the construction of the ellipsoidal visualization for the orientation uncertainty is presented. We test the developed machine learning approach for different training data sizes on experimental data. Exemplary results for the ellipsoidal visualization are shown for human brain data. Finally, the results are critically discussed, and directions for future research are proposed.
2 Methods
2.1 Brain preparation
Brain preparation is a fundamental issue for polarization microscopy as the organization of the lipid bilayers composing the myelin sheaths have to be preserved. The examined brain was removed within 24 h after the donor’s death. The right hemisphere was fixed in 4% buffered formaldehyde solution for 15 days to prevent tissue degeneration. After immersion in a 20%, solution of glycerin with dimethyl sulfoxide (DMSO) for cryoprotection the brain was frozen at a temperature of −80°C. The sectioning resulted in 843 coronal sections of 70 μm thickness (Polycut CM 3500, Leica, Germany), which is a factor of 3–4 thicker than a brain section suitable for classical histological cell or fiber staining [54]. However, polarization-based imaging imposes no fundamental restriction on using thinner sections, but cryo-sectioning and handling of large-area sections intended to be 3D-reconstructed led to this compromise of section thickness.
The sections were mounted on glass slides, immersed in a 20% solution of glycerin to avoid dehydration, and sealed by cover-slips. For this study, randomly selected sections were scanned at 64 × 64 μm pixel size in one planar and four tilting (i. e., oblique) positions [32]. The postmortem human tissue sample used for this study was acquired in accordance with the local ethics committee of our partner university at Heinrich Heine University Düsseldorf. Written, informed consent of the subject is available.
2.2 Correlations between 3D-PLI parameters
The basic principle of 3D-PLI is to generate polarized light, pass it through a thin unstained histological brain section, and measure alterations of the polarization state of light using a circular analyzer and a CCD camera [10]. Thus, contrast may be generated between individual fibers, fiber tracts, and other tissue components, ultimately giving access to the orientation of interacting birefringent/fibrous structures.
During the measurement, the filters are rotated stepwise, and the camera records an image at each rotation angle ρ. By this means, a series of intrinsically registered images is generated, which allows to extract (of sinusoidal) light intensity profiles for each pixel across the stack. An effective biophysical model describes myelinated nerve fibers as uniaxial birefringent material whose optical axis yields the dominant nerve fiber orientation [10]. The Jones calculus [55] finally allows to derive a function I(ρ) that describes the obtained light intensity profiles:
where IT reflects the light extinction due to scattering and absorption (referred to as transmittance), φ ∈ [0, π) the in-plane nerve fiber orientation (referred to as direction) (Figure 1) and δ the phase retardance induced by the birefringent nerve fiber (retardation [9, 10]. The retardation depends on setup (light source wavelength λ) and material specific characteristics (section thickness ts, relative thickness t, birefringence strength Δn, and fiber inclination angle
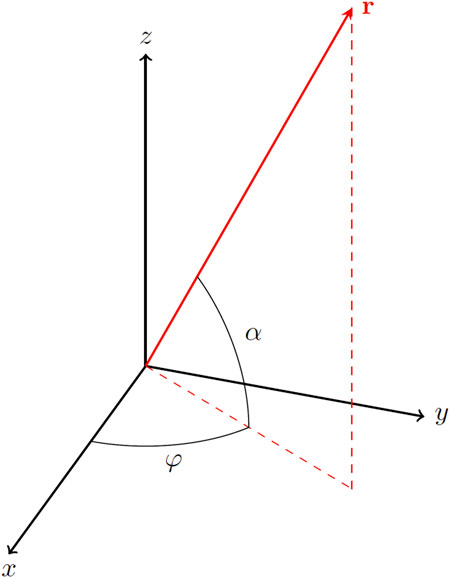
FIGURE 1. 3D-PLI coordinate system with fiber orientation vector r, in-plane angle φ (direction) and out-of-plane angle α (inclination).
with
The relative thickness t was introduced by Axer et al. [10] to measure the combined effect of birefringence Δn, wavelength λ and section thickness ts. A detailed derivation of Eq. 2 can be found in [56]. As t is directly proportional to the birefringence Δn, it can serve as a measure of birefringence and, indirectly, as a measure of myelin density. The parameters of interest are the angular orientations φ and α and birefringence parameter t. So every voxel of the measured specimen is assigned the parameter tuple (φ, α, t), while the two angles build a three-dimensional vector indicating the orientation of the nerve fibers. These vectors are typically (RGB or HSV) color-coded, as shown in Figure 2, top left.
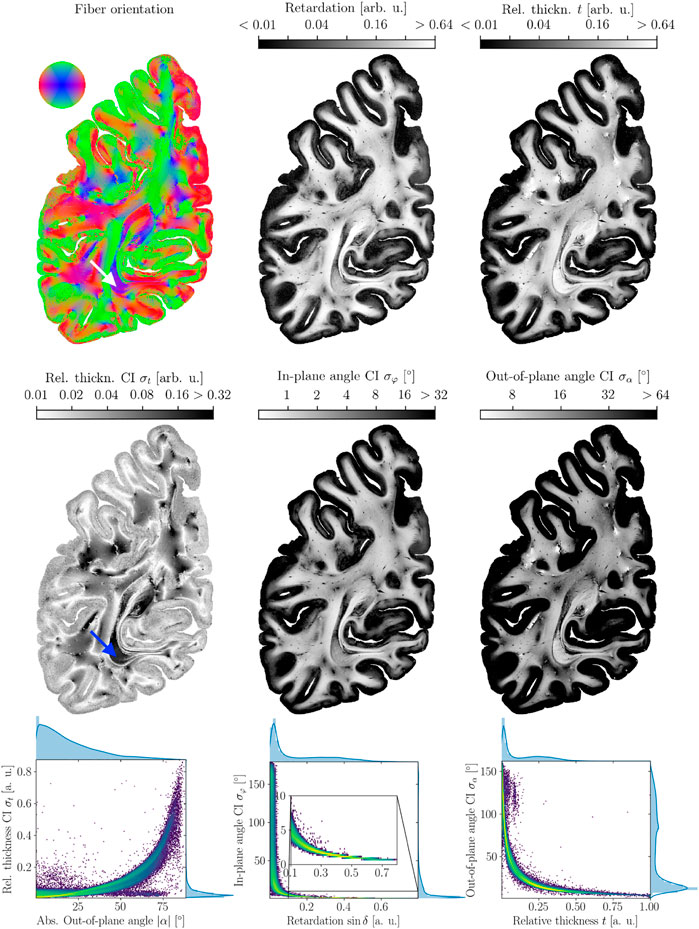
FIGURE 2. 3D-PLI modalities and their credible intervals. Top row: maps of best-fit parameters. From left to right: Fiber Orientation map, retardation map, relative thickness map. Contrary to typical visualizations in dMRI, the brightness of the FOM was not scaled to emphasize the arbitrary orientations inferred for vanishing signals in the cortex. Middle row: credible interval maps. From left to right: relative thickness credible interval, direction angle credible interval, inclination angle credible interval. Note the inverted grayscale color bar: areas with high confidence and low credible intervals, respectively, are brighter than areas of low confidence. All scalar maps are log scaled. The arrows (white and blue, upper and middle row left) point out the stratum sagittal, which contains dominantly strongly inclined nerve fibers concerning the coronal sectioning plane. Overall, a correlation between the z-component which manifests in blue coloring in the FOM, and σt can be observed. For the angular credible intervals, correlations exist between the retardation and the in-plane orientation confidence σφ (middle column) and relative thickness t and out-of-plane orientation confidence σα (right column). Bottom row: correlations between the parameters visualized as log scaled two-dimensional histograms.
The most probable parameter set is estimated by fitting the model to data taken from additional oblique views of the sample, which induce experimentally defined small variations to the signal [32]. The primary source of uncertainty in the inferred parameters is photon detection noise which can be modeled as heteroscedastic Gaussian noise [32, 37]. Confidence measures are then obtained via MCMC sampling. From the empirical distribution of the sample’s highest posterior density (HPD) intervals, the shortest intervals, which contain a certain amount of the probability mass, are computed and serve as credible intervals (CIs). These CIs represent the analogon to confidence intervals in Bayesian statistics. In [37], 95% highest posterior density intervals were obtained from samples computed by an ensemble MCMC algorithm [57]. The modality maps and their credible intervals are shown for one brain section in Figure 2. All plots in this paper were created using the Python packages matplotlib and seaborn [58, 59].
From physical intuition, it can be assumed that the confidence in the model parameters increases with the signal strength. In our case, the signal strength is given by the retardation value, which determines the relative amplitude of the sinusoidal light intensity profile. This is further illustrated in Figure 3. It depicts two simulated sinusoidal signals Isim according to Eq. 1 with the same offset IT = 2000 and phase φ = 45° but different relative amplitudes sampled in steps of ρ = 20°. Here, the relative amplitude is defined as the difference between maximum Imax and the average IT of the signal divided by the average
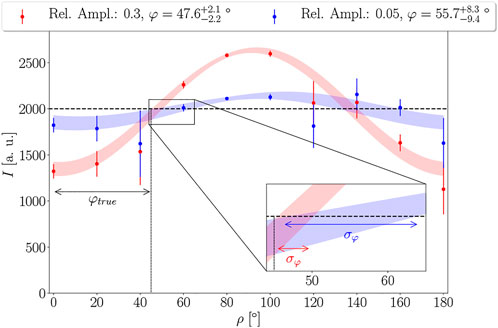
FIGURE 3. Illustration of the effect of the amplitude of a sinusoidal signal on the uncertainty of the extracted phase. Both datasets were generated with the same offset of IT = 2000, phase φ = 45°, and noise levels. The phase can be inferred with higher accuracy and a lower degree of uncertainty for a higher amplitude. Shaded areas represent 95% prediction intervals for the sinusoidal model.
The same amount of Gaussian noise
For 3D-PLI, the parameter estimation is more complex than in this simple example, as the derivation of relative thickness and fiber inclination exploits the differences between the sinusoidal signals from different oblique views [32]. Also, the retardation or relative amplitude, respectively, depends on the out-of-plane orientation and the birefringence strength by Eq. 2. This equation means that the amplitude increases non-linearly with increasing birefringence strength and decreases non-linearly with the fiber inclination. Based on these relationships, the model parameters are signal strength measures, and correlations between their maximum likelihood estimates and the credible intervals can be investigated.
In the modality maps (cf. Figure 2), it can already be seen that for vanishing birefringence and amplitude in the cortex, the angular credible intervals increase strongly. The credible interval for the relative thickness rises with the z − component of the fiber orientation, which can be seen in the stratum sagittal (cf. arrows). These correlations, which are visible by the eye, are confirmed in Figure 2 (bottom row). Besides ambiguity for very low retardation values, the in-plane credible interval σφ decreases with increasing retardation sin δ. In the same way, the out-of-plane angle credible interval σα decreases with increasing relative thickness t. For the relative thickness, a monotonic increase of the credible interval σt with the absolute out-of-plane angle |α| = | arcsin(z)| for all but very low values of σt can be observed. The next section introduces a regression model that fits these correlations and later predicts the credible intervals for previously unseen data.
2.3 Uncertainty prediction
The uncertainty prediction works in three steps:
• Training data generation: Compute credible intervals via MCMC for a small number of training pixels
• Training: Fit a regression model to the computed training data
• Prediction: predict credible intervals for the remaining pixels with the trained model
Keeping the number of training pixels small is necessary as computing credible intervals for training via MCMC is computationally expensive. We decided to process each brain section individually as the modality maps of retardation, and relative thickness express significant variations between sections. These variations originate from small but practically unavoidable differences during the histological sectioning and mounting process of the individual sections [60]. Fitting the correlations represents a one-dimensional nonlinear regression problem for which a huge number of potential solutions are available [61, 62]. Still, two factors limit the choice of regression models.
First, extensive manual hyperparameter tuning for each section is not feasible for batch processing of a large number of sections. Therefore the model must be able to perform automatic and reliable hyperparameter selection. Second, not all possible models are physically plausible (cf. Figure 4). Especially, as the correlations are ambiguous in parts of the parameter space (consider e. g. the variety of in-plane angle credible intervals for very low retardation values in Figure 2), adding constraints is key for a useful predictive model. Most importantly, the relationship between signal strength and parameter credible interval must be strictly monotonic to avoid ambiguities. Furthermore, as the employed biophysical model is an imperfect model of the data acquired during the 3D-PLI measurement, an unknown lower bound must exist for the parameter uncertainty, even for very strong signals. Therefore, the model which relates signal strength and parameter uncertainty has to obey asymptotic behavior. While specifying a lower bound for a flexible regression model is not straightforward, the asymptotic property also requires that the credible interval decrease faster for small signal strengths than for high ones. The regression model must be mathematically convex (formal proof in App. A). A convex and monotonic model ensures asymptotic behavior and avoids counterintuitive step-like functions (cf. Arrows in Figure 4). As a side effect, the convexity constraint also suppresses overfitting. A flexible regression model which allows enforcing such shape constraints, as well as reliable hyperparameter selection, is the Generalized Additive Model (GAM) [63].
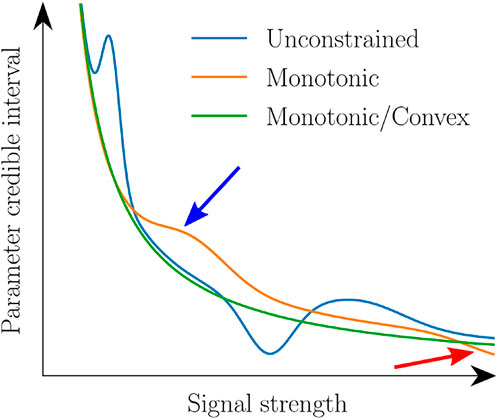
FIGURE 4. Comparison of possible regression models for predicting a model parameter credible interval as a function of the signal strength. An unconstrained model (blue) allows an ambiguous relationship that potentially predicts the same credible interval for different signal strengths. A monotonic model (orange) resolves this ambiguity but does not ensure that the credible interval decreases faster for smaller than higher signal strength. This can result in almost step-like functions (cf. Blue arrow) and nonasymptotic behavior (red arrow). These issues can again be avoided by functions that are both monotonic and convex (green).
2.3.1 A short introduction to generalized additive models
Generalized Additive Models (GAMs) were developed by Trevor Hastie and Robert Tibshirani and were published in 1986 in the same-named article [64]. The basic idea of a GAM is to cover non-linear relationships in an additive regression model. This approach is desirable because we can keep basic regression estimation of the form E (y|X) = α + βX and easy interpretability. Because of that, GAMs are used in a wide area of research interest like genetics, epidemiology, molecular biology, and medicine [65]. The principle of the method is substituting the linear function term X with a flexible function f(X) which is defined by a sum of splines
with the so-called basis functions B and the coefficients β. The coefficients β can be considered the height of the splines. With this representation, a property like the monotonicity of f(X) translates into ordered entries of the coefficient vector. To incorporate prior knowledge into the regression model, Bollaerts et al. proposed to use a (symmetric) penalty on the second-order differences of the coefficients to ensure smoothness and asymmetric penalties on first-order differences and second-order differences to favor monotonicity respectively curvature [66]. We get the optimization problem
with the intercept α, the penalty parameters λ (smoothness) and k (monotonicity and curvature), the difference operators Δ1 and Δ2, and the indicator variables uj and vj. The difference operators are defined as Δ1βj = βj − βj−1 and Δ2βj = βj − 2βj−1 + βj−2. The indicator variables uj and vj for the monotonic increasing respectively convex case are defined by
The parameters α and β are then estimated by a penalized iteratively re-weighed least squares (P-IRLS) scheme [67]. The penalty parameter k is set to a large number (k = 109) to guarantee the given monotonicity and curvature. The smoothing parameter λ represents a hyperparameter of the model and cannot be predefined. A grid search is employed to find the model (λ respectively) with the lowest generalized cross-validation (GCV) score to choose the model which generalizes the best [68]. In this work, we use the python package PyGAM [69] as an implementation of GAMs in Python.
2.3.2 Model training
We can observe a monotonic and convex behavior (cf. Figure 2) by looking at the relationship between the modalities and the credible intervals. We implement three independent learning procedures and choose Y and X as in Table 1.

TABLE 1. Table of target (Y) and predictor (X) variables with assumed constraints as they are observed from Figure 2.
2.3.2.1 Training dataset generation
As the distributions of the predictor variables are strongly skewed, random sampling would result in oversampling and undersampling in different regions of the parameter space. This potentially causes overfitting in oversampled and underfitting in undersampled areas. To cope with this issue, we implemented an equidistant sampling of the parameter space to ensure that all samples have the same influence on the regression model. The equidistant samples are found by computing a grid of N equidistant points spanning the entire parameter space and picking the closest data point to each grid point. As the three uncertainty measures are predicted by different modalities, these data points are found individually for each modality (retardation, inclination, relative thickness). The selected data samples are then used to calculate the related target variables Y, the uncertainties, via MCMC sampling.
2.3.2.2 Preprocessing and number of basis functions
Because our data distribution p(Y|X) is skewed and the variable to be estimated is heteroscedastic, we perform a log1p-transform (f(10) = log (x + 1)) on both axes to get rid of the high variance of the prediction variable for small values of the predictor variable and also adjust the slope of the variable. A steep function would require a higher number q of basis functions, increasing the risk of overfitting. For the number of basis functions, we choose q = 20 to have enough flexibility in the model and to guarantee enough freedom when fitting with strong constraints.
2.4 Model evaluation
2.4.1 Dataset description
We chose 20 randomly selected brain sections to test our developed learning procedure and to ensure its robustness. The sections were obtained from a data set of 230 coronal sections of a right human hemisphere, which were initially described in [32] (see Section 2.1). For all sections, maps of fiber orientation, retardation, and relative thickness were computed as described in [32]. Finally, ground truth credible intervals were calculated for the entire sections using MCMC sampling [37].
2.4.2 Evaluation metrics
We tested different training sample sizes N = 200, 400, 800, 1,200, 1,600, 2,400, and 3,200 for the uncertainty prediction to find the minimal training sample size required which achieves an acceptable prediction error. The predictive performance was evaluated based on the distributions of the prediction error and visual inspection of maps of the prediction error. Additionally, the training samples and the GAM fit were plotted to crosscheck against over- or underfitting. Further information about the quality of the fit was obtained from the effective degrees of freedom and the explained deviance of the fitted model.
2.5 Fiber orientation uncertainty visualization
Using triaxial ellipsoids, both the current fiber orientation and the uncertainties of the respective angles can be observed (cf. Figure 5). The main axis of the ellipsoid points in the direction of the fiber orientation and has the maximal length of 1. The two semi-axes are scaled according to the credible interval of the direction angles φ and α using a linear function σφ/π or σα/π. This ensures that the ellipsoid becomes a sphere for the maximal angular uncertainties of σα = σφ = 180°. Figure 5B shows the respective shapes of the ellipsoid with increasing uncertainty (from linear, when both angular credible intervals are close to 0°, to spherical, when both angular credible intervals are close to 180°).
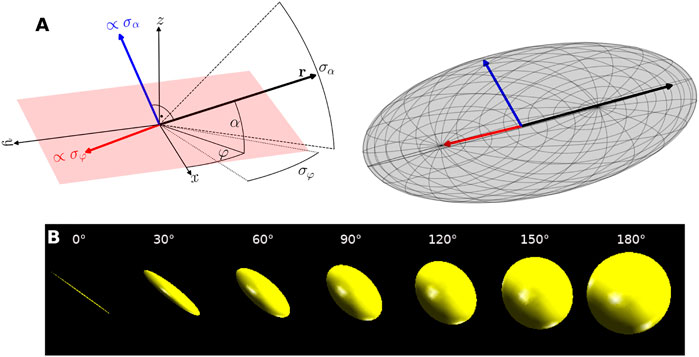
FIGURE 5. Visualization of orientation uncertainty by ellipsoids. (A) ellipsoid construction. Left: a sketch of the maximum likelihood fiber orientation r given by in-plane angle φ and out-of-plane angle α. Right: resulting orientation uncertainty ellipsoid. The main axis is given by r while the semi-axes are scaled by the angular credible intervals σα and σφ. Fiber parameters: α = φ = 30°, σα = 40°, σφ = 30°. (B) Ellipsoids for varying orientation uncertainty. For small orientation uncertainty the ellipsoid appears linear (left, σα = σφ = 0°). With increasing uncertainty the representation becomes more spherical (right, σα = σφ = 180°).
For the visualization of the ellipsoids, a unit sphere is discretely sampled with a fixed number of longitudes and latitudes. The points on the surface of the sphere are multiplied by the radius r = (σα/π, σφ/π, 1) to determine the lengths of the semi-axes and then aligned by rotation in fiber orientation. With OpenGL, these points are represented as an illuminated triangle mesh. The RGB color of the ellipsoids is obtained from the fiber orientation, with red representing the x-axis, green the y-axis, and blue the z-axis.
The uncertainty visualization was developed in C++ and OpenGL and embedded in the software suite PLIVis [70].
3 Results
3.1 Uncertainty prediction
3.1.1 Training sample size evaluation
A scatterplot of the out-of-plane angle uncertainty σα vs its predictor variable t and the GAM fit for one exemplary brain section is depicted in Figure 6 for different sample sizes (N = 200, 400, 800). It can be observed that the small sample size results in overfitting of the data because the prediction line lies too close to the data and does not satisfy our desired smooth curvature (see circled area). The other fits for the sample sizes N = 400 and 800 satisfy this condition. This outcome reflects itself in the map of the signed prediction error. The prediction for N = 400 and 800 shows less overestimating the orientation uncertainty in the cortex (arrow 1) and white-matter to gray matter transition (arrow 2). White matter regions show only minor uncertainty prediction errors. Fiber crossing constitutes an exception (arrow 3). The GAM fits and prediction errors for the in-plane angle uncertainty σφ and relative thickness uncertainty σt shown in App. B Figures 1, 2 express a similar behavior. Also, the cumulative densities of the prediction errors are very similar for the different sample sizes (cf. App. B Figure 3) for this exemplary brain section. To assess the prediction accuracy across different brain sections, the median absolute prediction error was computed for the different training sample sizes (cf. Figure 7) for all investigated sections. There is a clear difference between N = 200, 400 and N ≥ 800, but no further improvement is visible for bigger sample sizes.
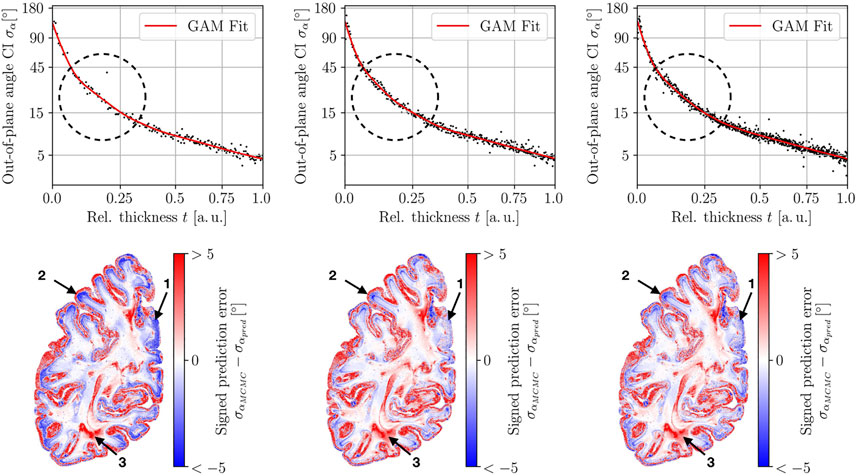
FIGURE 6. Evaluation of three different training data sizes for predicting the out-of-plane angle uncertainty for one brain section. The tested training sample sizes are 200, 400, and 800 (left to right). Top row: Training data and GAM fit. Bottom row: Map of the uncertainty prediction error. The circle indicates a region where the fitted GAM model becomes smoother for increasing sample size. The prediction error decreases with increasing training samples (arrows 1/2) for some areas at the boundary of white matter and cortex. While white matter mostly expresses small prediction errors, still regions of high prediction errors can be observed in fiber crossing regions (arrow 3).
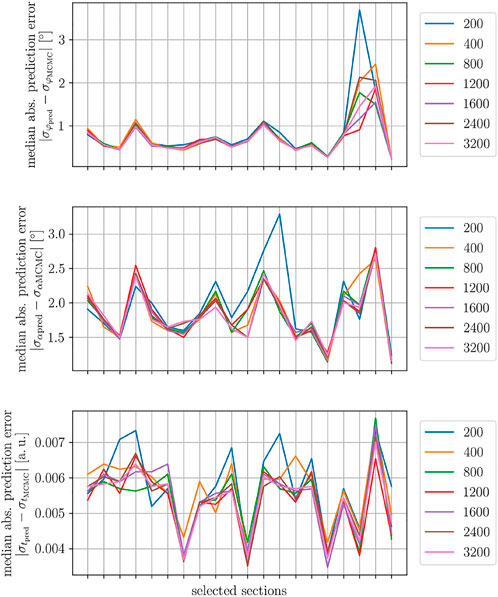
FIGURE 7. Evaluation of different training data sizes. The three plots depict the median absolute prediction error for 20 selected brain sections. Top: In-plane angle uncertainty prediction error. Middle: Out-of-plane angle uncertainty prediction error. Bottom: Relative thickness uncertainty prediction error.
3.1.2 Comparison of all predictions
In Figure 8, we show a complete evaluation of the GAM procedure for in-plane angle uncertainty, out-of-plane angle uncertainty, and relative thickness uncertainty. The fits (first row) are smooth for every uncertainty prediction and show the desired monotonic and convex behavior. Furthermore, the 2D-histograms (second row) of prediction vs ground truth show a good agreement for every modality. The cumulative histogram of the absolute prediction error within white matter (third row) shows the best result for the in-plane angle uncertainty: for more than 90% of white matter pixels, the absolute error is smaller than 2°. While the error is higher for the out-of-plane angle uncertainty, still approx. 80% of white matter pixels express a prediction error smaller than 2°. In the case of the relative thickness uncertainty, for more than 90% of the pixels, a prediction error smaller than 0.02 was found. These results can also be observed in the prediction error maps (fourth row), where white matter regions dominantly express small errors outside of crossing regions. Higher errors occur in cortical areas.
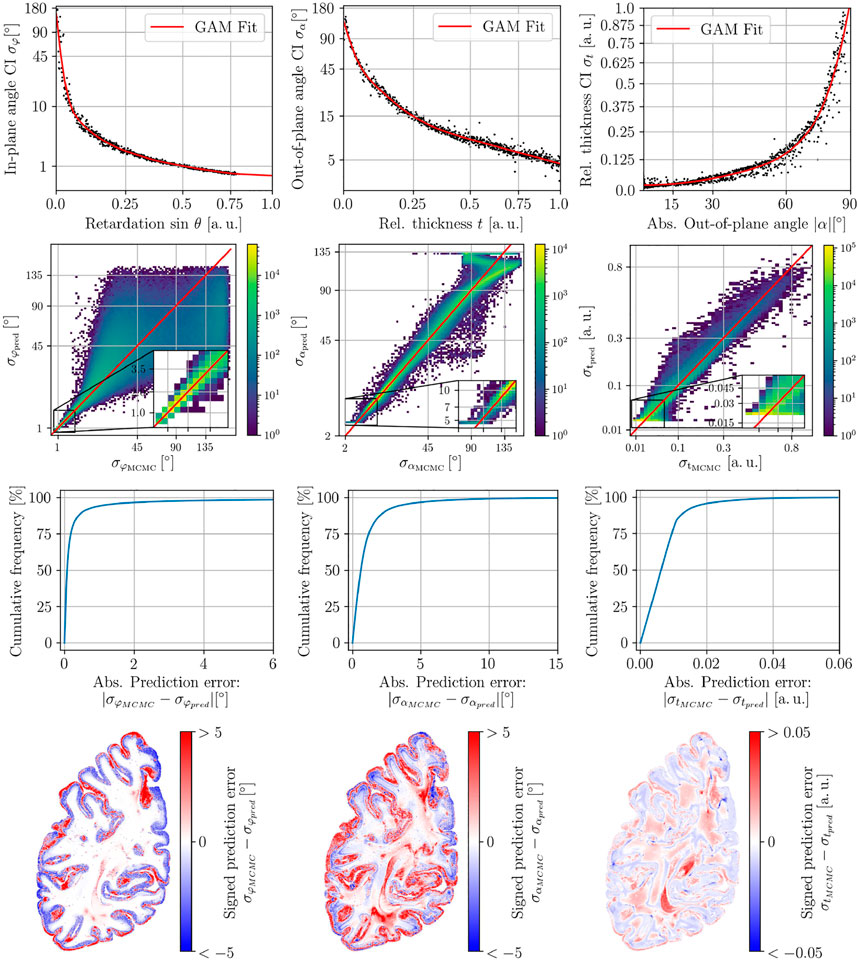
FIGURE 8. Collected evaluation of the three uncertainty predictions for one selected section with N = 800 samples. Left column: In-plane angle uncertainty. Central Column: Out-of-plane angle uncertainty. Right Column: relative thickness uncertainty. From top to bottom: 1.Training samples and fitted GAM model. 2. Prediction vs Ground truth (MCMC sampling). 3. Cumulative Histogram of the absolute prediction error within the white matter. 4. Maps of the signed prediction error.
Further information about the fit quality is available from the explained deviance and the effective degrees of freedom (cf. App. B Figure 4). The explained deviance is higher than 95% for all three fits. The effective degrees of freedom lies between 7 and 15 due to the constraints.
3.1.3 Computation time
The computation times for training data generation via MCMC for different sample sizes are shown in Table 2 (for implementation and hardware details, see App. C). Whereas MCMC sampling for the whole brain section consumes 300 core hours, it reduces to a few minutes using the training sample sizes tested in this work. The computation time for fitting the GAMs and predicting the remaining pixels amounts to approx. 10 s.
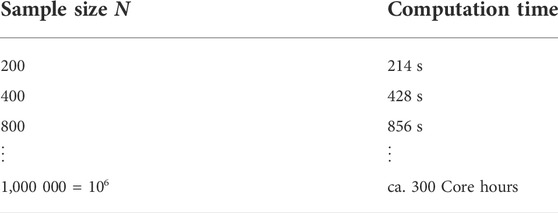
TABLE 2. Computation time for different training sample sizes N. The first 3 N represent the computation time with the presented GAM procedure and the last row N represent the order of magnitude of the computation time needed for MCMC sampling on a whole brain section.
3.2 Orientation confidence visualization
Visualizing the uncertainty ellipsoids immediately and intuitively reveals regions with higher uncertainty.
In Figure 9 details of a human hemisphere are visualized with ellipsoids. White matter is dominated by linear ellipsoids, indicating very high orientation confidence (compare Figure 5). Larger uncertainties are found in areas where the signal is likely superimposed, such as crossings (Figure 9 left). Spherical ellipsoids and thus low orientation confidence can also be found in the transition zone from white to gray matter and at the border of the cortex (Figure 9 right). The uncertainty ellipsoids also show regions with different confidence levels of the individual angles, which are represented by planar ellipsoids (cf. Figure 10).
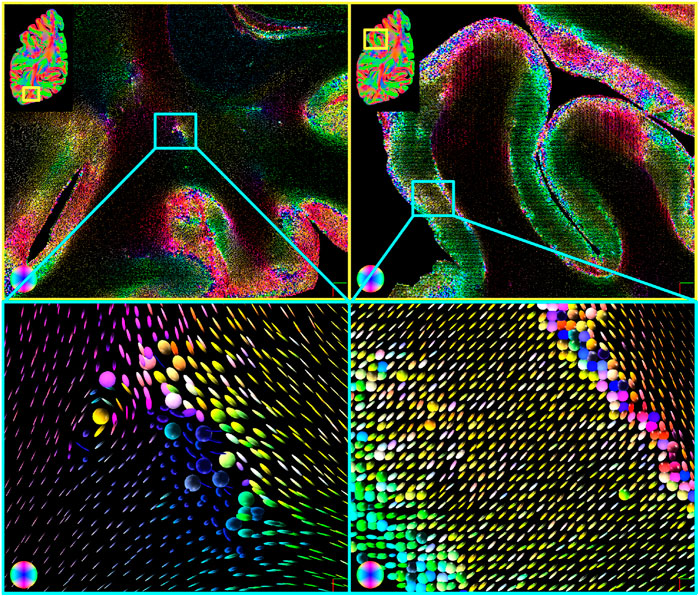
FIGURE 9. Fiber orientation uncertainty ellipsoids for human brain data. The color of the ellipsoids corresponds to an RGB color coding of their principal fiber orientation. Using the ellipsoids, regions with greater uncertainty in the signal can be intuitively identified (top). These regions are located, for example, in regions of fiber crossings (bottom left) or at the border from white to gray matter and in the cortex (bottom right). Very slim ellipsoids characterize white matter.
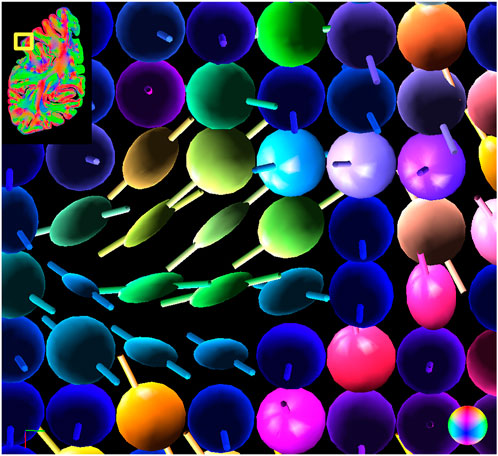
FIGURE 10. Next to spherical ellipsoids, planar ellipsoids are found in the cortex, indicating high confidence in one angle and low confidence in the other. In addition to the ellipsoids, the most likely fiber orientations are visualized as small sticks to underline the flat shapes.
4 Discussion
We proposed a new strategy to reduce the excessive computation times for uncertainty estimation. It is based on a physically motivated machine learning model which predicts the uncertainty measures from features derived from the strength of the physical signal. To our knowledge, this represents the first machine learning-based method for orientation uncertainty computation in neuroimaging. We expect this approach to be applicable in other fields, such as dMRI, where the anisotropy of the diffusion signal is a strong predictor for the orientation uncertainty [41, 51] as well. Especially microstructural models could benefit from a learning-based estimation of parameter credible intervals as they are computationally very expensive [35, 38].
Different training data sizes were evaluated based on the median absolute prediction error. It was found that the prediction accuracy did not improve for more than Nmin = 800 samples. Using this number of samples per predictor variable, MCMC sampling only has to be applied to 3 ⋅ Nmin = 2.400 pixels, independent of the size of the investigated brain section. Furthermore, the computation time for training the GAM model and predicting the uncertainty maps is negligible compared to the training data generation via MCMC. This reduces the computation times by a factor of Ntotal/Nmin for a total number of pixels Ntotal independent of the employed hardware. For the 20 sections chosen for the predictive model’s evaluation, the number of tissue pixels varies between approx. 200,000 and 1,000,000 pixels, the speedup factor thus ranges between ca. 100 and 400. Such small computation times enable the processing of complete brain sections of millions of pixels within minutes using a small CPU cluster. A GPU-based implementation of MCMC sampling could potentially further reduce the training time to several seconds. A GPU implementation of the fiber orientation fitting algorithm already demonstrated the high potential reduction in computation time compared to a CPU-based implementation in 3D-PLI [71].
The evaluation proved a very high accuracy of the predictive model for white matter regions, especially the in-plane orientation credible interval could be predicted with a very small error. For gray matter regions, higher prediction errors were found. It has to be noted that the credible intervals computed by MCMC for cortical areas are not as accurate as in white matter. In [37], studies on synthetic data showed that the credible intervals are often underestimated for vanishing birefringence. The measured light intensity profile resembles a constant function with random noise for vanishing birefringence and fiber crossings. This makes it hard to estimate correct, credible intervals for MCMC algorithms [72]. Another consequence is that the relationship between signal strength and uncertainty parameters becomes ambiguous for vanishing signals. In that sense, the MCMC results, which serve as training data, cannot be treated as reliable ground truth in gray matter regions. Future studies should investigate if it is possible to train two separate models for gray and white matter, respectively, and test if other MCMC algorithms achieve a better estimation of the parameter uncertainties for cortical areas [72].
One obvious pitfall of the developed learning approach is that the predictors are afflicted with non-negligible uncertainty. While the retardation given by the relative amplitude of the sinusoidal light intensity can be derived with very high precision, this does not hold for inclination and relative thickness. Taking the uncertainty of the predictors into account, as well as interactions between inclination and the relative thickness, could potentially improve the accuracy of the uncertainty prediction. Another potential improvement lies in the loss function: the utilized L2 loss is computationally efficient but sensitive to outliers and could be replaced by more robust GAM estimation techniques [68, 73, 74]. This might improve the stability of the fit for very weak signals.
For orientation confidence, the derived angular uncertainties were incorporated into an intuitive ellipsoidal visualization. Whereas ellipsoidal visualizations have been available in DWI for a long time, they provide significant new information in 3D-PLI: they enable easy identification of areas of high and low orientation confidence in three-dimensional visualizations of 3D-PLI connectome data for the first time. This represents a significant step forward for future anatomical studies based on 3D-PLI, which are prone to misinterpretations without this information. In the future, visualizations based on less ambiguous superquadrics than ellipsoids could be employed [75, 76].
This study was limited to mesoscale data acquired at 64 μm × 64 μm with a section thickness of 70 μm, constrained by the resolution of the available polarimetric setup enabling oblique scans. Given typical fiber calibers of 1 μm, there is a certain likelihood to measure a mixture of fibers with different courses within a voxel, leading to a misinterpretation of the fiber orientation. This is caused by the used effective physical model that only provides an estimate of one fiber orientation vector per voxel. A new beam tilting polarizing microscope is currently under construction which will allow us to image the brain sections from different views at 1.8 μm (i. e., at axonal scales) in the near future. Together with generating smaller sections, we will benefit from the smaller voxel sizes in terms of partial volume effects due to less nerve fibers comprised in white matter regions and better distinction of individual fibers in cortical brain regions. In a first approximation, we also assumed that fiber composition (e. g., myelination) is similar for all fibers. While this assumption appears to be valid in many cases of normal brain tissue, a degenerative disease alters the distribution of myelin and fibers in general in the effected brain regions. First scans of myelin degenerated brain sections showed a strong decrease in retardation (i. e., birefringence strength) as compared to normal controls which at least results in an increase of uncertainty in our analysis. However, future studies urge for multi-modal imaging of the same tissue to enable cross-validation and developing learning strategies able to adapt to individual tissue properties. Costantini et al. [77] developed a protocol to enhance autofluorescence of myelinated axons in brain sections prepared for 3D-PLI. This opened up the possibility to visualize nerve fibers and their myelin content within a brain section using Two-Photon Fluorescence Microscopy, for example. Furthermore, anisotropic tissue properties are not limited to retardance only [78, 79]. Certain anatomical structures are for example sensitive to polarization-dependent attenuation as in Diattenuation Imaging [80]. For a complete picture, multi-modal imaging in form of combining 3D-PLI with Müller [81] and Stokes polarimetry [82] can also be taken into account.
A fundamental challenge of multi-modal approaches, in addition to the tissue preparation required for the different measurements, is the alignment of the (often complementary) datasets across the scales from millimeters (provided by dMRI) to nanometers (electron microscopy) which is subject of current research (e. g. [83]). An important aspect in this context is the anatomical localization of the studied tissue (sub-)sample with respect to the entire human brain. 3D-PLI is well suited to bridge the gap between the extreme resolutions as it is able to provide both information about nerve fibers and their tracts (e. g., orientations and their distributions) similar to dMRI at whole brain level and local microstructural characteristics revealed at even higher resolution showing more details by fluorescence or electron microscopy. An important step for the alignment is the detection of mutual features in the different modalities, such as anatomical landmarks (e. g., vasculature). Obviously, imaging the same brain tissue or sub-samples thereof should be a key goal in future multi-scale connectome studies.
The machine learning approach presented here is an essential step to provide quantitative analysis of 3D-PLI scaled to fiber orientation analysis for whole human brains, keeping the computational demands reasonably low. MCMC sampling would have to be applied to billions of pixels for thousands of individual brain sections. In this light, it can be concluded that the concepts introduced in this paper pave the way towards the human connectome at the microscale.
Data availability statement
The dataset analyzed during the study is available in the ‘Replication Data for: Fast data-driven computation and intuitive visualization of fiber orientation uncertainty in 3D-Polarized Light Imaging’ repository, https://doi.org/10.26165/JUELICH-DATA/2C1HTE.
Ethics statement
The post-mortem human tissue sample used for this study was acquired in accordance with the local ethic committee of our partner university at Heinrich Heine University Düsseldorf. As confirmed by the ethics committee, post-mortem human brain studies do not need any additional approval if written informed consent of the subject is available. For the research carried out here, this consent is available.
Author contributions
DS: conceptualization, methodology, formal analysis, validation, visualization, writing, discussion. KB: methodology, software, validation, formal analysis, visualization, writing, discussion. NS: methodology, software, visualization, writing, discussion. MM: provided the brain sample and anatomical interpretations, writing, and discussion. KA: funding acquisition, project administration, writing, discussion. MA: supervision, project administration, writing, discussion.
Funding
This project has received funding from the European Union’s Horizon 2020 Framework Programm for Research and Innovation under the Specific Grant Agreement No. 945539 (Human Brain Project SGA3). The study has also been partially funded by Helmholtz Association’s Initiative and Networking Fund through the Helmholtz International BigBrain Analytics and Learning Laboratory (HIBALL) under the Helmholtz International Lab grant agreement InterLabs-0015.
Acknowledgments
The authors gratefully acknowledge the computing time granted through JARA on the supercomputer JURECA [84] at Forschungszentrum Jülich.
Conflict of interest
The authors declare that the research was conducted in the absence of any commercial or financial relationships that could be construed as a potential conflict of interest.
Publisher’s note
All claims expressed in this article are solely those of the authors and do not necessarily represent those of their affiliated organizations, or those of the publisher, the editors and the reviewers. Any product that may be evaluated in this article, or claim that may be made by its manufacturer, is not guaranteed or endorsed by the publisher.
Supplementary material
The Supplementary Material for this article can be found online at: https://www.frontiersin.org/articles/10.3389/fphy.2022.958364/full#supplementary-material
References
1. Sporns O, Tononi G, Kötter R. The human connectome: A structural description of the human brain. Plos Comput Biol (2005) 1:e42. doi:10.1371/journal.pcbi.0010042
3. Tax CM, Bastiani M, Veraart J, Garyfallidis E, Okan Irfanoglu M. What’s new and what’s next in diffusion MRI preprocessing. NeuroImage (2022) 249:118830. doi:10.1016/j.neuroimage.2021.118830
4. Beaujoin J, Palomero-Gallagher N, Boumezbeur F, Axer M, Bernard J, Poupon F, et al. Post-mortem inference of the human hippocampal connectivity and microstructure using ultra-high field diffusion MRI at 11.7 T. Brain Struct Funct (2018) 223:2157–79. doi:10.1007/s00429-018-1617-1
5. Elam JS, Glasser MF, Harms MP, Sotiropoulos SN, Andersson JL, Burgess GC, et al. The human connectome project: A retrospective. NeuroImage (2021) 244:118543. doi:10.1016/j.neuroimage.2021.118543
6. Yendiki A, Aggarwal M, Axer M, Howard AF, van Walsum AMC, Haber SN. Post mortem mapping of connectional anatomy for the validation of diffusion MRI. NeuroImage (2022) 256:119146. doi:10.1016/j.neuroimage.2022.119146
7. Liewald D, Miller R, Logothetis N, Wagner HJ, Schüz A. Distribution of axon diameters in cortical white matter: An electron-microscopic study on three human brains and a macaque. Biol Cybern (2014) 108:541–57. doi:10.1007/s00422-014-0626-2
8. Rockland KS. What we can learn from the complex architecture of single axons. Brain Struct Funct (2020) 225:1327–47. doi:10.1007/s00429-019-02023-3
9. Axer M, Graessel D, Kleiner M, Dammers J, Dickscheid T, Reckfort J, et al. High-resolution fiber tract reconstruction in the human brain by means of three-dimensional polarized light imaging. Front Neuroinform (2011) 5:34. doi:10.3389/fninf.2011.00034
10. Axer M, Amunts K, Grässel D, Palm C, Dammers J, Axer H, et al. A novel approach to the human connectome: Ultra-high resolution mapping of fiber tracts in the brain. NeuroImage (2011) 54:1091–101. doi:10.1016/j.neuroimage.2010.08.075
11. Wang H, Magnain C, Wang R, Dubb J, Varjabedian A, Tirrell LS, et al. As-PSOCT: Volumetric microscopic imaging of human brain architecture and connectivity. NeuroImage (2018) 165:56–68. doi:10.1016/j.neuroimage.2017.10.012
12. Lim H, Sharoukhov D, Kassim I, Zhang Y, Salzer JL, Melendez-Vasquez CV. Label-free imaging of Schwann cell myelination by third harmonic generation microscopy. Proc Natl Acad Sci U S A (2014) 111:18025–30. doi:10.1073/pnas.1417820111
13. Friedenbach DJ, Stagno PA, Olson GE. A silver method for staining normal axis cylinders of central nervous system structures. J Neurosci Methods (1980) 3:49–56. doi:10.1016/0165-0270(80)90033-3
14. Nieuwenhuys R. The myeloarchitectonic studies on the human cerebral cortex of the Vogt–Vogt school, and their significance for the interpretation of functional neuroimaging data. Brain Struct Funct (2013) 218:303–52. doi:10.1007/s00429-012-0460-z
15. Stefaniuk M, Gualda EJ, Pawlowska M, Legutko D, Matryba P, Koza P, et al. Light-sheet microscopy imaging of a whole cleared rat brain with Thy1-GFP transgene. Sci Rep (2016) 6:28209. doi:10.1038/srep28209
16. Costantini I, Cicchi R, Silvestri L, Vanzi F, Pavone FS. In-vivo and ex-vivo optical clearing methods for biological tissues: Review. Biomed Opt Express (2019) 10:5251. doi:10.1364/BOE.10.005251
17. Leuze C, Goubran M, Barakovic M, Aswendt M, Tian Q, Hsueh B, et al. Comparison of diffusion MRI and CLARITY fiber orientation estimates in both gray and white matter regions of human and primate brain. NeuroImage (2021) 228:117692. doi:10.1016/j.neuroimage.2020.117692
18. Silvestri L, Allegra Mascaro AL, Costantini I, Sacconi L, Pavone FS. Correlative two-photon and light sheet microscopy. Methods (2014) 66:268–72. doi:10.1016/j.ymeth.2013.06.013
19. Svoboda K, Yasuda R. Principles of two-photon excitation microscopy and its applications to neuroscience. Neuron (2006) 50:823–39. doi:10.1016/j.neuron.2006.05.019
20. Amato SP, Pan F, Schwartz J, Ragan TM. Whole brain imaging with serial two-photon tomography. Front Neuroanat (2016) 10:31. doi:10.3389/fnana.2016.00031
21. Hildebrand DGC, Cicconet M, Torres RM, Choi W, Quan TM, Moon J, et al. Whole-brain serial-section electron microscopy in larval zebrafish. Nature (2017) 545:345–9. doi:10.1038/nature22356
22. Loomba S, Straehle J, Gangadharan V, Heike N, Khalifa A, Motta A, et al. Connectomic comparison of mouse and human cortex. Science (2022) 377:eabo0924. doi:10.1126/science.abo0924
23. Ehrenberg CG. Weitere Mittheilungen über Resultate bei Anwendung des chromatisch polarisierten Lichtes für mikroskopische Verhältnisse (1849). p. 55–76.
24. Brodmann K. Bemerkungen zur untersuchung des nervensystems im polarisierten lichte. Berlin, Germany: Barth (1903).
25. Caspers S, Axer M, Gräßel D, Amunts K. Additional fiber orientations in the sagittal stratum—Noise or anatomical fine structure? Brain Struct Funct (2022) 227:1331–45. doi:10.1007/s00429-021-02439-w
26. Mollink J, Kleinnijenhuis M, van Cappellen van Walsum AM, Sotiropoulos SN, Cottaar M, Mirfin C, et al. Evaluating fibre orientation dispersion in white matter: Comparison of diffusion MRI, histology and polarized light imaging. NeuroImage (2017) 157:561–74. doi:10.1016/j.neuroimage.2017.06.001
27. Zeineh MM, Palomero-Gallagher N, Axer M, Gräel D, Goubran M, Wree A, et al. Direct visualization and mapping of the spatial course of fiber tracts at microscopic resolution in the human Hippocampus. Cereb Cortex (2016) 27:1779–94. doi:10.1093/cercor/bhw010
28. David S, Heemskerk AM, Corrivetti F, Thiebaut de Schotten M, Sarubbo S, Corsini F, et al. The superoanterior fasciculus (SAF): A novel white matter pathway in the human brain? Front Neuroanat (2019) 13:24. doi:10.3389/fnana.2019.00024
29. Henssen DJHA, Mollink J, Kurt E, van Dongen R, Bartels RHMA, Gräel D, et al. Ex vivo visualization of the trigeminal pathways in the human brainstem using 11.7T diffusion MRI combined with microscopy polarized light imaging. Brain Struct Funct (2019) 224:159–70. doi:10.1007/s00429-018-1767-1
30. Takemura H, Palomero-Gallagher N, Axer M, Gräßel D, Jorgensen MJ, Woods R, et al. Anatomy of nerve fiber bundles at micrometer-resolution in the vervet monkey visual system. eLife (2020) 9:e55444. doi:10.7554/eLife.55444
31. Guo SM, Yeh LH, Folkesson J, Ivanov IE, Krishnan AP, Keefe MG, et al. Revealing architectural order with quantitative label-free imaging and deep learning. eLife (2020) 9:e55502. doi:10.7554/eLife.55502
32. Schmitz D, Muenzing SEA, Schober M, Schubert N, Minnerop M, Lippert T, et al. Derivation of fiber orientations from oblique views through human brain sections in 3D-polarized light imaging. Front Neuroanat (2018) 12:75. doi:10.3389/fnana.2018.00075
33. van Ravenzwaaij D, Cassey P, Brown SD. A simple introduction to Markov chain Monte-Carlo sampling. Psychon Bull Rev (2018) 25:143–54. doi:10.3758/s13423-016-1015-8
34. Sharma S. Markov chain Monte Carlo methods for bayesian data analysis in astronomy. Annu Rev Astron Astrophys (2017) 55:213–59. doi:10.1146/annurev-astro-082214-122339
35. Harms RL, Roebroeck A. Robust and Fast Markov chain Monte Carlo sampling of diffusion MRI microstructure models. Front Neuroinform (2018) 12:97. doi:10.3389/fninf.2018.00097
36. Behrens TEJ, Woolrich MW, Jenkinson M, Johansen-Berg H, Nunes RG, Clare S, et al. Characterization and propagation of uncertainty in diffusion-weighted MR imaging. Magn Reson Med (2003) 50:1077–88. doi:10.1002/mrm.10609
37. Schmitz D, Lippert T, Amunts K, Axer M. Quantification of fiber orientation uncertainty in polarized light imaging of the human brain. In: GH Chen, and H Bosmans, editors. Medical imaging 2020: Physics of medical imaging, Vol. 11312. Bellingham, WA, USA: International Society for Optics and Photonics (SPIE) (2020). p. 787–95. doi:10.1117/12.2548935
38. Hernandez-Fernandez M, Reguly I, Jbabdi S, Giles M, Smith S, Sotiropoulos SN. Using GPUs to accelerate computational diffusion MRI: From microstructure estimation to tractography and connectomes. NeuroImage (2019) 188:598–615. doi:10.1016/j.neuroimage.2018.12.015
39. Whitcher B, Tuch DS, Wisco JJ, Sorensen AG, Wang L. Using the wild bootstrap to quantify uncertainty in diffusion tensor imaging. Hum Brain Mapp (2008) 29:346–62. doi:10.1002/hbm.20395
40. Yap PT, An H, Chen Y, Shen D. The non-local bootstrap–estimation of uncertainty in diffusion MRI. Inf Process Med Imaging (2013) 23:390–401. doi:10.1007/978-3-642-38868-2_33
41. Jones DK. Determining and visualizing uncertainty in estimates of fiber orientation from diffusion tensor MRI. Magn Reson Med (2003) 49:7–12. doi:10.1002/mrm.10331
42. Moussavi-Biugui A, Stieltjes B, Fritzsche K, Semmler W, Laun FB. Novel spherical phantoms for Q-ball imaging under in vivo conditions: Spherical Q-Ball Imaging Phantoms. Magn Reson Med (2011) 65:190–4. doi:10.1002/mrm.22602
43. Le H, Zeng W, Zhang H, Li J, Wu X, Xie M, et al. Mean apparent propagator MRI is better than conventional diffusion tensor imaging for the evaluation of Parkinson’s disease: A prospective pilot study. Front Aging Neurosci (2020) 12:563595. doi:10.3389/fnagi.2020.563595
44. Scher S, Messori G. Predicting weather forecast uncertainty with machine learning. Q J R Meteorol Soc (2018) 144:2830–41. doi:10.1002/qj.3410
45. Solomatine DP, Shrestha DL. A novel method to estimate model uncertainty using machine learning techniques. Water Resour Res (2009) 45. doi:10.1029/2008WR006839
46. Shrestha DL, Kayastha N, Solomatine D, Price R. Encapsulation of parametric uncertainty statistics by various predictive machine learning models: MLUE method. J Hydroinformatics (2013) 16:95–113. doi:10.2166/hydro.2013.242
47. Tipireddy R, Tartakovsky A. Physics-informed machine learning method for forecasting and uncertainty quantification of partially observed and unobserved states in power grids. In: Proceedings of the 52nd Annual Hawaii International Conference on System Sciences HICSS 2019 (2019). p. 3438–44.
48. Ling J, Templeton J. Evaluation of machine learning algorithms for prediction of regions of high Reynolds averaged Navier Stokes uncertainty. Phys Fluids (2015) 27:085103. doi:10.1063/1.4927765
49. Wang JX, Wu JL, Xiao H. Physics-informed machine learning approach for reconstructing Reynolds stress modeling discrepancies based on DNS data. Phys Rev Fluids (2017) 2:034603. doi:10.1103/PhysRevFluids.2.034603
50. Schultz T, Vilanova A. Diffusion MRI visualization. NMR Biomed (2019) 32:e3902. doi:10.1002/nbm.3902
51. Jeong HK, Anderson AW. Characterizing fiber directional uncertainty in diffusion tensor MRI. Magn Reson Med (2008) 60:1408–21. doi:10.1002/mrm.21734
52. Basser PJ, Mattiello J, LeBihan D. MR diffusion tensor spectroscopy and imaging. Biophysical J (1994) 66:259–67. doi:10.1016/S0006-3495(94)80775-1
53.MRI Diffusion, H Johansen-Berg, and TEJ Behrens, editors. Diffusion MRI. San Diego: Academic Press (2009). p. 481–90. doi:10.1016/B978-0-12-374709-9.00024-9
54. Amunts K, Lepage C, Borgeat L, Mohlberg H, Dickscheid T, Rousseau MÉ, et al. BigBrain: An ultrahigh-resolution 3D human brain model. Science (2013) 340:1472–5. doi:10.1126/science.1235381
55. Jones RC. A new calculus for the treatment of optical SystemsI description and discussion of the calculus. J Opt Soc Am (1941) 31:488. doi:10.1364/JOSA.31.000488
56. Menzel M. Finite-difference time-domain simulations assisting to reconstruct the brain’s nerve fiber architecture by 3D polarized light imaging. Aachen, Germany: RWTH Aachen University (2018). p. 296 S. doi:10.18154/RWTH-2018-230974
57. Goodman J, Weare J. Ensemble samplers with affine invariance. Comm App Math Comp Sci (2010) 5:65–80. doi:10.2140/camcos.2010.5.65
58. Hunter JD. Matplotlib: A 2D graphics environment. Comput Sci Eng (2007) 9:90–5. doi:10.1109/MCSE.2007.55
59.[Dataset] Waskom M, Botvinnik O, O’Kane D, Hobson P, Lukauskas S, Gemperline DC, et al. Mwaskom/seaborn: V0.8.1 (september 2017). Zenodo (2017). doi:10.5281/zenodo.883859
60. Menzel M, Axer M, Amunts K, De Raedt H, Michielsen K. Diattenuation Imaging reveals different brain tissue properties. Sci Rep (2019) 9:1939. doi:10.1038/s41598-019-38506-w
61. Giddings DR, Ratkowsky DA. Handbook of nonlinear regression models. Appl Stat (1991) 40:186–7. doi:10.2307/2347928
62. Singh A, Thakur N, Sharma A. A review of supervised machine learning algorithms. In: 2016 3rd International Conference on Computing for Sustainable Global Development (INDIACom) (2016). p. 1310–5.
63. Hastie T, Tibshirani R. Generalized additive models. 5 edn Oxfordshire, England, UK: Routledge (2017). doi:10.1201/9780203753781
64. Hastie T, Tibshirani R. Generalized additive models. Oxfordshire, England, UK: Chapman & Hall/CRC Monographs on Statistics & Applied Probability (Taylor & Francis) (1990).
65. Dominici F, McDermott A, Zeger SL, Samet JM. On the use of generalized additive models in time-series studies of air pollution and health. Am J Epidemiol (2002) 156:193–203. doi:10.1093/aje/kwf062
66. Bollaerts K, Eilers PHC, van Mechelen I. Simple and multiple P-splines regression with shape constraints. Br J Math Stat Psychol (2006) 59:451–69. doi:10.1348/000711005X84293
67. Pya N. Additive models with shape constraints. Ph.D. thesis. Bath, England: University of Bath Department of Mathematical Sciences (2010).
68. Wood SN. Generalized additive models: An introduction with R. 2 edn Oxfordshire, England, UK: Chapman and Hall/CRC (2017). doi:10.1201/9781315370279
69.[Dataset] Servén D, Brummitt C, Abedi H. Dswah/pygam: V0.8.0. Zenodo (2018). doi:10.5281/ZENODO.1476122
70. Schubert N, Axer M, Pietrzyk U, Amunts K. 3D polarized light imaging portrayed: Visualization of fiber architecture derived from 3D-PLI. In: AM Halefoğlu, editor. High-resolution neuroimaging - basic physical principles and clinical applications. London, UK: InTech (2018). p. 29–46. Chapter 3 ; ISBN: 978-953-51-3865-5; 10.5772/Intechopen.68268. doi:10.5772/intechopen.72532
71.[Dataset] Kropp JO, Kobusch A, Schmitz D, Axer M, Amunts K. Ultrafast model fitting for 3D-polarized light imaging using GPUs (2019).
72. Au KX, Graham MM, Thiery AH. Manifold lifting: Scaling MCMC to the vanishing noise regime (2021). arXiv:2003.03950 [stat].
73. Wong RKW, Yao F, Lee TCM. Robust estimation for generalized additive models. J Comput Graphical Stat (2014) 23:270–89. doi:10.1080/10618600.2012.756816
74. Alimadad A, Salibian-Barrera M. An outlier-robust fit for generalized additive models with applications to disease outbreak detection. J Am Stat Assoc (2011) 106:719–31. doi:10.1198/jasa.2011.tm09654
75. Kindlmann G. Superquadric tensor glyphs. In: VISSYM’04: Proceedings of the Sixth Joint Eurographics - IEEE TCVG Conference on Visualization. Goslar, DEU: Eurographics Association (2004). p. 147–54.
76. Ennis DB, Kindlman G, Rodriguez I, Helm PA, McVeigh ER. Visualization of tensor fields using superquadric glyphs. Magn Reson Med (2005) 53:169–76. doi:10.1002/mrm.20318
77. Costantini I, Baria E, Sorelli M, Matuschke F, Giardini F, Menzel M, et al. Autofluorescence enhancement for label-free imaging of myelinated fibers in mammalian brains. Sci Rep (2021) 11:8038. doi:10.1038/s41598-021-86092-7
78. Ghosh N, Wood MFG, Vitkin IA. Mueller matrix decomposition for extraction of individual polarization parameters from complex turbid media exhibiting multiple scattering, optical activity, and linear birefringence. J Biomed Opt (2008) 13:044036. doi:10.1117/1.2960934
79. Ghosh N, Wood MFG, Li SH, Weisel RD, Wilson BC, Li RK, et al. Mueller matrix decomposition for polarized light assessment of biological tissues. J Biophotonics (2009) 2:145–56. doi:10.1002/jbio.200810040
80. Menzel M, Reckfort J, Weigand D, Köse H, Amunts K, Axer M. Diattenuation of brain tissue and its impact on 3D polarized light imaging. Biomed Opt Express (2017) 8:3163. doi:10.1364/BOE.8.003163
81. Lee HR, Saytashev I, Du Le VN, Mahendroo M, Ramella-Roman J, Novikova T. Mueller matrix imaging for collagen scoring in mice model of pregnancy. Sci Rep (2021) 11:15621. doi:10.1038/s41598-021-95020-8
82. Si L, Huang T, Wang X, Yao Y, Dong Y, Liao R, et al. Deep learning Mueller matrix feature retrieval from a snapshot Stokes image. Opt Express (2022) 30:8676. doi:10.1364/OE.451612
83. Alkemade A, Bazin PL, Balesar R, Pine K, Kirilina E, Möller HE, et al. A unified 3D map of microscopic architecture and MRI of the human brain. Sci Adv (2022) 8:eabj7892. doi:10.1126/sciadv.abj7892
Keywords: polarized light imaging, birefringence, nerve fibers, uncertainty propagation, neuroimaging, uncertainty visualization, machine learning, Markov chain Monte Carlo
Citation: Schmitz D, Benning K, Schubert N, Minnerop M, Amunts K and Axer M (2022) Fast data-driven computation and intuitive visualization of fiber orientation uncertainty in 3D-polarized light imaging. Front. Phys. 10:958364. doi: 10.3389/fphy.2022.958364
Received: 31 May 2022; Accepted: 30 August 2022;
Published: 26 September 2022.
Edited by:
Jessica Ramella-Roman, Florida International University, United StatesReviewed by:
Tatiana Novikova, École Polytechnique, FranceDharmendra Kumar, Madan Mohan Malaviya University of Technology, India
Copyright © 2022 Schmitz, Benning, Schubert, Minnerop, Amunts and Axer. This is an open-access article distributed under the terms of the Creative Commons Attribution License (CC BY). The use, distribution or reproduction in other forums is permitted, provided the original author(s) and the copyright owner(s) are credited and that the original publication in this journal is cited, in accordance with accepted academic practice. No use, distribution or reproduction is permitted which does not comply with these terms.
*Correspondence: Kai Benning, ay5iZW5uaW5nQGZ6LWp1ZWxpY2guZGU=
†These authors have contributed equally to this work and share first authorship
 Daniel Schmitz
 Kai Benning
 Nicole Schubert
 Martina Minnerop
 Katrin Amunts
 Markus Axer