- 1Laboratory of Wave Mechanics, School of Aerospace Engineering, Beijing Institute of Technology, Beijing, China
- 2Beijing Institute of Control Engineering, Beijing, China
Quasi-zero stiffness (QZS) metamaterials and metastructures have great advantages of being highly integrable and lightweight for vibration isolation in aerospace and aviation applications. However, the geometric uncertainty introduced from additive manufacturing (AM) significantly affects the metamaterial/metastructure’s vibration isolation performance and therefore, needs to be evaluated accurately and efficiently in the design process. In this study, a high-order sparse Chebyshev polynomial expansion (HOSPSCPE) method is first utilized to quantify the influence of AM-induced geometric uncertainty in the QZS microstructure. Excellent accuracy and much higher efficiency (about 470 times faster) of the proposed method are observed when compared to the widely used Monte Carlo method (MCM). Uncertainty analyses are then conducted for vibration isolation performance of the QZS metastructures and band gap properties of the QZS locally resonant metamaterials, respectively. The numerical results demonstrate that the geometric uncertainty analysis can provide useful guidance and recommendations for the manufacturing-influenced design of QZS metastructures and metamaterials.
1 Introduction
Elastic metamaterials with carefully engineered geometries in their microstructures demonstrate various peculiar dynamic effective material properties absent from natural materials and, therefore, have gained great attention in many engineering fields [1–10]. These excellent properties of metamaterials and metastructures, the metamaterial-based finite structures, are dictated by man-made microstructures and, therefore, are critically dependent on the choice of the fabrication method. During the past decades, the development of additive manufacturing (AM) techniques has offered new potential for the fabrication of metamaterials or metastructures with complex geometries, many of which cannot be achieved through traditional fabrication methods [11–13]. One of the most important advantages of AM techniques is for lightweight engineering structures which are of particular interest in the aerospace and aviation industry [14–17].
In aerospace and aviation applications, vibration is a significant cause of concern particularly for lightweight aircraft and spacecraft structures, as it can result in numerous disasters, system performance degradation, human discomfort, and even catastrophic failures [18, 19]. Conventional elastic materials, such as rubber and other polymers, can attenuate high-frequency vibrations well, but require greater thickness for low-frequency vibration attenuation, which unfortunately increases the overall weight of the engineering structures [20, 21]. Locally resonant metamaterials possess extensive potential applications in low-frequency vibration and noise reduction [22–24], but suffer from limitations, such as the narrow working frequency ranges [25]. On the other hand, mechanism-based vibration isolators, such as quasi-zero stiffness (QZS) isolators, become widely used in broadband low-frequency vibration control [26]. A perfect QZS property can be achieved by utilizing a negative stiffness (NS) adjustable mechanism to neutralize the positive stiffness (PS) element [27]. Various QZS isolator designs have been investigated, such as buckling beam [28], cam–roller–spring mechanism [29], horizontal and oblique springs [30, 31], X-shaped structure [32], bionic structure [33], and magnetic mechanism [34]. However, miniaturization and installation of those mechanisms caused serious challenges for high-precision machining and packaging. To meet the requirements of the high-integrity and lightweight QZS structure, researchers started looking into metastructures with QZS microstructures [35–37], which can be directly fabricated via AM techniques without high-cost machining and packaging.
One of the major barriers that hinder the realization of functional metastructures via AM techniques is the variation in the geometric parameters of the manufactured microstructures. Therefore, uncertainty analysis is of critical importance in the design process of the metastructure. The probabilistic method is the traditional numerical method for uncertain systems. The Monte Carlo method (MCM) [38] is widely used in uncertain systems because of its simplicity, but the computational cost of this method is very high. To overcome expensive numerical simulation procedures in engineering, Wu et al. [39] developed the order increment strategy based on the high-order Chebyshev polynomial surrogate model for interval uncertainty analysis. Li et al. [40] used sparse regression and Chebyshev polynomials to help the interval analysis and applied them to the response-bound estimation of nonlinear dynamic systems. Chen et al. [41] proposed a new high-order sparse Gergenbauer polynomial surrogate model to effectively evaluate the band structure of phononic crystals under three uncertain models. Xie et al. [42], based on the Chebyshev polynomial surrogate model, calculated the interval bounds of the phononic crystals band structure with interval variables. However, there are no studies to quantify the effect of geometric uncertainty in the metastructures or metamaterials with QZS microstructures.
In this work, the high-order sparse Chebyshev polynomial expansion (HOSPSCPE) method is utilized for geometric uncertainty analysis of QZS metastructures. First, a sparse point sampling scheme is introduced to reduce the potential samples in high-dimensional problems. Also, the simplex format of Chebyshev polynomials is derived to decrease the number of coefficients of the approximation model. Then, the HOSPSCPE method is applied in geometric uncertainty analysis of the QZS metastructure designed for broadband low-frequency vibration isolation. The uncertainty analysis results show that the HOSPSCPE can accurately and efficiently evaluate the effect of the AM-induced geometric uncertainty in QZS metastructures and metamaterials. Thus, the geometric uncertainty analysis can combine manufacturing and design to provide guidance and recommendations for engineering applications.
The remainder of this study is organized as follows: Section 2 describes the geometric uncertainty analysis method for the QZS microstructure. Section 3 analyzes the static and dynamic geometric uncertainties of the QZS unit cell and metastructure. In Section 4, the bandgap characteristics of the QZS locally resonant metamaterial are investigated, and the geometric uncertainty from AM is analyzed. Finally, we draw some conclusions in Section 5.
2 Uncertainty analysis of QZS microstructure via the HOSPSCPE method
2.1 The QZS microstructure
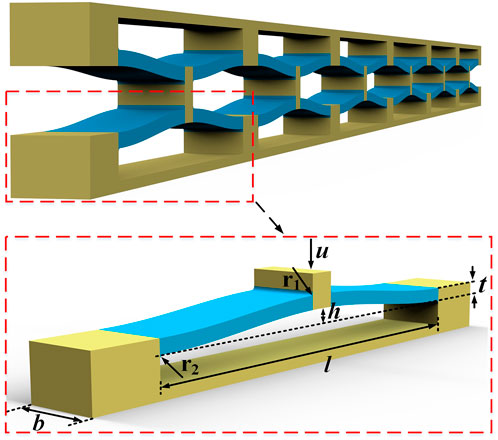
Since metastructures are composed of periodic units, the microstructure in each unit determines the overall properties of the metastructure. With more 3D metastructures being fabricated via 3D printing technology, the manufacturing imperfections being introduced to the microstructures can be critical to the stable performances of the 3D metastructures. Figure 1 shows the cosine beam microstructure in a QZS metastructure [37]. The performance of the pre-stressed microstructures is very sensitive to geometric uncertainty, and therefore, six parameters of microstructures are investigated. The shape of the cosine beam is given by
2.2 The HOSPSCPE method
2.2.1 Surrogate model
With the defined six parameters, the QZS microstructure is a high-dimensional system for uncertainty analysis. The interval bounds of the system response can be obtained by conducting numerous finite element (FE) simulations with different sampling points of the parameters, which unfortunately consumes impractical computational time. On the other hand, surrogate models as replacements for FE models can be introduced, which overcome the expensive simulation procedures for uncertainty analysis of a high-dimensional system. In order to obtain the surrogate model for uncertainty analysis of the QZS microstructure, Chebyshev polynomial expansion is used to construct the relationship between the stiffness of the microstructure beam, K, and the displacement of the beam along the height direction, u. In order to build the surrogate model, an interval model is first constructed [42], and the six parameters are treated as the interval variables, which can then be defined as X:
where
Here, let us first look at the one-dimensional case of an uncertain system, then we can easily expand to the high-dimensional case (six parameters in this study). It is assumed that the target stiffness function
where
Then,
where Yi is the constant Chebyshev coefficients. Ci(x) can be normalized and fit into the range
Then, the orthogonality of the Chebyshev polynomial can be embodied as follows:
where
Due to the orthogonality between Ci and Cp, the surrogate model coefficients can be obtained via the Gauss–Chebyshev integration method [43]:
where m is the number of interpolation points and xj is the interpolation point of the Chebyshev polynomial:
In order to balance the accuracy and the computational cost, the number of interpolation points m is usually set to s + 1. If the interval range of xi is not within
where
where θi is an angle related to
Thus, the surrogate model can be converted into the following:
where l is the number of equal-zero ir, (r = 1, 2, … , n).
According to the Gauss–Chebyshev integration method [43], Eq. 16 can be written as follows:
where
Substituting Eqs. 17 and 18 into Eq. 15, the interval response of the high-dimensional uncertainty system can be approximately expressed as follows:
The truncated order s and the number of interval variables n determine the number of approximate polynomial coefficients as N = (s + 1)n. For large s and n, a very high computational cost can be expected. In order to reduce the computational cost, Eq. 15 can be expressed in a simplex form as follows:
where the coefficient Yi can also be calculated by using the least square method. It is noted that the number of polynomial coefficients in Eq. 20 can be written as follows:
However, the “simplex” format may reduce the computational accuracy of the surrogate model. In the next section, how to balance the accuracy and efficiency of the model will be discussed.
2.2.2 Sparse point sampling scheme
The accuracy of the surrogate model can be affected by the sampling scheme. In general, the more samples are taken, the higher the accuracy of the surrogate model can be achieved. But such a sampling scheme sacrifices the corresponding computational efficiency. For high-dimensional systems, the tensor product of the interpolation points of the Chebyshev polynomial generates a large number of sampling points, which results in unaffordable computational time. Hence, to balance the accuracy and computational efficiency of the surrogate model, we introduce the sparse point sampling scheme which selects some points with statistical properties in the sampling candidate set [39].
The sampling candidate sets of the x set and the θ space can be, respectively, expressed as follows:
where xi and θi are the candidates of the ith variable in the x space and θ space, respectively. Based on Eq. 11, the link between xi and θi space can be written as follows:
Based on Eq. 21, smax can be calculated from the following:
where Nmax is the allowable maximal sampling amount. Hence, the candidate set of the surrogate model can be expressed as follows:
The maximin principle is utilized to estimate the uniformity of the initial sampling candidate set [44]. The scalar-valued criterion function [45] is utilized to select the sample points, which can be expressed as follows:
where q is a large positive integer and set as 100 in this study, and s0 is the number of samples. θ is the sampling set in the θ space.
The Euclidean distance
where
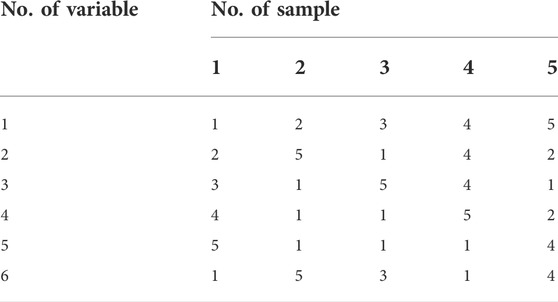
When the allowable maximal sampling amount Nmax is 400, it can be determined that smax is 4 according to Eq. 24. The initial sample size is N0 = mn. The first five elements of the pre-set reference column and reference row are highlighted in gray color in Table 1. In the table, the numbers represent the positions of the interpolation points in the corresponding variable interval. If the order m is smaller than i, the level of the ith variable will be set as the remainder of i/m.
Since smaller Φq means more uniformity of the sampling set, the remaining elements will be generated by Eq. 26 in order to create a uniformly distributed initial sample set, denoting the sampled set as θ and the remaining candidate set as ψ. When the new sample point
Since the first term of the right side in Eq. 28 is a constant, the minimizing operation will be applied to the second term, and then the equation can be written as follows:
According to Eq. 29, when Φq is the smallest in a two-dimensional space, the element in the second row of the second column in Table 1 can be calculated as 5. Similarly, we can obtain other elements of the sample point. When the second sample point is decided, the sampling point is removed from the candidate set ψ and added to the set θ. Similarly, the first m samples can be obtained, as shown in Table 1.
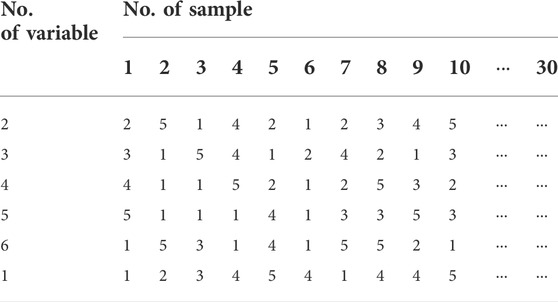
To obtain the other samples, the first row moves to the last, and the other rows sequentially move forward, as shown in Table 2. Similarly, the remaining part of the initial sample point set θ0 can be obtained.
Since the allowable maximal number sampling amount is Nmax, the number of the remaining sample point set θr is Nmax − N0. The remaining sample point set θr is written in matrix form as n*(Nmax − N0). Similarly, the remaining sample point set θr can be obtained by Eq. 29.
2.2.3 Uncertainty analysis of the QZS microstructure
Here, the HOSPSCPE method is utilized for the effective stiffness analysis of the QZS microstructure with uncertainties. The widely used Monte Carlo method (MCM), which is popular due to its simplicity but suffers high computational cost, particularly for high-dimensional uncertainty systems, is used to verify the accuracy of the HOSPSCPE method.
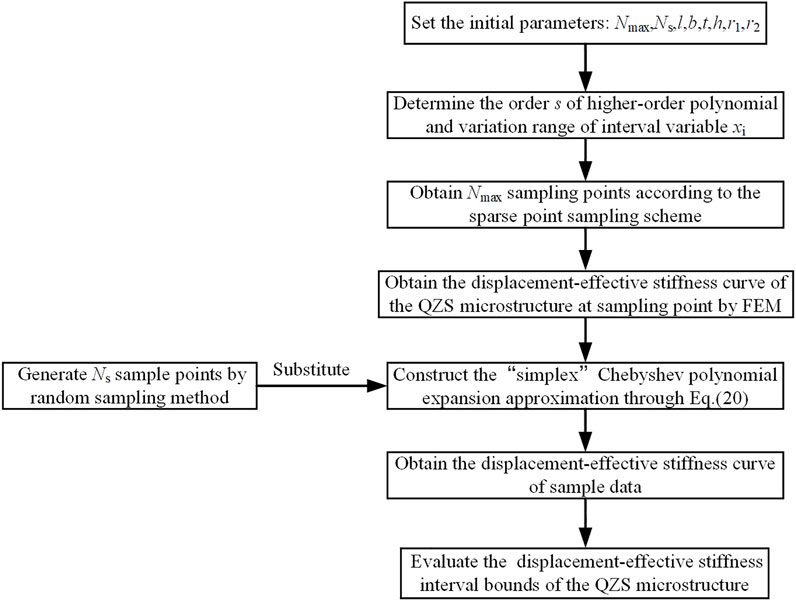
The computational process of the HOSPSCPE method is illustrated in Figure 2. Ns is the number of points obtained by the random sampling method. The geometric interval parameters of the QZS microstructure are listed in Table 3 where an uncertainty of 2% is introduced. The photosensitive resin is chosen as the material for the QZS microstructure (the density is ρ = 1160 kg ⋅m−3; Young’s modulus is E = 1,400 MPa; and Poisson’s ratio is v = 0.23).
A sampling method within the variables’ interval range randomly generating Ns = 10,000 sample data is introduced into the HOSPSCPE method and the MCM. Simulations are then carried out using MATLAB R2020a on a 3.0 GHz Xeon(R) CPU Gold 6154. The stiffness characteristics of the QZS microstructure with ξ = 2% uncertainty calculated by the two methods are illustrated in Figure 3. u* = 2h (1 + ξ) is the normalized displacement; K* = K/K0, the normalized stiffness with K0 being the lowest stiffness. It can be found in the figure that the stiffness characteristics of the QZS microstructure with 2% uncertainty obtained by the HOSPSCPE method (upper bound: red dots and lower bound: blue pentagrams) are very close to those obtained with the MCM (upper bound: the solid red line and lower bound: the blue dotted line). The computational time for the HOSPSCPE method is about 1868s, while the computational time for the MCM is about 880865s. Thus, a much higher efficiency (about 470 times faster) of the HOSPSCPE method is demonstrated.
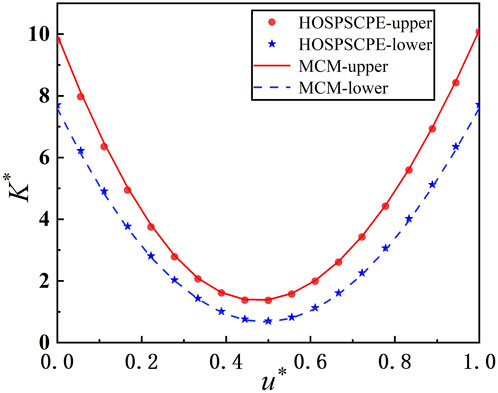
FIGURE 3. The stiffness characteristics of the QZS microstructure with 2% uncertainty obtained by the HOSPSCPE method and the MCM.
2.3 Sample interval density analysis under different sample distributions
In order to demonstrate the effect of different sample distributions on the stiffness characteristics of the QZS microstructures, we analyzed the sample density of the QZS effective stiffness interval for a large number of sample points obtained by the HOSPSCPE method. In general engineering problems, the samples with varying geometric parameters obey statistical characteristics such as normal distribution and uniform distribution. Hence, the sample interval density under different sample distributions can reflect the different stiffness characteristics of the QZS microstructures.
The normally distributed interval variables set X satisfies the following:
where μ is the mean and σ is the standard deviation. Mathematically, a feasible way to retain the primary characteristics of a normal distribution while avoiding extreme values involves the truncated normal distribution, where the defined range is limited at one or both ends of the interval. So, we assume that the variable interval (X (1 − ξ), X (1 + ξ)) is the same as the horizontal axis interval (μ − 3σ, μ + 3σ) of the normal distribution. In addition, 10,000 samples satisfying the normal distribution are randomly generated in the variable interval shown in Table 3.
From the perspective of vibration isolation performance, the quasi-zero region of the microstructure’s stiffness characteristics is our main area of concern. According to Figure 3, a quasi-zero region of K* is defined at [0, 2], and the range of the corresponding dimensionless displacement u* is [0.371, 0.633]. In order to obtain the sample interval density within the quasi-zero region, we divide the abscissa and ordinate of the quasi-zero region in Figure 3 into 120 parts and count the number of sample points in each divided part. Hence, the interval probability density of the normal distribution samples in the quasi-zero region can be obtained as shown in Figure 4A. d* is the probability density of the samples. Similarly, by randomly generating 10,000 sample points within the variable interval, the probability density of the uniformly distributed samples in the quasi-zero region is obtained in Figure 4B.
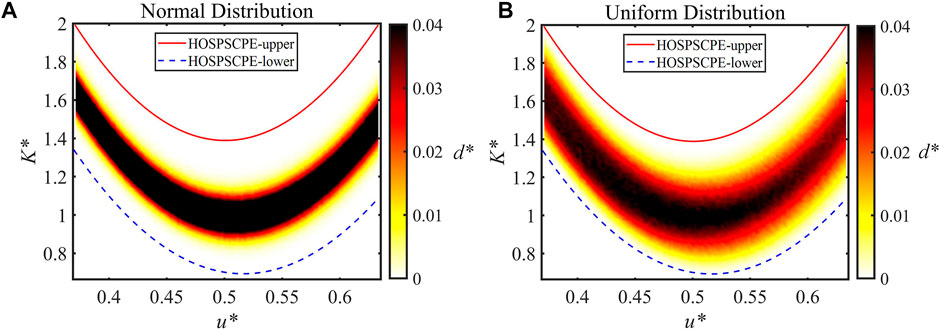
FIGURE 4. The probability densities of (A) the normal distribution samples and (B) the uniformly distributed samples of the QZS microstructure in the quasi-zero region.
It can be found that high probability density results of the normally distributed samples are mainly concentrated in a narrow region in the middle, as shown in Figure 4A; while those of the uniformly distributed samples are of more scattered distribution in the entire quasi-zero region, as shown in Figure 4B. By comparing the sample interval densities to the left and right of the minimum stiffness point, it is concluded that the influence of geometric uncertainty can be reduced when the QZS microstructure is less loaded. Based on the method of data mining, the influence of the sample distribution on the stiffness characteristics of the metastructure can be analyzed, which can provide suggestions and guidance for various practical engineering applications.
3 Uncertainty analysis of the QZS metastructure from additive manufacturing
3.1 Static uncertainty analysis of the QZS unit cell
A total of two QZS microstructures are connected in series to form a unit cell of the metastructure, as shown in Figure 5A. When conducting uncertainty analysis for the QZS unit cell, the number of interval variables and the calculation cost will increase exponentially. To ensure an affordable calculation cost of the unit cell analysis, the dimension of the uncertainty system needs to be reduced. A total of two cases (case I: the QZS microstructure with six geometric parameters including the chamfers r1 and r2 and case II: the QZS microstructure with four geometric parameters excluding the two chamfers) will be analyzed, respectively. The interval ranges of the geometric parameters are listed in Table 4. The accuracy (0.1 mm) in the table is the actual accuracy of the stereolithography appearance (SLA) 3D printing technology. Based on the HOSPSCPE method, the effective stiffness interval of the QZS microstructures of the two cases is obtained, as shown in Figure 5B. The upper and lower bounds of the stiffness interval are very close for both cases, indicating that the chamfers of the QZS microstructure have very few effects on the stiffness characteristics. Thus, the dimension-reduced uncertainty system can be considered in the subsequent analysis, which will reduce the computational effort.
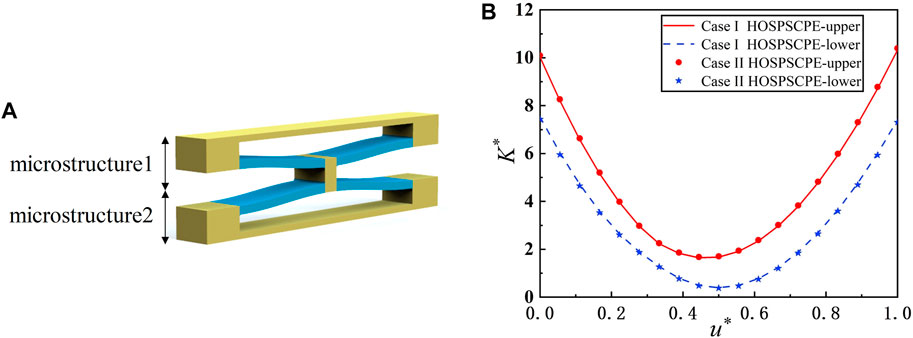
FIGURE 5. (A) QZS unit cell model. (B) The stiffness characteristics of the QZS microstructure for two cases.

TABLE 4. The interval ranges of geometric parameters under the actual accuracy (0.1 mm) of the 3D printer.
The stiffness characteristics of the QZS unit cell are analyzed based on the HOSPSCPE method. The interval range of the geometric parameters is listed in Table 5, and the analysis results are shown in Figure 6A. By comparing the stiffness characteristic of the unit cell (Figure 6A) with that of the microstructure (Figure 6B), the change in the boundaries of the interval can be observed. Particularly, an enlarged range can be observed in the unit cell’s result when the stiffness approaches zero. Two cases are studied to demonstrate the more complex uncertainty system of the unit cell when it is compared with the system of the microstructure. In the first case, the upper and lower microstructures are symmetric in the unit cell. Hence, the upper and lower curved beams can reach the quasi-zero state simultaneously, as shown in Figure 6B. In the figure, the displacement-effective stiffness curve (the black line) of the unit cell has only one minimum stiffness. In the second case, the geometric uncertainty from the manufacturing leads to asymmetric upper and lower microstructures. As a result, two local minimum points in the displacement-effective stiffness curve appear in Figure 6C. The first local minimum point appears when the curved beam with the smaller stiffness reaches the quasi-zero state, while the second local minimum point appears when the curved beam with the larger stiffness comes to the quasi-zero state.
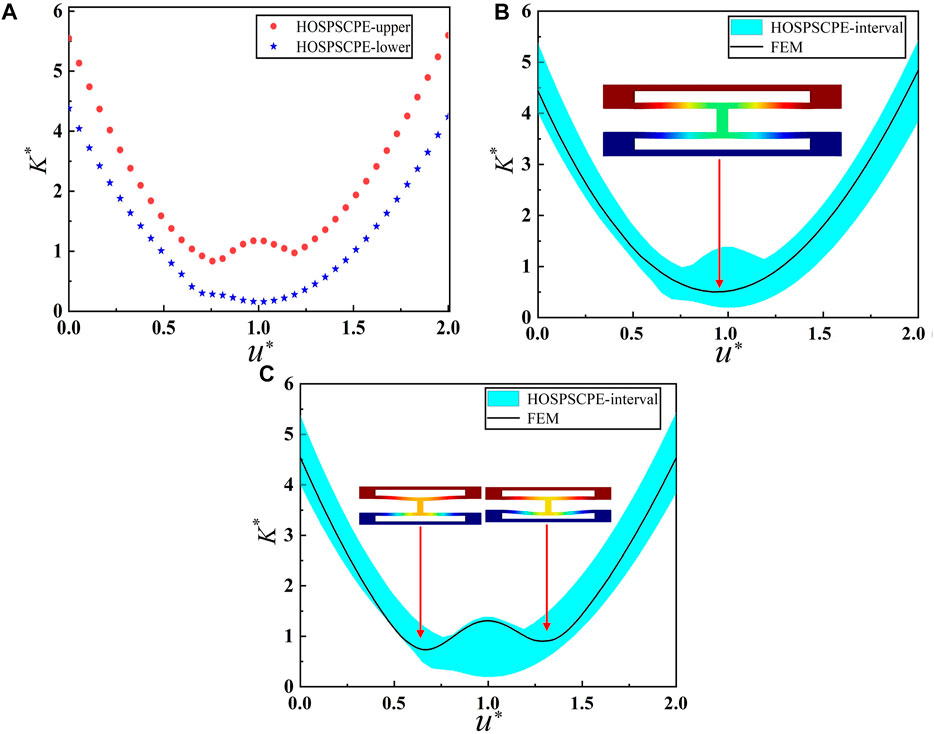
FIGURE 6. Static uncertainty analysis of the QZS unit cell. (A) The stiffness characteristics of the QZS unit cell. (B) Static analysis of the QZS unit cell with symmetrical microstructures. (C) Static analysis of the QZS unit cell with asymmetric microstructures.
3.2 Dynamic uncertainty analysis of the QZS metastructure for vibration isolation performance
The QZS metastructure enables excellent vibration isolation capability in the low-frequency range. However, the geometric uncertainties introduced by the AM process can cause the actual equilibrium point to deviate from the designed equilibrium point, which prevents the stiffness from achieving the perfect zero-stiffness state at the equilibrium point. Such deviation can further affect the vibration isolation performance of the metastructure. Here, we develop a finite metastructure model consisting of six QZS unit cells as shown in Figure 7A, where the gray color indicates the support mass. In the dynamic simulations, the support mass is set to 13.5 kg, which compresses the metastructure by 4.4 mm. By acknowledging the compressed metastructure, harmonic analysis is then performed by applying simple harmonic displacement excitation at the bottom of the metastructure. The transmittance can be defined as
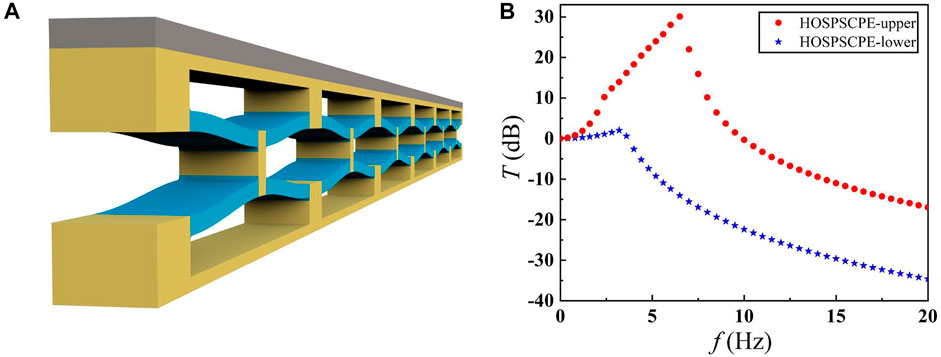
FIGURE 7. Dynamic uncertainty analysis of the QZS metastructure for vibration isolation. (A) The QZS metastructure model. (B) The transmittance of the QZS metastructure when the geometric uncertainty effect is considered.
4 Uncertainty analysis of the QZS local resonance metastructure from additive manufacturing
The QZS locally resonant metamaterials are designed with beam segments and embedded QZS microstructures, as shown in Figure 8. With the embedded QZS microstructures, lighter weight and lower vibration isolation frequency can be expected [37]. However, the geometric uncertainty from AM can affect the bandgap properties of the metamaterial and, therefore, downgrade the vibration isolation performance. To quantify the influence of the geometric uncertainty on QZS locally resonant metamaterials, we first calculate the band structure of the metamaterial [46]. Then, the effective stiffness interval of the QZS microstructure obtained by the HOSPSCEP method is introduced into the band structure calculation, and thus the bandgap properties of metamaterials with geometric uncertainty are obtained.
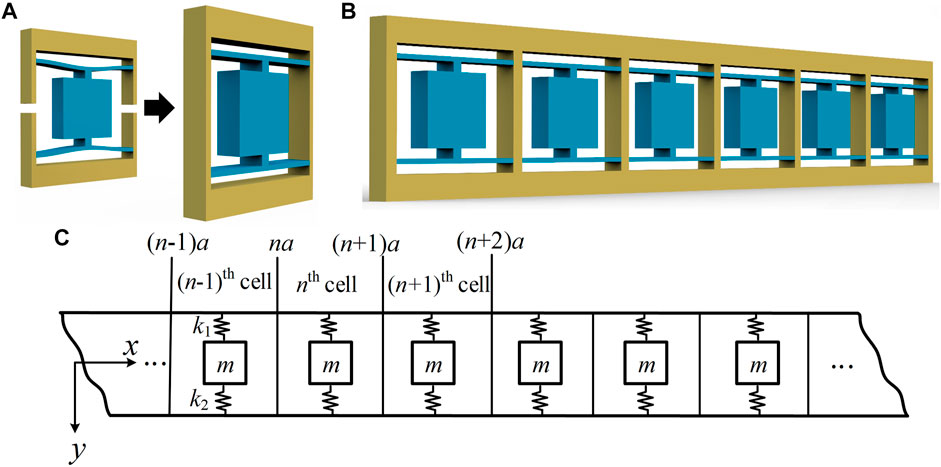
FIGURE 8. The QZS-LR metamaterial. (A) The embedded QZS-LR metastructure model. (B) The QZS-LR metamaterial model. (C) A simple model of the QZS-LR metamaterial.
Figures 8A and B show the embedded QZS unit cell and the metamaterial consisting of periodically arranged unit cells, respectively. An equivalent mass–spring–beam model can be introduced to calculate the band structure of metamaterial [46], as shown in Figure 8C. When excited by transverse vibration, the QZS locally resonant metamaterial can generate a transverse polarization forbidden band due to the local resonance effect of the embedded resonator and, therefore, attenuate the transverse vibration. Since geometric uncertainty leads to the stiffness uncertainty of the QZS microstructure at the ideal equilibrium point of the nominal design (a stiffness range of [0.95 kN/m, 4.20 kN/m] being obtained based on the HOSPSCPE method as shown in Figure 5), taking this range as the stiffness range of k1 and k2, the metamaterial model can be obtained (the unit cell contains two QZS microstructures). To quantify the geometric uncertainty of the metamaterial, we take k1 and k2 as interval variables and use a random sampling method to obtain 10,000 sampling points within the range of the interval variable. By substituting the obtained sampling points into the band structure calculation equation [46], the interval characteristic of the band gap can be obtained.
Figure 9 shows the calculated band structure of the QZS locally resonant metamaterial with introduced geometric uncertainty. In the figure, q* = (qb/π) is the normalized wave number along the x direction, the normalized frequency is defined as f* = (f/f0), where f0 is the resonance frequency of nominally designed metamaterial. Table 6 lists the materials and geometric parameters utilized in the calculation. In the figure, the cyan area represents the forbidden band obtained at the upper boundary of the dispersion curve interval, while the gray area represents the forbidden band obtained at the lower boundary. The band gap frequency ranges of the QZS locally resonant metamaterial change from [0.64, 0.94] to [1.35, 1.98] due to geometric uncertainties. The nominal design needs to be changed if the bandgap frequency range obtained by uncertainty analysis is not within the acceptable range of our nominal design. Hence, it can be seen that the geometric uncertainty has a great influence on the bandgap characteristics of the metamaterial, and therefore, it is necessary to consider the geometric uncertainty caused by addictive manufacturing in practical engineering applications.
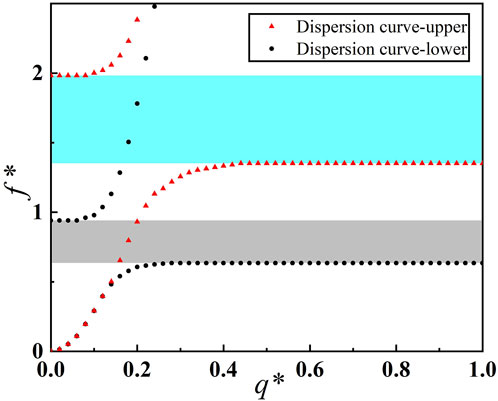
FIGURE 9. The band structure of the QZS locally resonant metamaterial with introduced geometric uncertainty.
5 Conclusion and discussion
In this study, the HOSPSCPE method is utilized to accurately evaluate the influence of AM-introduced geometric uncertainty. A simplex format of polynomials and a sparse sequential sampling scheme is introduced in the HOSPSCPE method in order to reduce the sampling points and, therefore, improve the computational efficiency by 470 times when compared to the MCM. In addition, data mining is performed on the sample data response of the QZS microstructure obtained by the HOSPSCPE method. It is concluded that the influence of geometric uncertainty can be reduced when the QZS microstructure is less loaded. Moreover, uncertainty analyses are conducted for vibration isolation performance of QZS metastructures and band gap properties of the QZS locally resonant metamaterials, respectively. The numerical results demonstrate that the geometric uncertainty analysis can provide useful guidance and recommendations for the manufacturing-influenced design of QZS metastructures and metamaterials.
In future work, the accuracy of the SLA 3D printing technology can be considered in the experimental validation of the uncertainty analysis. Multiple samples of the QZS metastructure can first be printed, and interval variables of each sample can be accurately measured. The distribution of the samples can then be obtained in the sample space. Finally, by performing the experimental analysis on each printed sample, we can obtain the corresponding mechanical characteristic curve, which can be compared with the interval characteristic obtained by numerical calculation to verify the effectiveness of the method.
Data availability statement
The original contributions presented in the study are included in the article/Supplementary Material; further inquiries can be directed to the corresponding authors.
Author contributions
DW and RZ designed the research. DW wrote the code and performed the simulations. DW, JZ, QM, and RZ analyzed the data. RZ and DZ supervised the research. All authors wrote the manuscript.
Acknowledgments
The authors are thankful for the financial support from the National Natural Science Foundation of China (grant nos U1837602, 11872112, and 11991033) and the National Key Research and Development Program of China (grant nos 2021YFE0110900 and 2020YFF0304801).
Conflict of interest
The authors declare that the research was conducted in the absence of any commercial or financial relationships that could be construed as a potential conflict of interest.
Publisher’s note
All claims expressed in this article are solely those of the authors and do not necessarily represent those of their affiliated organizations, or those of the publisher, the editors, and the reviewers. Any product that may be evaluated in this article, or claim that may be made by its manufacturer, is not guaranteed or endorsed by the publisher.
References
1. Zheludev NI, Kivshar YS. From metamaterials to metadevices. Nat Mater (2012) 11:917–24. doi:10.1038/nmat3431
2. Srivastava A. Elastic metamaterials and dynamic homogenization: a review. Int J Smart Nano Mater (2015) 6:41–60. doi:10.1080/19475411.2015.1017779
3. Peiró-Torres MP, Castiñeira-Ibáñez S, Redondo J, Sánchez-Pérez JV. Interferences in locally resonant sonic metamaterials formed from helmholtz resonators. Appl Phys Lett (2019) 114:171901. doi:10.1063/1.5092375
4. Li Y, Yan S, Li H. Wave propagation of 2d elastic metamaterial with rotating squares and hinges. Int J Mech Sci (2022) 217:107037. doi:10.1016/j.ijmecsci.2021.107037
5. Chen Y, Hu G, Huang G. A hybrid elastic metamaterial with negative mass density and tunable bending stiffness. J Mech Phys Sol (2017) 105:179–98. doi:10.1016/j.jmps.2017.05.009
6. Zhuang X, Nguyen C, Nanthakumar S, Chamoin L, Jin Y, Rabczuk T. Inverse design of reconfigurable piezoelectric topological phononic plates. Mater Des (2022) 219:110760. doi:10.1016/j.matdes.2022.110760
7. Yakovleva A, Movchan I, Misseroni D, Pugno N, Movchan A. Multi-physics of dynamic elastic metamaterials and earthquake systems. Front Mater (2021) 7:620701. doi:10.3389/fmats.2020.620701
8. Wu K, Hu H, Wang L. Optimization of a type of elastic metamaterial for broadband wave suppression. Proc R Soc A (2021) 477:20210337. doi:10.1098/rspa.2021.0337
9. Zhang M, Yang J, Zhu R. Origami-based bistable metastructures for low-frequency vibration control. J Appl Mech (2021) 88. doi:10.1115/1.4049953
10. Yi K, Liu Z, Zhu R. Multi-resonant metamaterials based on self-sensing piezoelectric patches and digital circuits for broadband isolation of elastic wave transmission. Smart Mater Struct (2021) 31:015042. doi:10.1088/1361-665x/ac3b1f
11. Askari M, Hutchins DA, Thomas PJ, Astolfi L, Watson RL, Abdi M, et al. Additive manufacturing of metamaterials: A review. Additive Manufacturing (2020) 36:101562. doi:10.1016/j.addma.2020.101562
12. Al Rifaie M, Abdulhadi H, Mian A. Advances in mechanical metamaterials for vibration isolation: A review. Adv Mech Eng (2022) 14:168781322210828. doi:10.1177/16878132221082872
13. Monkova K, Vasina M, Zaludek M, Monka PP, Tkac J. Mechanical vibration damping and compression properties of a lattice structure. Materials (2021) 14:1502. doi:10.3390/ma14061502
14. Rice H, Kennedy J, Göransson P, Dowling L, Trimble D. Design of a kelvin cell acoustic metamaterial. J Sound Vibration (2020) 472:115167. doi:10.1016/j.jsv.2019.115167
15. Amendola A, Hernández-Nava E, Goodall R, Todd I, Skelton R, Fraternali F. On the additive manufacturing, post-tensioning and testing of bi-material tensegrity structures. Compos Structures (2015) 131:66–71. doi:10.1016/j.compstruct.2015.04.038
16. Zhou D, Huang X, Du Z. Analysis and design of multilayered broadband radar absorbing metamaterial using the 3-d printing technology-based method. IEEE Antennas Wirel Propag Lett (2016) 16:133–6. doi:10.1109/LAWP.2016.2560904
17. Sadeqi A, Rezaei Nejad H, Owyeung RE, Sonkusale S. Three dimensional printing of metamaterial embedded geometrical optics (mego). Microsyst Nanoeng (2019) 5:16. doi:10.1038/s41378-019-0053-6
18. Dalela S, Balaji P, Jena D. A review on application of mechanical metamaterials for vibration control. Mech Adv Mater structures (2021) 1–26. doi:10.1080/15376494.2021.1892244
19. Yan B, Yu N, Wang Z, Wu C, Wang S, Zhang W. Lever-type quasi-zero stiffness vibration isolator with magnetic spring. J Sound Vibration (2022) 527:116865. doi:10.1016/j.jsv.2022.116865
20. Valeev A, Zotov A, Kharisov S. Designing of compact low frequency vibration isolator with quasi-zero-stiffness. J low frequency noise, vibration active Control (2015) 34:459–73. doi:10.1260/0263-0923.34.4.459
21. Wang Q, Zhou J, Xu D, Ouyang H. Design and experimental investigation of ultra-low frequency vibration isolation during neonatal transport. Mech Syst Signal Process (2020) 139:106633. doi:10.1016/j.ymssp.2020.106633
22. Li Y, Zi H, Wu X, Zhu L. Flexural wave propagation and vibration isolation characteristics of sandwich plate-type elastic metamaterials. J Vibration Control (2021) 27:1443–52. doi:10.1177/1077546320942689
23. Liu Z, Zhang X, Mao Y, Zhu Y, Yang Z, Chan CT, et al. Locally resonant sonic materials. science (2000) 289:1734–6. doi:10.1126/science.289.5485.1734
24. Jin Y, Pennec Y, Bonello B, Honarvar H, Dobrzynski L, Djafari-Rouhani B, et al. Physics of surface vibrational resonances: Pillared phononic crystals, metamaterials, and metasurfaces. Rep Prog Phys (2021) 84:086502. doi:10.1088/1361-6633/abdab8
25. Liu H, Xiao K, Lv Q, Ma Y. Analysis and experimental study on dynamic characteristics of an integrated quasi-zero stiffness isolator. J Vib Acoust (2022) 144. doi:10.1115/1.4051549
26. Alabuzhev P. Vibration protection and measuring systems with quasi-zero stiffness. New York: CRC Press (1989).
27. Zhou J, Pan H, Cai C, Xu D. Tunable ultralow frequency wave attenuations in one-dimensional quasi-zero-stiffness metamaterial. Int J Mech Mater Des (2021) 17:285–300. doi:10.1007/s10999-020-09525-7
28. Dalela S, Balaji P, Jena D. Design of a metastructure for vibration isolation with quasi-zero-stiffness characteristics using bistable curved beam. Nonlinear Dyn (2022) 108:1931–71. doi:10.1007/s11071-022-07301-0
29. Zhou J, Wang X, Xu D, Bishop S. Nonlinear dynamic characteristics of a quasi-zero stiffness vibration isolator with cam–roller–spring mechanisms. J Sound Vibration (2015) 346:53–69. doi:10.1016/j.jsv.2015.02.005
30. Liu Y, Xu L, Song C, Gu H, Ji W. Dynamic characteristics of a quasi-zero stiffness vibration isolator with nonlinear stiffness and damping. Arch Appl Mech (2019) 89:1743–59. doi:10.1007/s00419-019-01541-0
31. Wen G, He J, Liu J, Lin Y. Design, analysis and semi-active control of a quasi-zero stiffness vibration isolation system with six oblique springs. Nonlinear Dyn (2021) 106:309–21. doi:10.1007/s11071-021-06835-z
32. Chai Y, Jing X, Chao X. X-shaped mechanism based enhanced tunable qzs property for passive vibration isolation. Int J Mech Sci (2022) 218:107077. doi:10.1016/j.ijmecsci.2022.107077
33. Deng T, Wen G, Ding H, Lu ZQ, Chen LQ. A bio-inspired isolator based on characteristics of quasi-zero stiffness and bird multi-layer neck. Mech Syst Signal Process (2020) 145:106967. doi:10.1016/j.ymssp.2020.106967
34. Oyelade AO. Experiment study on nonlinear oscillator containing magnetic spring with negative stiffness. Int J Non-Linear Mech (2020) 120:103396. doi:10.1016/j.ijnonlinmec.2019.103396
35. Cai C, Zhou J, Wu L, Wang K, Xu D, Ouyang H. Design and numerical validation of quasi-zero-stiffness metamaterials for very low-frequency band gaps. Compos structures (2020) 236:111862. doi:10.1016/j.compstruct.2020.111862
36. Zhang Q, Guo D, Hu G. Tailored mechanical metamaterials with programmable quasi-zero-stiffness features for full-band vibration isolation. Adv Funct Mater (2021) 31:2101428. doi:10.1002/adfm.202101428
37. Zhao W, Wang Y, Huang G, Zhu R. Isolating vibrations with different polarizations via lightweight embedded metastructure. Health Monit Struct Biol Syst XIII (Spie) (2019) 10972:89–96. doi:10.1117/12.2514295
38. Zhang H, Mullen RL, Muhanna RL. Interval Monte Carlo methods for structural reliability. Struct Saf (2010) 32:183–90. doi:10.1016/j.strusafe.2010.01.001
39. Wu J, Luo Z, Zheng J, Jiang C. Incremental modeling of a new high-order polynomial surrogate model. Appl Math Model (2016) 40:4681–99. doi:10.1016/j.apm.2015.12.002
40. Li C, Chen B, Peng H, Zhang S. Sparse regression chebyshev polynomial interval method for nonlinear dynamic systems under uncertainty. Appl Math Model (2017) 51:505–25. doi:10.1016/j.apm.2017.06.008
41. Chen J, Xia B, Liu J. A sparse polynomial surrogate model for phononic crystals with uncertain parameters. Comp Methods Appl Mech Eng (2018) 339:681–703. doi:10.1016/j.cma.2018.05.001
42. Xie L, Liu J, Huang G, Zhu W, Xia B. A polynomial-based method for topology optimization of phononic crystals with unknown-but-bounded parameters. Int J Numer Methods Eng (2018) 114:777–800. doi:10.1002/nme.5765
43. Eslahchi M, Dehghan M, Masjed-Jamei M. On numerical improvement of the first kind gauss–chebyshev quadrature rules. Appl Math Comput (2005) 165:5–21. doi:10.1016/j.amc.2004.06.102
44. Johnson ME, Moore LM, Ylvisaker D. Minimax and maximin distance designs. J Stat Plann inference (1990) 26:131–48. doi:10.1016/0378-3758(90)90122-B
45. Morris MD, Mitchell TJ. Exploratory designs for computational experiments. J Stat Plann inference (1995) 43:381–402. doi:10.1016/0378-3758(94)00035-t
Keywords: quasi-zero stiffness, Chebyshev polynomial expansion, sparse point sampling, vibration isolation metastructure, locally resonant
Citation: Wang D, Zhao J, Ma Q, Zhou G, Zhang D and Zhu R (2022) Uncertainty analysis of quasi-zero stiffness metastructure for vibration isolation performance. Front. Phys. 10:957594. doi: 10.3389/fphy.2022.957594
Received: 31 May 2022; Accepted: 23 August 2022;
Published: 23 September 2022.
Edited by:
Han Zhang, Institute of Acoustics (CAS), ChinaReviewed by:
Yabin Jin, Tongji University, ChinaBing Li, Northwestern Polytechnical University, China
Copyright © 2022 Wang, Zhao, Ma, Zhou, Zhang and Zhu. This is an open-access article distributed under the terms of the Creative Commons Attribution License (CC BY). The use, distribution or reproduction in other forums is permitted, provided the original author(s) and the copyright owner(s) are credited and that the original publication in this journal is cited, in accordance with accepted academic practice. No use, distribution or reproduction is permitted which does not comply with these terms.
*Correspondence: Duzhou Zhang, emhhbmdkdXpob3VjYXN0QDEyNi5jb20=; Rui Zhu, cnVpemh1QGJpdC5lZHUuY24=
 Dongxian Wang
 Jianlei Zhao1
 Qian Ma
 Rui Zhu