- 1Graphcore, Inc., Palo Alto, CA, United States
- 2LCLS, SLAC National Accelerator Laboratory, Menlo Park, CA, United States
- 3DSL, Argonne National Laboratory, Lemont, IL, United States
- 4PULSE Institute, SLAC National Accelerator Laboratory, Menlo Park, CA, United States
We present a case for low batch-size inference with the potential for adaptive training of a lean encoder model. We do so in the context of a paradigmatic example of machine learning as applied in data acquisition at high data velocity scientific user facilities such as the Linac Coherent Light Source-II x-ray Free-Electron Laser. We discuss how a low-latency inference model operating at the data acquisition edge can capitalize on the naturally stochastic nature of such sources. We simulate the method of attosecond angular streaking to produce representative results whereby simulated input data reproduce high-resolution ground truth probability distributions. By minimizing the mean-squared error between the decoded output of the latent representation and the ground truth distributions, we ensure that the encoding layers and resulting latent representation maintains full fidelity for any downstream task, be it classification or regression. We present throughput results for data-parallel inference of various batch sizes, some with throughput exceeding 100 k images per second. We also show in situ training below 10 s per epoch for the full encoder–decoder model as would be relevant for streaming and adaptive real-time data production at our nation’s scientific light sources.
1 Introduction
Among the leading major scientific facilities in the US Department of Energy’s portfolio is the Linac Coherent Light Source (LCLS). As the world’s first hard x-ray free-electron laser (xFEL), its ultra-short x-ray pulses, shorter than typical periods for most molecular vibrations, allow its international research users to peer into the inner workings of some of nature’s key chemical reactions [1]. The very high peak brightness of these x-ray pulses also allow for imaging of the interior structure of material in extreme conditions of heat and density to elucidate the inner working of planets [2] and are helping expose the workings of fusion energy [3]. The breadth of scientific discovery opened by such a facility impacts fields from novel material designs to biological function, even helping drug design for SARS-CoV-2 [4].
There is an upgrade imminent for this xFEL, the so-called LCLS-II [5], which will further accelerate the rapidly broadening range of scientific-use cases. The overwhelming data-ingest rates [6] will also be coupled with automated schemes for experimental execution. Such automation will accommodate intermittent updates that track the variations that are inherent to dynamic experimental conditions. We use the example of ultra-high throughput continuous data acquisition, analysis, and decision streams to motivate inference acceleration directly at the data acquisition node via direct attached co-processors. We demonstrate the high throughput inference and training for one of the early-streaming high data velocity detectors at the LCLS-II such as the array of electron spectrometers described in Ref. 7.
The xFEL pulses arise from the self-amplification of spontaneous emission (SASE) [8], and so the time and spectral structure of SASE pulses are typically quite complicated, comprising many so-called SASE sub-spikes in the phase space of time–energy joint distributions. Characterizing complicated x-ray pulses, as are commonly produced by xFELs, drives our pursuit of stream-processing angular arrays of electron time-of-flight (eToF) spectrometers. The method of attosecond angular streaking was first applied to the xFEL in Ref. 9. It is based on the measuring angle-resolved photoelectron spectra for noble gas atoms that are so-called “dressed” by a circularly polarized long-wavelength optical field. The circular polarization of the dressing laser field gives a directional push to the x-ray photo-ionized electrons at the instance of release from the atom. This directional push sweeps out the full 2π revolution in one optical cycle period, 33 1/3 fs, in the case of 10 μm wavelength. We discuss the process in depth in Refs. 9 and 10 and outline our more simplified simulation.
We are inspired by recent successes in computational ghost-imaging that highlight the value in using complex varied structures as illumination sources [11, 12]. The method achieves better results than the conventional spatial resolution by treating the measured results statistically for signal co-variance with shot-to-shot illumination variations, thus leveraging the natural fluctuations of xFEL time–energy and even polarization [13] distributions to preferentially enhance the sensitivity to nonlinear x-ray interactions [14, 15]; inference-based pulse reconstructions approaching 1 million frames per second would unlock the natural advantages of our new scientific data fire hoses, the LCLS-II and the APS-U.
Given the dynamic nature of experiments at both xFEL and synchrotron sources, we foresee a need for model adaptation and ultra-high throughput inference. Model adaptation or full re-training can be expected to occur with the cycle of so-called “runs” at these facilities. Owing to their exquisite stability, synchrotrons can be expected to pass hour-long experimental runs where environmental conditions change negligibly and the x-ray source parameters change immeasurably other than the potentially periodic “re-filling” of the ring which is easily accommodated with an intensity normalization. The xFEL is a beast of a very different color. Each shot, coming at up to 1 million per second, grows from a stochastic process and in a dynamic environment of variability in steering magnet currents, undulator settings, injector laser mode variation, and thermal motion of the experimental halls. Furthermore, variations in the experimental plan for the short 5 × 12 h campaigns typically redirect the scientific detectors parameters at the 15–20 min scale. For this reason, we target very rapid re-training of our example model in the 10-min scale rather than the hours scale.
On the inference side, at the xFEL, we aim to treat each of the unique x-ray pulses individually. Since the imminent pulse rate of the LCLS-II will quickly ramp up to 100,000 shots per second over the course of its first year or so, we pursue inference acceleration on a scale that can keep abreast of such an inference rate. It should be noted that the facility is run continuously, not in burst mode, and so small batch sizes for inference, more typically batch size = 1, are expected to be the norm during operation.
In this manuscript, we focus on low batch-size streaming inference with processing rates commensurate with the expected LCLS-II repetition rates. We also discuss data-parallel training on a Graphcore POD16 and an NVidia DGX node, pointing to some of the considerations that impact computing hardware considerations when tackling high-rate training and inference. We conclude with a discussion of high-speed accelerated diagnostics for low-latency real-time adaptive control for a running xFEL experiment.
2 Materials and methods
The physics behind the x-ray pulse reconstruction is based on an external electric field with circular polarization as described in Ref. 9. Reproduced in Figure 1A, photo-electrons are emitted from a target gas with an energy that gets boosted toward the instantaneous direction of the optical laser vector potential
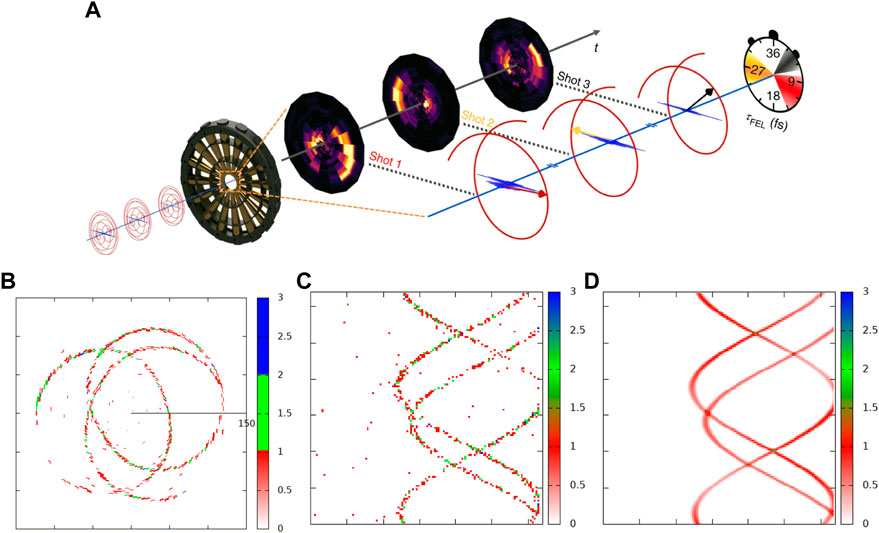
FIGURE 1. (A) Schematic of attosecond angular streaking reproduced from Ref. 9, one of the many use cases for angular array spectrometers for LCLS-II single-shot diagnostics. Sample image of angular streaking of SASE pulses in polar (B) and Cartesian (C) representations. Panel (D) shows the emission probability that is our desired output of the inference model.
We simulate results for an 8-fold over-sampled angular dimension as compared to the planned instrument described in Ref. 7 to help draw a broader generalization of our approach across time-series analyses such as in magnetic fusion applications [16]. The external “dressing” field pushes photo-ionized electrons as described previously. Our focus on simulated sinograms [17] of representative few-spike SASE pulses provides a known ground truth for training the inference model. We perform a random sampling of the electron emission probability distribution, Y (ν, θ), where ν is the photon energy and θ is the emission angle. The sampling is not strictly micro-canonical Monte-Carlo in that we do not require a statistical agreement with the process of SASE growth from the vacuum field fluctuation as in proper SASE pulse simulations. Rather, we prefer an even statistical distribution, not Bolzmann distribution, of the modes in the field such that the training examples for our machine-learned algorithm are not biased to see only that which is statistically more likely. Electron counts are sampled from this distribution to yield the simulated measurement X (ν, θ). Thus, we are attempting to train the model, CookieNetAE [18], to input X (ν, θ) and reproduce the original Y (ν, θ) free of the grainy Poisson statistics of the sampling. Our encoder–decoder network—CookieNetAE [18]—demonstrates our ability to transform the high data rate into a latent representation at the rate of the streaming data pipeline. The loss is computed as the mean-squared error (MSE) between the input image and the original smooth Y (ν, θ) probability distribution. Physically relevant parameters are thus fully constrained by this Y, its recovery from X indicates that the latent representation, at the interface between the encoder and decoder sides, contains sufficient information for any downstream task, be it regression or classification. In effect, one could freeze the encoder-side weights and use the latent representation as a feature vector input for any conceivable downstream inference task. For the purposes of this manuscript, we presuppose that sensor-specific calibrations (time-to-energy) will be implemented in the signal acquisition electronics since the time-to-energy calibration is free to be adjusted independently for each angle of detection in the detector system [7]. To validate the live calibrations, a fraction of the events will be routed as raw data that bypass the upstream pre-processing chain. Since this expected 0.1%, or 1 kHz, rate of raw data could feed adaptive re-training, we, therefore, also use our model to benchmark the acceleration of in situ training.
2.1 Simulation
Specifically, we use forward simulations to build from a ground truth Y to the example X, from which we train the inference model to generate a predicted Y′ that minimizes the MSE (Y, Y′). The probability density function at a given detection angle is a sum of Gaussian distributions, each associated with a single SASE sub-spike j. This emission energy is modified by the so-called dressing laser field according to a sinusoidal variation discussed previously. The angular registration, e.g., the phase ϕj, is determined by the relative delay between jth sub-spike and the carrier field of the dressing optical laser. The mechanism behind this attosecond resolution in x-ray photoelectron angular streaking is detailed in Ref. 9 and 10; and for our purposes, we crudely, but sufficiently, simplify by writing the probability density function for electron emission as:
where n is the number of SASE sub-spikes in a given shot, Aj is the maximum streaking amplitude, E is the energy of detection (horizontal in Figure 1C), and θ is the angle of detection (vertical in Figure 1C). The number of sub-spikes is chosen via a Poisson distribution with a peak at four sub-spikes but many shots include higher numbers of SASE spikes. We build the ground truth probability density function and use it as the output Y′ for training the inference model. As input, we randomly sample that distribution P (E, θ) as shown in Figure 1D, and use the results to fill in a 2-dimensional histogram X image as shown in Figures 1B, C.
2.2 Model and data
For the inference task, we have built a convolutional neural network (CNN) based encoder–decoder model for predicting the smooth probability density function Y′. We have chosen to work with a representative CNN model architecture since the topic at hand is not optimization of the model design, but rather the epochs per second in training and inferences per second in application. Our encoder–decoder model has 343,937 trainable parameters. We use the rectified linear unit (ReLU) activation in all layers; mean-squared error (MSE) as a loss function; and the Adam optimizer with α = 0.001, β1 = 0.9, β2 = 0.999, and ϵ = 10–7. We use a convolution 2D-transpose method with a stride of (2,2) for up-sampling in the decode layers. The model takes a (128, 128, 1) small integer image as input and gives (128, 128, 1) float image of the originating 2D probability function as output. We note the asymmetry in our encoder–decoder as can be seen in Figure 2. This asymmetry is partly used for future developments of an image segmentation model that is beyond the scope of the present manuscript. The details of the model architecture are given in Table 1.

FIGURE 2. Schematic of the encoder–decoder architecture.[18].
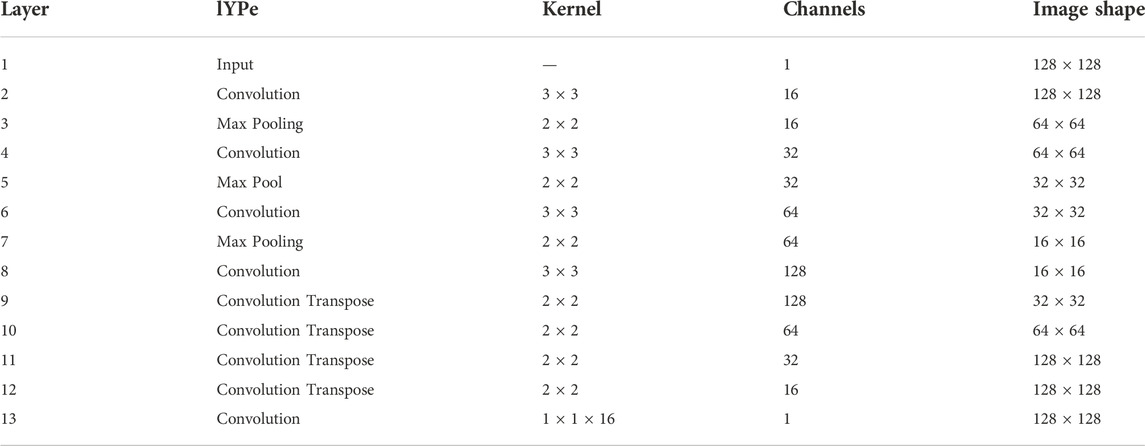
TABLE 1. Network structure of CookieNetAE.[18]. All convolution layers use ReLU activation.
The model exercised here only serves to provide a sample architecture. Since the aim of this work is to demonstrate the performance of the hardware across a range of potential hyper-parameters, we have not explicitly performed so-called “hyper-parameter tuning” in order to find rapid convergence; the training duration and inference throughput as functions of batch size and number of accelerators are our aim, not the accuracy of the model. We do show an example of the performance for the hold-out set in Figure 3, simply to show that the model is not pathological. We run a full 50 epochs of training regardless of the fact that convergence is achieved as early as epoch 10 for some of the match-size configurations.
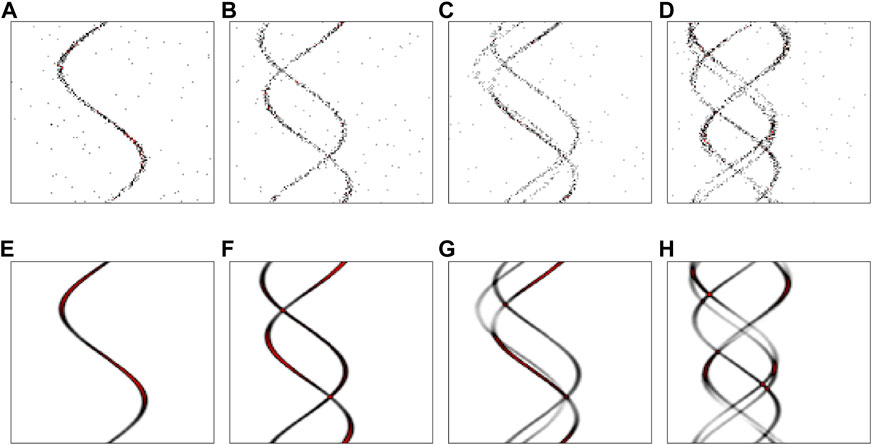
FIGURE 3. (A–D) Input images and (E–H) inference output images as described in Section 1. Examples of 1-4 SASE sub-spikes are shown, respectively, although the training set includes higher numbers of sub-spikes.
The dataset was generated using the open source simulation tool [17]. One million samples were generated for training, validation, and inference using a 90/5/5 split. The training dataset had 900,000 pairs of 128 × 128 images, a grainy (Poisson starved) input image, and a smooth target image. The inference dataset consisted of 50,000 unique 128 × 128 images and was repeated 10 times in the case of the Graphcore Intelligence Processing Units (IPUs) to provide a sufficient workload. Training and inference results for the IPU case were collected on a direct attached Graphcore POD16—four interconnected M2000s, each with 4 IPUs.
For the A100 graphics processing units (GPUs), only single precision, 32-bit floating points (FP32) were tested, while on the IPU, Accumulating Matrix Product (AMP) and Slim Convolution (SLIC) instructions were used for high-performance multiply–accumulate sequences for both 32-bit (FP32) and 16-bit (FP16) precision formats [19]. The two different mixed-precision arithmetic schemes for the IPU case are as follows:
• FP32.32: AMP operation with FP32 input multiplicands as well as FP32 partial sums of products
• FP16.16: AMP operation with FP16 input multiplicands and FP16 partial sums of products.
In the case of the IPU, the command line utility PopRun was used to create multiple instances and launch them as distributed data-parallel applications on the Graphcore POD16 compute system, either on a single server or multiple servers within the same POD [20].
In our setup, a single host server with SDK 2.5 was used with the number of instances being set equal to the number of model replicas for the inference case. For training, the number of instances was set to half the number of model replicas. Horovod was used to distribute the inference and training across 1-8 A100 GPUs in a single Nvidia-DGX node in Argonne’s ThetaGPU cluster. Samples of the input images and output predictions are shown in Figure 3.
3 Results
3.1 Inference
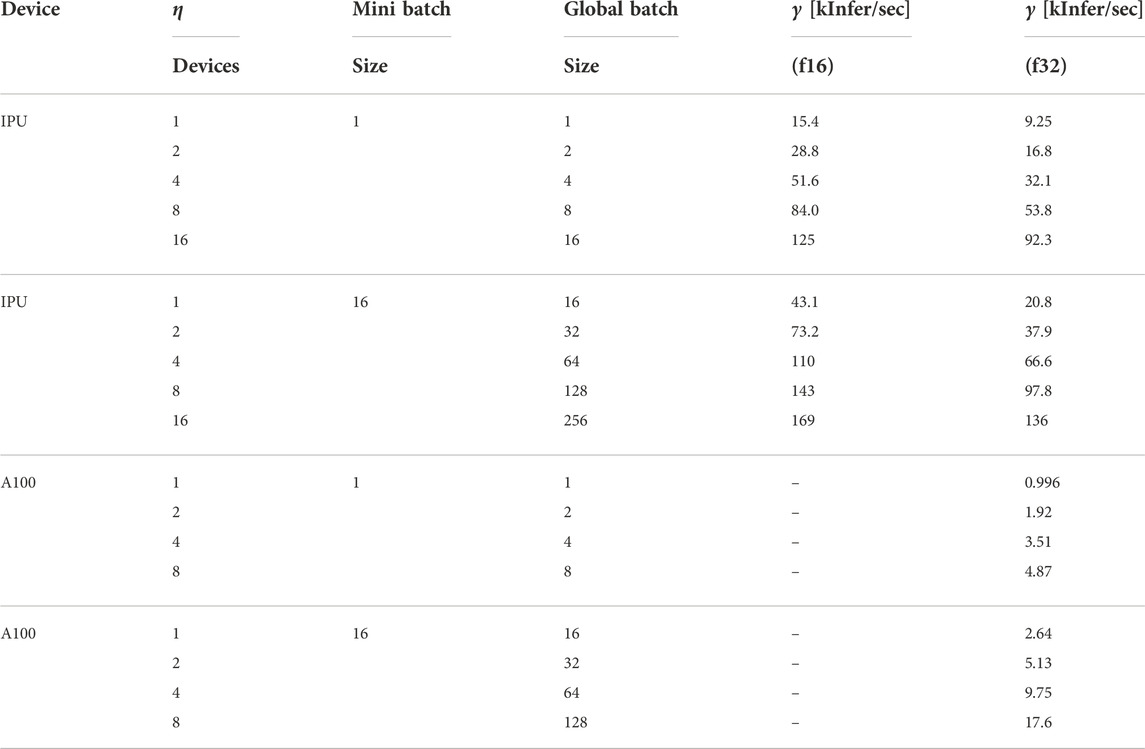
Our primary focus in this manuscript is the demonstration of inference throughput that approaches compatibility with the eventual 1 million shots per second rate of the LCLS-II xFEL. We used CookieNetAE [18] trained on the simulation as described previously to process a stream of images across a range of available instances of GPU and IPU inference accelerators. Our results are presented graphically in Figure 4A as the inference rate γ versus number of accelerators η used in the data-parallel mode. Figure 4B gives an example of the inference throughput versus the global batch size for the case of one DGX node of eight GPUs and two interconnected POD4 nodes with four IPUs each. We note that the GPU case is not leveraging TensorRT for inference so as to maintain negligible code changes for compiling models to IPU and GPU.
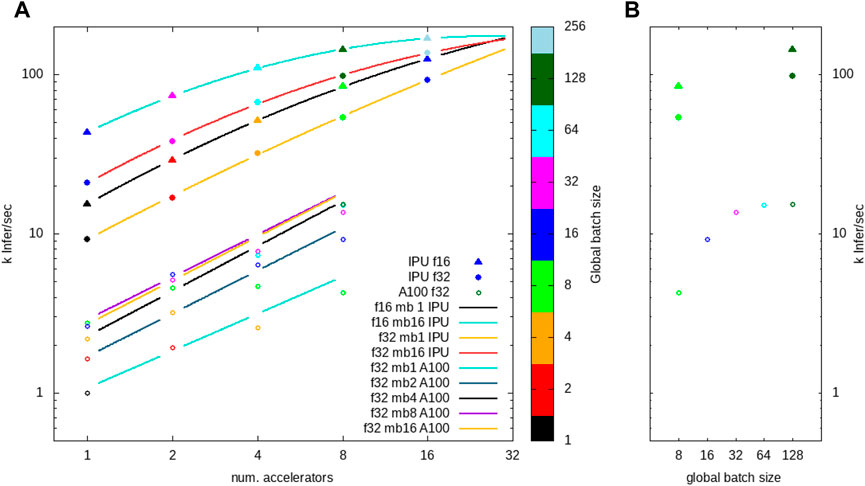
FIGURE 4. (A). Inference results versus number of accelerators used in the data-parallel operation using 1–16 IPUs and 1–8 A100 GPUs. (B). Results versus global batch size for the case of eight accelerators, and the symbol definitions are identical with panel (A). The fitting results are given in Table 2.
Table 2 presents fitted coefficients based on the pseudo-inverse method (Eqs 3–5) for Taylor expansion fitting the log-of-rate y = log2 γ versus the log-of-number x = log2 η. In this logarithmic representation, 2a is the single accelerator, η = 1 is the rate, and the coefficient b represents the scaling power law with an increasing number of accelerators, e.g., the “slope” in the Taylor expansion of the data around η = 1, x = 0 in log-space; Θ is the vector of polynomial expansion coefficients (Eq. 7).
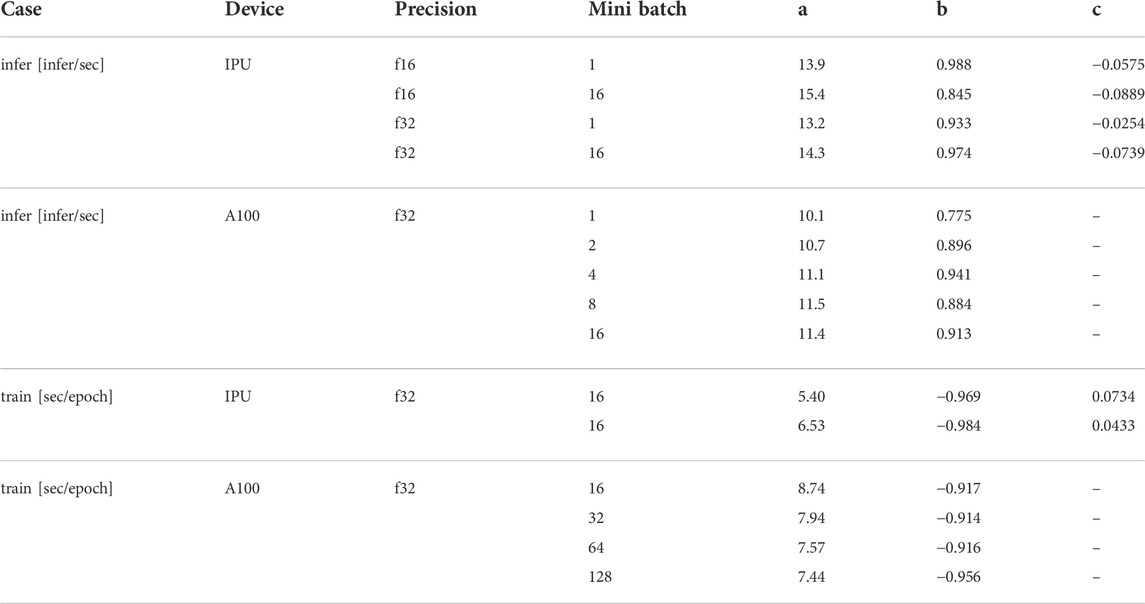
TABLE 2. Coefficients for the following general formula described in Eqs. 3 and 7. The curves follow along the constant mini batch (mb) such that the global batch size = mb × η. Note that only four or less evaluation points for the A100 case require we fit only coefficients a and b.
where
We can see from Figure 4A that the fits deviate from linear as more than two or four IPUs are used. This deviation is seen both from coefficient b⪅1 and from the quadratic term c⪅0. We attribute this to bandwidth limitation in the IPU interconnect fabric as indicated by the extrapolated trend—to be always taken with a grain of salt—that would extend the lines toward a common saturation at about 200 k inferences per second. Of course, this particular saturation limit is highly dependent on the incoming raw data geometry, even for very similar models. Since we are targeting a rate 5 times higher than that achieved here, we are actively pursuing a reduced representation that alleviates this data ingestion limitation while still preserving the image integrity and information. Our GPU results were all run with a single DGX machine using the eight A100 GPUs in the same data-parallel inference mode. Inference results for all tested configurations are presented in Table 3.
3.2 Training
Although not the principle goal for this study, the ability to train models directly at the source for both IPUs and GPUs motivated our investigation of the time to train these devices in the data-parallel mode as well. From Table 4, we find a training time for 50 epochs that accelerate from nearly an hour with 1 IPU at batch size 16 (FP16) to only 6 min with 16 IPUs. We see in Figure 5 that the general trend of inverse scaling (1/η) dominates until about eight accelerators for a constant mini-batch size, e.g., the global batch size scales linearly with the number of accelerators. One can see from the result for constant global batch size (symbol color) for A100 GPUs that splitting global batches across increasing accelerators quickly suffers diminishing returns for global batch sizes below about 128 (green, open circles). This coincides with the rule of thumb suggesting 64 or 128 local batch sizes given the DGX configuration of eight accelerators. With up to 16 IPUs, hosted as four interconnected M2000 nodes, each with four IPUs, we find a very nearly ideal expected inverse scaling 1/η as we hold constant the mini batch size of 16 and use PopRun to spread the workload across multiple IPUs and multiple M2000 nodes.
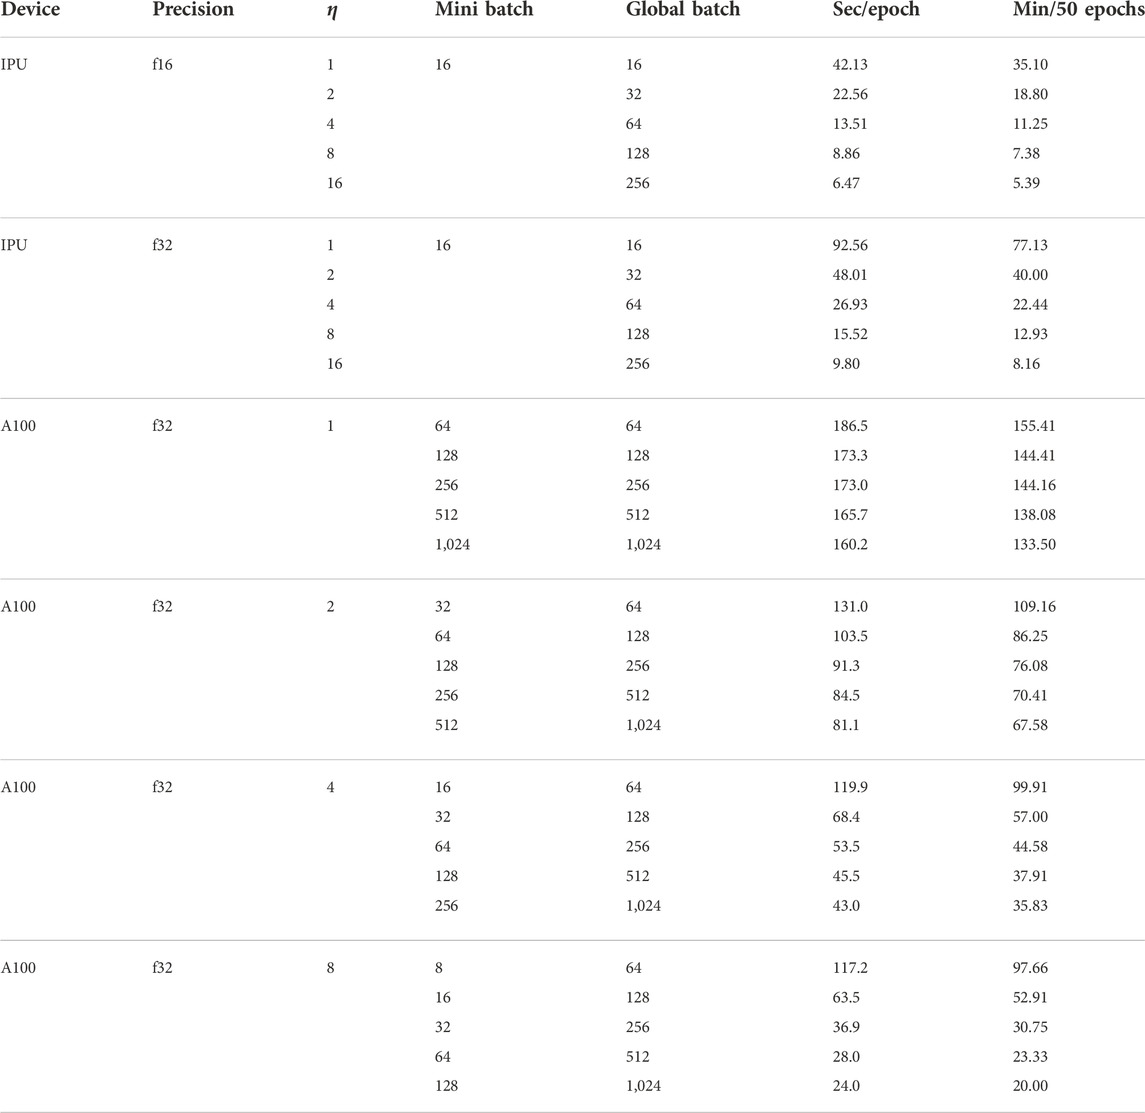
TABLE 4. IPU train time considered in seconds per epoch based on the average results for 50 epochs of 900 k training images per epoch.
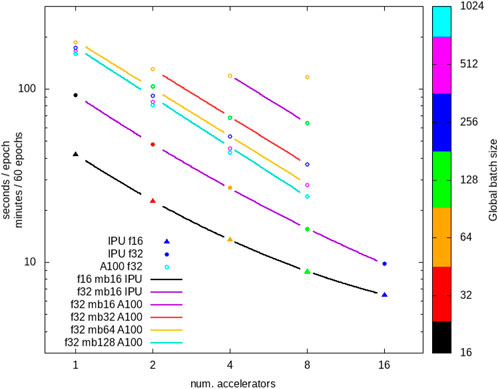
FIGURE 5. Training time per epoch (900 k images in set) versus number of accelerators for various global batch sizes. We indicate FP16/FP32 for the IPU case and note that all A100 results are based on the FP32 tests. The trend curves follow the coefficients given in Table 2.
Table 2 shows our log-space Taylor coefficients for training. The coefficient b⪆ − 1 is quite close to an ideal inverse power law, and there is only a very small quadratic term c⪆0. Even given the communications bandwidth limitation, for 16 IPUs at FP16 precision, we find from Table 4 that we can achieve full-model training with 50 epochs of 900 k images in under 6 min.
4 Discussion
The potential impact of scientific machine learning [21] for incorporating data analysis as a streaming processing pipeline from source to data center [22] cannot be overstated for next generation accelerator-based user facilities such as the LCLS-II [23] and the APS-U [24]. The growing adoption of transformer models [25-26] even outside the domain of natural language processing [27-29] is sure to extend to the scientific data interpretation domain. We, therefore, expect that embedding models will work their way upstream, eventually into the sensor electronics themselves. For this reason, we have chosen an encoder–decoder network, in particular, one that has no skip connections, as our example inference workflow for the upcoming single-shot 1 million frames per second LCLS-II attosecond streaking x-ray diagnostic.
We demonstrate the ability to produce a latent feature vector that fully captures the information contained in the simulated experimental results (Figures 3A–D) while effectively removing any impact of noise. We do so by recovering the original smooth probability distribution (Figures 3E, F) used to create the simulated experimental results. Our encoder–decoder model, CookieNetAE [18], is therefore a stand-in for the upstream encoding and embedding layers for transformer architectures.
Larger models pose challenges for streaming data processing, particularly so for real-time control decisions. Although CookieNetAE was used as a surrogate for transformer models, the high fidelity in image reconstruction of Figure 3 demonstrates that the number of composite sinusoids is fully encoded in the latent-space feature vector. As such, one of the potential use cases of the encoding layers of CookieNetAE could be the rapid prediction of a particular shot’s SASE complexity from, e.g., Figure 3: (A) triggers simple-binned single-spike reference accumulator, (B) triggers 2D histogram accumulation based on double-pulse relative delay and energy separation, and (C) and (D) trigger the full-feature vector to be stored along with downstream detector results for offline statistical treatments. Since the LCLS-II will quickly ramp the shot rate from few tens of kF/sec to a million frames/sec, these data-routing decisions must keep abreast of the rate; they must inform and direct the path of the streaming analysis for each shot as it is acquired [30]. Our A100 inference results are consistent with the early expectation of 10 kF/s and the Graphcore POD16 can carry us sufficiently beyond the 100 kF/s rate needed for the rapid increase in the repetition rate expected. We must however continue to develop leaner models, bandwidth efficient data ingestion, and faster inference environments to enable the full million frames per second rate expected in the coming few years.
In pursuing accelerated inference at the sensor edge, we also demonstrated that models can be re-trained in situ with the very same hardware for both GPU and IPU. Although not a requirement for our particular case, it does however raise a significant opportunity given the fact that 0.1% raw data could be leveraged locally for model re-training. Combined with software-defined memory provisioning [31], incoming anomaly events could be held locally in system memory for inclusion in updated training sets and used in rapid re-training of the embedding model. This small fraction of raw data nevertheless accounts for up to 1 GB/s of the continuous data stream. The prospect of dynamically provisioned TB-scale local memory directly at the acquisition node that supports accelerated local training as the experimental conditions vary throughout an experimental shift would truly enable a continuously adaptive autonomous experimental ecosystem.
Data availability statement
The datasets generated and used for this study can be accessed with the code in CookieSimSlim v1.1.0 https://github.com/ryancoffee/CookieSimSlim/archive/refs/tags/v1.1.0.tar.gz. The analysis results are compiled in the Tables.
Author contributions
MK performed and collected all IPU results and ZL performed and collected all GPU results. NL and RC designed the initial CookieBoxAE model architecture, while MK adapted it for use in IPU and ZL adapted for ThetaGPU. RC built the data simulation code and performed the analysis and presentation of all results. MK and RC contributed equally to the composition of the manuscript with additional contributions from ZL.
Funding
This work was predominantly funded by the Department of Energy, Office of Science, Office of Basic Energy Sciences under Field Work Proposal 100643 “Actionable Information from Sensor to Data Center.” The development of the algorithm for simulation was funded by the Department of Energy, Office of Science, Office of Basic Energy Sciences under Field Work Proposal 100498 “Enabling long wavelength Streaking for Attosecond X-ray Science.”
Acknowledgments
RC acknowledges support from the Department of Energy, Office of Science, Office of Basic Energy Sciences, for funding the development of the detector array itself under Grant Number FWP 100498 “Enabling long wavelength Streaking for Attosecond X-ray Science.” He also acknowledges the synergistic support for computational method development by the Office of Fusion Energy Science under Field Work Proposal 100636 “Machine Learning for Real-time Fusion Plasma Behavior Prediction and Manipulation.” This research used resources of the Argonne Leadership Computing Facility, a DOE Office of Science User Facility supported under Contract DE-AC02-06CH11357, for collecting GPU-related benchmarks.
Conflict of interest
MK was employed by Graphcore, Inc.
The remaining authors declare that the research was conducted in the absence of any commercial or financial relationships that could be construed as a potential conflict of interest.
Publisher’s note
All claims expressed in this article are solely those of the authors and do not necessarily represent those of their affiliated organizations, or those of the publisher, the editors, and the reviewers. Any product that may be evaluated in this article, or claim that may be made by its manufacturer, is not guaranteed or endorsed by the publisher.
References
1. Wernet P, Kunnus K, Josefsson I, Rajkovic I, Quevedo W, Beye M, et al. Orbital-specific mapping of the ligand exchange dynamics of fe(co)5 in solution. Nature (2015) 520:78–81. doi:10.1038/nature14296
2. Kraus D, Vorberger J, Pak A, Hartley NJ, Fletcher LB, Frydrych S, et al. Formation of diamonds in laser-compressed hydrocarbons at planetary interior conditions. Nat Astron (2017) 1:606–11. doi:10.1038/s41550-017-0219-9
3. Bekx JJ, Lindsey ML, Glenzer SH, Schlesinger K-G. Applicability of semiclassical methods for modeling laser-enhanced fusion rates in a realistic setting. Phys Rev C (2022) 105:054001. doi:10.1103/PhysRevC.105.054001
4. Durdagi S, Dag C, Dogan B, Yigin M, Avsar T, Buyukdag C, et al. Near-physiological-temperature serial femtosecond x-ray crystallography reveals novel conformations of sars-cov-2 main protease active site for improved drug repurposing. bioRxiv (2020).
5.LCLS. Lcls-ii: A world-class discovery machine lcls (2022). Available at: slac.stanford.edu/lcls-ii.
6. Thayer JB, Carini G, Kroeger W, O’Grady C, Perazzo A, Shankar M, et al. Building a data system for lcls-ii. New York, NY: Institute of Electrical and Electronics Engineers Inc. (2018). doi:10.1109/NSSMIC.2017.8533033
7. Walter P, Kamalov A, Gatton A, Driver T, Bhogadi D, Castagna J-C, et al. Multi-resolution electron spectrometer array for future free-electron laser experiments. J Synchrotron Radiat (2021) 28:1364–76. doi:10.1107/S1600577521007700
8. Pellegrini C, Marinelli A, Reiche S. The physics of x-ray free-electron lasers. Rev Mod Phys (2016) 88:015006. doi:10.1103/RevModPhys.88.015006
9. Hartmann N, Hartmann G, Heider R, Wagner MS, Ilchen M, Buck J, et al. Attosecond time–energy structure of x-ray free-electron laser pulses. Nat Photon (2018) 12:215–20. doi:10.1038/s41566-018-0107-6
10. Li S, Guo Z, Coffee RN, Hegazy K, Huang Z, Natan A, et al. Characterizing isolated attosecond pulses with angular streaking. Opt Express (2018) 26:4531–47. doi:10.1364/OE.26.004531
11. Shapiro JH. Computational ghost imaging. Phys Rev A (Coll Park) (2008) 78:061802. doi:10.1103/PhysRevA.78.061802
12. Padgett MJ, Boyd RW. An introduction to ghost imaging: Quantum and classical. Phil Trans R Soc A (2017) 375:20160233. doi:10.1098/rsta.2016.0233
13. Sudar N, Coffee R, Hemsing E. Coherent x rays with tunable time-dependent polarization. Phys Rev Accel Beams (2020) 23:120701. doi:10.1103/PhysRevAccelBeams.23.120701
14. Giri SK, Alonso L, Saalmann U, Rost JM. Perspectives for analyzing non-linear photo-ionization spectra with deep neural networks trained with synthetic Hamilton matrices. Faraday Discuss (2021) 228:502–18. doi:10.1039/D0FD00117A
15. Kumar Giri S, Saalmann U, Rost JM. Purifying electron spectra from noisy pulses with machine learning using synthetic Hamilton matrices. Phys Rev Lett (2020) 124:113201. doi:10.1103/PhysRevLett.124.113201
16. Jalalvand A, Kaptanoglu AA, Garcia AV, Nelson AO, Abbate J, Austin ME, et al. Alfvén eigenmode classification based on ECE diagnostics at DIII-d using deep recurrent neural networks. Nucl Fusion (2021) 62:026007. doi:10.1088/1741-4326/ac3be7
17. Coffee RN. Cookiesimslim: Slim simulator for lcls-slac cookiebox detector (2022). Available at: https://github.com/ryancoffee/CookieSimSlim.
18. Layad N, Liu Z, Coffee R. Open source implementation of the cookienetae model (2022). Available at: https://github.com/AISDC/CookieNetAE.
19.Graphcore. Mixed-precision arithmetic for ai: A hardware perspective docs (2022). Available at: graphcore.ai/projects/ai-float-white-paper/en/latest/index.html.
20.Graphcore. Popdist and poprun: User guide docs (2022). Available at: graphcore.ai/projects/poprun-user-guide/en/latest/index.html.
21. Sanchez-Gonzalez A, Micaelli P, Olivier C, Barillot TR, Ilchen M, Lutman AA, et al. Accurate prediction of x-ray pulse properties from a free-electron laser using machine learning. Nat Commun (2017) 8:15461. doi:10.1038/ncomms15461
22. Liu Z, Ali A, Kenesei P, Miceli A, Sharma H, Schwarz N, et al. Bridging data center ai systems with edge computing for actionable information retrieval (2022).
23. Schoenlein R. New science opportunities enabled by lcls-ii x-ray lasers. SLAC Report SLAC-R-1053 (2015). p. 1–189.
24. Hansard B. Advanced photon source upgrade will transform the world of scientific research (2020). Available at: www.anl.gov/article/advanced-photon-source-upgrade-will-transform-the-world-of-scientific-research.
25. Devlin J, Chang M, Lee K, Toutanova K. Bert: Pre-training of deep bidirectional transformers for language understanding. (2018). CoRR abs/1810.04805.
26. Radford A, Wu J, Child R, Luan D, Amodei D, Sutskever I. Language models are unsupervised multitask learners (2018).
27. Payne C. Musenet (2019). Available at: openai.com/blog/musenet.
28. Naseer MM, Ranasinghe K, Khan SH, Hayat M, Shahbaz Khan F, Yang M-H. Intriguing properties of vision transformers. In: Advances in neural information processing systems. Ranzato M, Beygelzimer A, Dauphin Y, Liang P, and Vaughan JW, editors, 34. Curran Associates, Inc. (2021). p. 23296–308.
29. Khan S, Naseer M, Hayat M, Zamir SW, Khan FS, Shah M. Transformers in vision: A survey (2022). Available at: https://arxiv.org/pdf/2101.01169.pdf.
30. Corbeil Therrien A, Herbst R, Quijano O, Gatton A, Coffee R. Machine learning at the edge for ultra high rate detectors. (2019). 1–4. doi:10.1109/NSS/MIC42101.2019.9059671
31. Kove I. Kove machine learning white paper (2022). Available at: kove.net/downloads?file=machine-learning.pdf.
Keywords: machine learning, edge computing, AI hardware, low latency, x-ray, free-electron laser, GPU, Graphcore
Citation: Kraus M, Layad N, Liu Z and Coffee R (2022) EdgeAI: Machine learning via direct attached accelerator for streaming data processing at high shot rate x-ray free-electron lasers. Front. Phys. 10:957509. doi: 10.3389/fphy.2022.957509
Received: 31 May 2022; Accepted: 16 November 2022;
Published: 13 December 2022.
Edited by:
Robert Garnett, Los Alamos National Laboratory (DOE), United StatesReviewed by:
Christine Darve, European Spallation Source, SwedenSaravana Prakash Thirumuruganandham, Universidad technologica de Indoamerica, Ecuador
Markus Diefenthaler, Jefferson Lab (DOE), United States
Copyright © 2022 Kraus, Layad, Liu and Coffee. This is an open-access article distributed under the terms of the Creative Commons Attribution License (CC BY). The use, distribution or reproduction in other forums is permitted, provided the original author(s) and the copyright owner(s) are credited and that the original publication in this journal is cited, in accordance with accepted academic practice. No use, distribution or reproduction is permitted which does not comply with these terms.
*Correspondence: Ryan Coffee, Y29mZmVlQHNsYWMuc3RhbmZvcmQuZWR1
 Mike Kraus
 Naoufal Layad
 Zhengchun Liu
 Ryan Coffee