- Department of Cardiology, Erasmus MC University Medical Center, Rotterdam, Netherlands
Photoacoustic (PA) signals are typically broadband in nature. The bandwidth of PA signals depends on the size distribution of the underlying chromophores. Typically, conventional ultrasound (US) transducers, designed for pulse-echo imaging, have limited bandwidth, which reduces their sensitivity to the broadband PA signal. The rejection of out-of-band signals impairs image reconstruction, leading to the loss of image details. Visualization of biological structures, in particular deep targets with a range of sizes requires large acquisition bandwidth. In this work, we combine PA data acquired with two conventional US array probes with complementary frequency bands in order to widen the bandwidth. However, the two conventional transducers also differ in sensitivity and combining the data results in misrepresentation of PA signal strengths. Therefore, in this article we report a novel PA-based method to calibrate the relative sensitivities of the transducers. The proposed method was applied in various scenarios, including imaging vascular structures in vivo. Results revealed that it is feasible to visualize targets varying widely in sizes while combining complementary information acquired with dual US transducers. In addition, the application of sensitivity compensation ratios avoids misrepresentation in the imaging scheme by accounting for sensitivity differences of both transducers during image acquisition.
Introduction
Photoacoustic (PA) imaging combines the spatial resolution of ultrasound (US) imaging with optical absorption contrast to provide functional and structural information about an irradiated tissue sample [1–3]. In conventional pulse-echo mode US imaging, various types of transducer array probes of different frequency ranges and geometry are used, each tailored to a specific application [4, 5]. Transducer specifications are typically based on the target location, the field of view, penetration depth, and resolution requirements. In photoacoustics, the frequency bandwidth of the emitted acoustic pressure depends on the size distribution of the optical absorbers in the field of view: larger absorbers emit primarily lower frequencies, while small objects generate higher frequency acoustic waves [6–11]. For example, a target of size 1 mm emits a frequency spectrum with center frequency at ∼0.5 MHz while a 60 μm target emits a spectrum with center frequency ∼11 MHz [12]. Optically deep biological targets, like blood vessels, tumors, and lipidic deposits exhibit a range of sizes. Hence the emission spectra cover a wide frequency range. It is important that the ultrasound detection bandwidth matches the emission spectra of the target chromophore for optimal sensitivity and image reconstruction. Conventional (commercially available) US transducers, which are commonly used for PA imaging, have limited sensitivity to such broadband PA signals [13]. The rejection of out-of-band signals impairs receive sensitivity, leading to the loss of signal-to-noise ratio. It also causes a loss of image fidelity: the omission of low frequencies impairs the ability to reconstruct large objects while retaining PA signals that are generated by an object’s edges, where high frequencies are present. This phenomenon is known as the “boundary buildup” effect [14]. Conversely, a lack of high frequencies in the received signal causes a loss of detail and border definition. Hence, there is a need to widen reception bandwidth to enhance sensitivity and k-space sampling in PA imaging.
In pulse-echo US imaging, researchers have utilized dual/multiple frequency transducers for superharmonic imaging or to achieve an improved depth of penetration and spatial resolution [15–21]. However, these probes, designed for harmonic imaging, are mostly manufactured with large gaps in their frequency response, which results in incomplete reconstructions and therefore is not suitable for sensing broadband PA signals. A lithium niobate dual frequency transducer has been fabricated with center frequencies 14.9 MHz and 4.9 MHz to be suitable for both pulse-echo US and PA imaging using a single transducer element [22]. Fabricating such a transducer is complex and extending this concept to 2D imaging requires translating the crystal along the imaging plane, which is time-consuming.
In PA imaging, different approaches for wide-bandwidth imaging have been adopted. Bandwidth improvement can be achieved either by using dedicated transducer designs or by using multiple conventional transducers that have complementary bandwidths. Custom-built transducers that utilize alternating, concentric, or stacked piezoelectric elements of varying thickness have been demonstrated to be capable of receiving broadband PA signals [23, 24]. Some of these custom-built transducers have been demonstrated for in vivo PA acquisitions such as for psoriasis, atherosclerotic plaque, and breast cancer [25–29]. However, most of them are complex to design and manufacture and are tailored to specific applications. For instance, the ultrasound transducers developed for optoacoustic mesoscopy are suitable for visualizing smaller superficial targets [25, 28]. Such a probe is however not suitable for imaging larger targets situated at deeper locations. Utilizing a combination of conventional US transducers with complimentary bandwidths is straightforward in terms of probe realization [13, 30]. The challenge then is, combining information acquired from such distinct transducers. These transducers are not only different in spectral bandwidth behavior but also vary in sensitivity caused by differences in transducer material (piezoelectric ceramic, crystal, composite), geometry (pitch, number of elements, elevational length, elevational focus), probe electronics, the presence of a lens, and other factors caused by specific manufacturing practices adopted by different vendors. Consequently, when combining imaging data from multiple complementary US transducers, the signals from all probes need to be carefully calibrated to avoid misrepresentation in the combined image. Most articles that utilize custom or conventional transducers overlay different frequency data in a different colormap. In this work, we aim at accounting for this sensitivity difference and mimic acquisition with a single transducer as closely as possible. We attempt to tackle this using transducer calibration and combining the data at the post-beamformed RF (radio frequency) level before envelope detection.
Several methods to calibrate and measure absolute US transducer sensitivity are described in literature. It is most common to measure the transmit transfer function, receive transfer function, or pulse-echo response of a transducer; either with the use of a calibrated hydrophone, a known conventional US transducer, or a combination of both in a sequence of pitch-catch setups [17, 31, 32]. Characterization with a hydrophone is complex and highly sensitive to alignment. On the other hand, using conventional US transducers that are still bandlimited is not sufficient for calibrating wideband photoacoustic responses.
Recent reports have demonstrated the feasibility of characterizing US transducers using the response to PA signals [33–36]. In order to obtain a wideband PA response, the illuminated target must be much smaller than the axial resolution of the PA system. Furthermore, the resultant PA signal amplitude is directly proportional to the illuminated target volume, which limits the signal-to-noise ratio, particularly while sensing with low-frequency transducers that are most mismatched with signals from a small source. As an alternative, direct short-pulse illumination of the sensing element [33] or illuminating a large rectangular slab of highly absorbing material [34–36] can yield a wideband response. Both methods calibrate the transducer’s frequency response with emphasis only on the frequency axis and bandwidth of the spectrum. The amplitude of the spectrum, which is a function of the transducer’s geometric parameters such as element size, lens, and element layout is usually ignored.
In this work, the primary aim is to utilize two conventional US transducers and report a novel method of calibration that is necessary to combine PA signals at the RF data level in a quantitatively consistent way, which is important in applications that require an accurate estimation of PA. To achieve optimal calibration of the transducers occupying complementary frequency bands and having non-identical geometric parameters, accurate measurement of the spectral amplitude is required. For this purpose, we generate PA signal from a known source through experiments and simulation, and derive an attenuation-dependent sensitivity compensation ratio to merge data acquired on both probes. In addition, the compensated data are combined before envelope detection to mimic acquisition with a single broadband US transducer as closely as possible. We then validate the performance of the proposed dual-transducer-bandwidth-enhanced imaging setup by imaging targets with a known dimension and demonstrate the effect in biological imaging ex and in vivo. US transducers with a reception bandwidth of ∼1–12 MHz were used in this paper, however the same methodology can also be applied for other frequency ranges. Results obtained demonstrate that the proposed imaging method improves imaging sensitivity and capability of visualizing vascular structures ranging widely in size.
Materials and methods
Derivation of sensitivity compensation ratio (S)
To perform transducer characterization using the PA effect, it is crucial that the frequency spectrum of the PA signal has a wideband behavior in the Fourier domain over the entire range of frequencies covered by the transducers of interest. Fundamental equations that govern this analysis are detailed in [36] but are briefed in relevance to the context of this paper below.
In an acoustically homogeneous medium, when thermal confinement conditions are satisfied, the PA pressure
where
The heating function
where R = |x-x’| and the pressure is an integration over spherical surface A with a radius of
To calibrate the system using photoacoustics, we need to extract
The focus of this paper is to measure and calibrate acoustic sensitivities of two dissimilar detectors having impulse responses
If we take the Fourier transform of Eqs 4, 5, we get
Our calibration method is based on measuring the amplitudes of the Fourier transform of known PA pressure (P1 and P2) recorded by two different US transducers having detector responses (
In a dual transducer scenario, two conventional transducers are bandlimited with unequal frequency spectra, centered at say
The above equation when further simplified by substituting from Eqs 6, 7 becomes,
The above-derived compensation ratio
Experimental setup and simulation
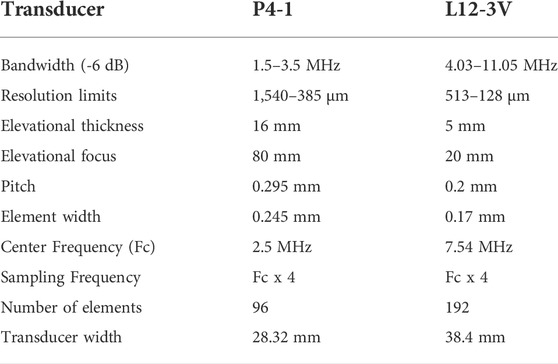
In this paper, the P4-1 (Philips, Eindhoven, Netherlands) and L12-3v (Verasonics, Kirkland, United States) transducers were utilized for imaging. Further details about the transducers are tabulated in Table 1. A 60 µm diameter cylindrical target, a black human hair measured with a micrometer (nr. 102-301, Mitutoyo, Sakado, Japan) with an accuracy of ±2 μm, was used as a PA source that generates wide bandwidth signals. Experiments were performed using a Verasonics US system (Vantage 256, Kirkland, WA, United States). A tuneable diode-pumped OPO laser (Spitlight EVO-OPO, 100 Hz PRF, 5 ns pulse width, 800/1,200 nm, Innolas GmbH, Germany) was used for illuminating the samples.
A similar scenario was mimicked in a simulation performed using k-Wave Toolbox in MATLAB® (The MathWorks, Inc., MA, United States) [38]. In a k-space grid of 1024x1024 grid points with a voxel size of 2 μm, an initial pressure distribution of a 60 μm disc was positioned in a homogeneous propagating medium, with a speed of sound of 1,480 m/s. A 60 μm circular source in 2D was created, which is equivalent to a cylindrical target in 3D, and its corresponding broad bandwidth Fourier spectrum
Calibration experiments
The calibration experiments were performed with PA targets positioned in a water medium and an attenuating medium. Water has a low attenuation coefficient of 0.0022 dB/cm/MHz in comparison to the attenuating medium or soft tissue [39]. Hence its attenuation is considered negligible over the range of frequencies used for calibration [40–42].
Cylindrical PA targets of 60 μm diameter were immersed in a cylindrical tank filled with water. The targets were kept perpendicular to the transducer at depths of 20, 40, 60, and 80 mm from the surface of the transducer. The targets were illuminated uniformly at a wavelength of 800 nm with a slit fiber bundle. The slit was wider than the elevational width (21 mm in the y-direction) of the transducers, mimicking an infinitely long cylindrical target as shown in the schematic in Figure 1. PA signals generated from the target at each depth were recorded by L12-3v and P4-1 using the Verasonics system. The transducers were held by a custom-made rigid transducer holder for reproducible positioning in the same plane. Measurements with both transducers were repeated 20 times. Each measurement was performed by alternating acquisition between the two transducers. In between measurements, the holder was repositioned and realigned to create an ensemble of independent realizations and for averaging the effects of small variations in angular alignment. The position accuracy in the depth direction over 20 repetitions was measured by calculating the displacement between the PA peak signal recorded on L12-3v and P4-1. The root mean square variability in probe position over 20 repetitions was determined to be 173 μm corresponding to 0.85 wavelengths of the L12-3v probe.
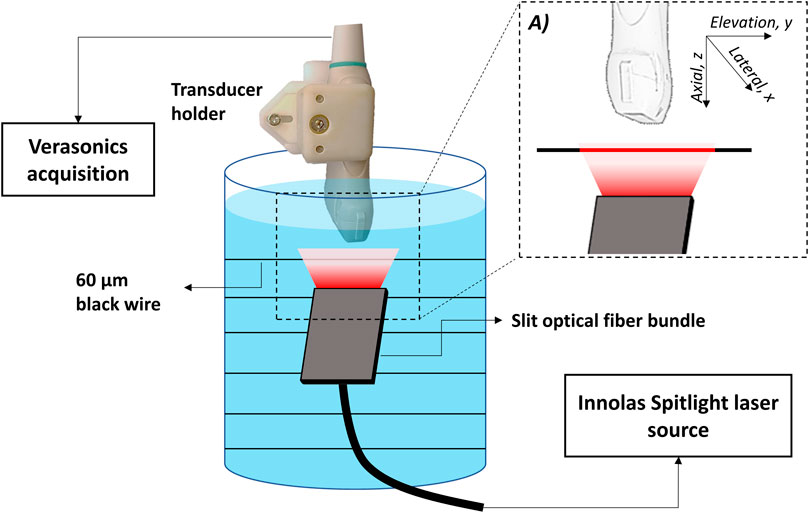
FIGURE 1. Schematic of image acquisition setup for the calibration experiment. (A) zoomed-in portion of the light illumination and detection.
To test the robustness of the setup, the above experiment was repeated in an acoustically attenuating medium made with an agar mixture of 6% concentration (Sigma-Aldrich Corp., St. Louis, MO) in the same cylindrical container. In this case, it is to be noted that the frequency dependency of the acoustic attenuation contributed by agar medium, causes differences between amplitude spectra of L12-3v and P4-1 [43]. If the setup is robust, the only difference between the water and attenuating medium is caused by the added acoustic attenuation. The measurements were repeated 10 times with the same methodology of data acquisition.
The attenuation coefficient α of the 6% agar mixture was measured to be 0.15 dB/cm/MHz using a pulse-echo substitution setup. The setup consisted of a single element crystal of 5 MHz center frequency (Panametrics V309, Olympus, Inc.) mounted within a water tank in front of a reflecting plate with a known distance. Attenuation was measured by recording the US signal with and without the sample in its path.
For processing, a total of 500 frames of raw RF data acquired from each of the transducers were averaged. Data recorded by 10 consecutive transducer elements located closest to the target were selected for analysis. The signal recorded by each selected element was then windowed around the PA peak with a pulse length of 8λ, calculated at the center frequency of L12-3v (7.54 MHz) and P4-1 (2.5 MHz). The windowed pulse was Fourier transformed to obtain the frequency spectra. A fixed window length as a function of λ was chosen to ensure an equal number of selected samples and a fair comparison of spectral amplitude for both transducers. The pulse was zero-padded before FFT to improve frequency sampling. The above steps were repeated for the selected 10 echo lines and averaged post FFT. The average sensitivity compensation ratio (S) over frequencies within -3 dB level of the spectra was then computed using Eqn. (8). Eqn. (8) can be written as
where,
The above formula estimates the S for L12-3v relative to P4-1. The methodology behind obtaining S is schematically represented in Figure 2. As the ratio between amplitudes obtained in simulation is a constant, Eq. 10 is simplified by substituting known values from the simulation of a 60 µm target,
Using Eq. 11, the value of S was measured for the target located at each depth by averaging all the individual measurements to obtain depth-dependent sensitivity compensation between the two transducers. The value of S calculated from the water medium is expected to remain nearly constant over depth due to the negligible attenuation coefficient of water and the PA target emulates an infinite cylinder scenario along the elevational direction. This nullifies the depth effect caused by different elevational focal lenses of the two transducers.
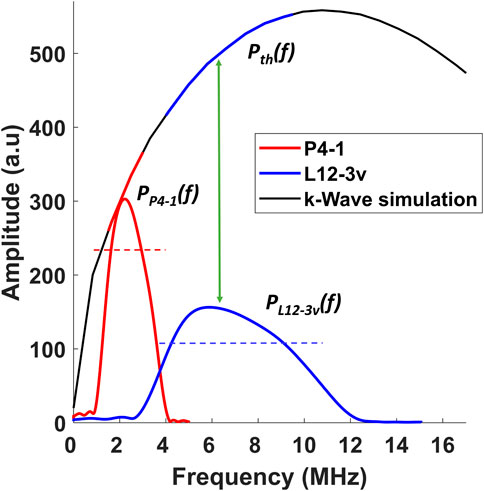
FIGURE 2. Visual description of the methodology used for calculating the sensitivity compensation ratio mathematically represented in Eq. 10. The dotted blue and red lines represent the range of the frequencies within the −3 dB level. The solid blue and red lines represent the range of frequencies on
The same method was used to obtain the sensitivity compensation ratio for the attenuating medium and will be denoted as
It has been shown in literature that attenuation spectra typically have a close to linear dependency with frequency [44]. Hence α was applied in a linearly increasing manner on the frequency spectra.
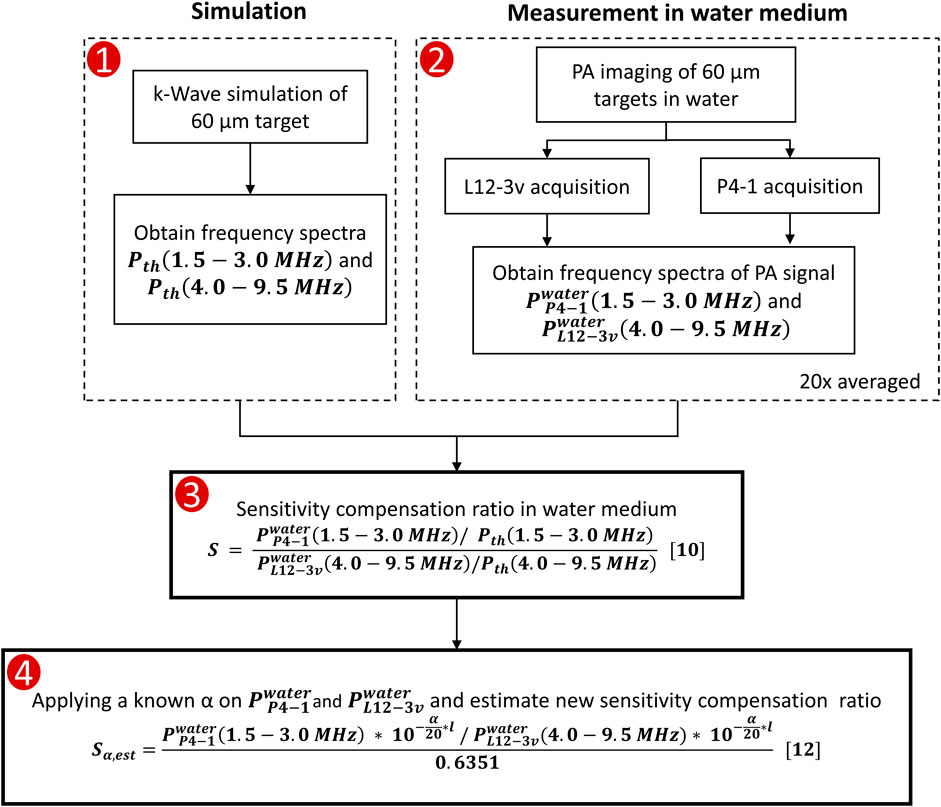
FIGURE 3. Flowchart describing the methodology used to find the sensitivity compensation ratio
Imaging experiments
Appropriate sensitivity compensation ratios, obtained from the calibration experiments, were applied on the beamformed data acquired from a series of experiments performed on a wire phantom, a bovine tissue sample ex vivo, and human blood vessels in vivo.
Firstly, three wires with diameters 60 μm, 128 μm, and 1.0 mm were embedded within a gel pad (Aquaflex, Parker Inc., United States) and imaged at 800 nm with a similar setup as described in the calibration study. The diameters were chosen to demonstrate the band-limiting effect of the two US transducers. The attenuation coefficient of the gel pad was measured and found to be 0.0129 dB/cm/MHz. This value was used for attenuation compensation.
Secondly, a bovine sample containing lipid streaks of different sizes was imaged with a similar setup. The sample is illuminated with a slit-fiber bundle from the top, with a wavelength of 1,200 nm (pulse energy ∼1.6 mJ) to image the lipid streaks as shown in Figure 4. The US probe was positioned on the side of the tissue sample. Both transducers were manually repositioned to image the same structures. The bovine sample was assumed to have an attenuation coefficient equal to soft tissue (0.7 dB/cm/MHz) [45] and hence the sensitivity compensation ratios
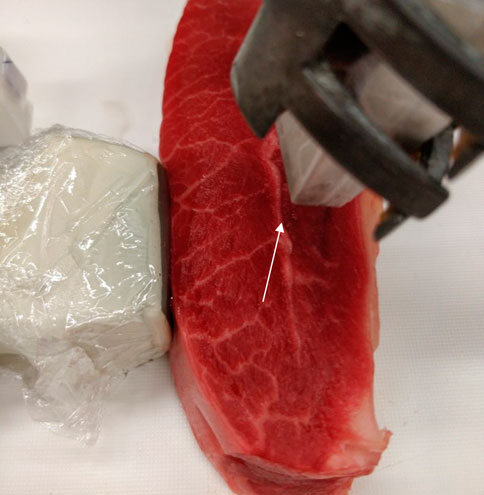
FIGURE 4. Picture of the imaged bovine sample. A horizontal lipid streak is visible throughout the sample at a depth of ∼25 mm that is marked with a white arrow. The sample is illuminated from the top (1,200 nm) and the ultrasound transducers were positioned on the side.
Finally, for the blood vessel measurement in vivo, images were acquired from the volar wrist of a healthy volunteer under a protocol approved by the Medical Research Ethics Board of the Erasmus MC (MEC-2014-611). Slit fiber bundles were attached along the lateral sides of the transducers. A gel pad (2 cm) was used to maintain a constant distance between the illumination and the wrist, this made sure the fluence remained well below the maximum permissible exposure. The average pulse energy out of the slit fibers was 3.6 mJ in a spot of ∼5 cm2. This results in a skin exposure fluence below the ANSI safety limit of 32 mJ/cm2 at 800 nm [46]. Data was acquired from both transducers from the same region on the volar wrist consecutively, using the pulsating ulnar artery as a reference point. In this case, similar to the bovine sample, we assume the attenuation coefficient equal to soft tissue (0.7 dB/cm/MHz) and used
For processing, the raw RF data acquired with L12-3v and P4-1 transducers were averaged over 50 frames. Data acquired with P4-1 was upsampled, using linear interpolation in both axial and lateral directions to attain a sampling rate and element data density equivalent to that of L12-3v. The resampled raw RF data acquired with P4-1 and L12-3v were then beamformed using a Delay and Sum algorithm. The beamformed RF data acquired with L12-3v was then compensated using S or
The compensated beamformed RF data from L12-3v and beamformed RF data from P4-1 were summed to create a combined RF. Before combining, the beamformed RF data acquired with the P4-1 was manually registered with that acquired from the L12-3v. The registration is based on anatomical landmarks that were present in the acquired data from both transducers. In the wire phantom, this manual registration step was performed by aligning the envelope maxima of the PA peak generated by the targets. The envelope of the registered, compensated and combined beamformed RF data was then extracted from the Hilbert transform of the signal, which was further log compressed and displayed in a suitable dynamic range. The methodology used for performing imaging experiments is shown in Figure 5. In addition, a merged image of the two frequency data was also obtained using the HSV color model [27, 47]. For the wire phantom, we plot the vertical profile of raw RF element data and its corresponding frequency spectra from the L12-3v, P4-1, and combined data.
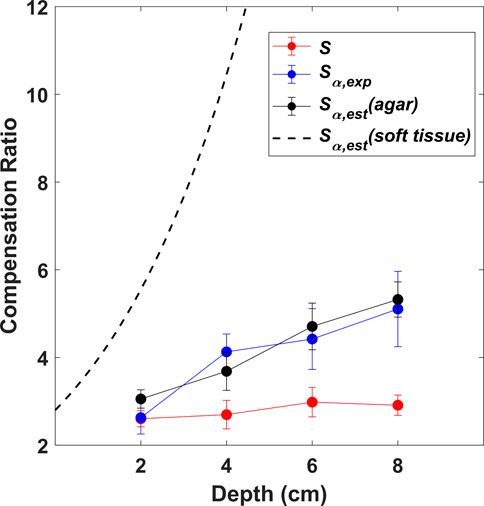
FIGURE 5. Sensitivity compensation ratios as a function of depth obtained experimentally from water medium (S) and attenuating agar medium (
Results
Calibration of the sensitivity compensation
The depth-dependent sensitivity compensation ratios, obtained from the various scenarios established in the calibration study (S,
It can be observed, that the values of S (red curve) remain stable with depth as expected. The values of
Imaging wire targets
Results obtained from the imaging experiments are shown in this section. Figures 6, 7 show results obtained from the 60 μm, 128 μm, and 1.0 mm wire phantoms.
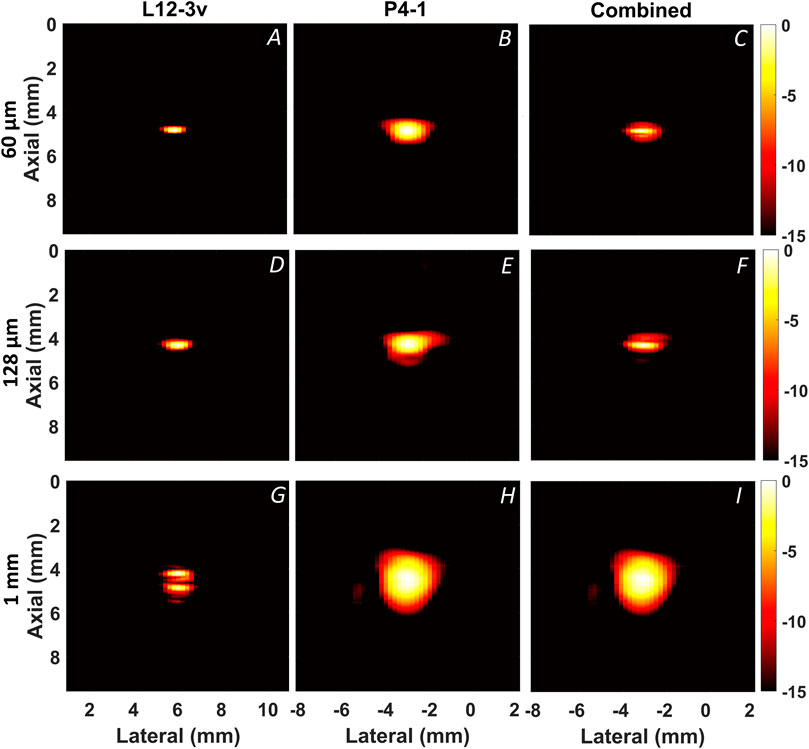
FIGURE 6. Reconstructed PA B-mode images from wire targets. Along the columns the L12-3v, P4-1 and combined compensated images are displayed. Along the rows the 60 μm (A–C), 128 μm (D–F), and 1.0 mm (G–I) wire targets are displayed.
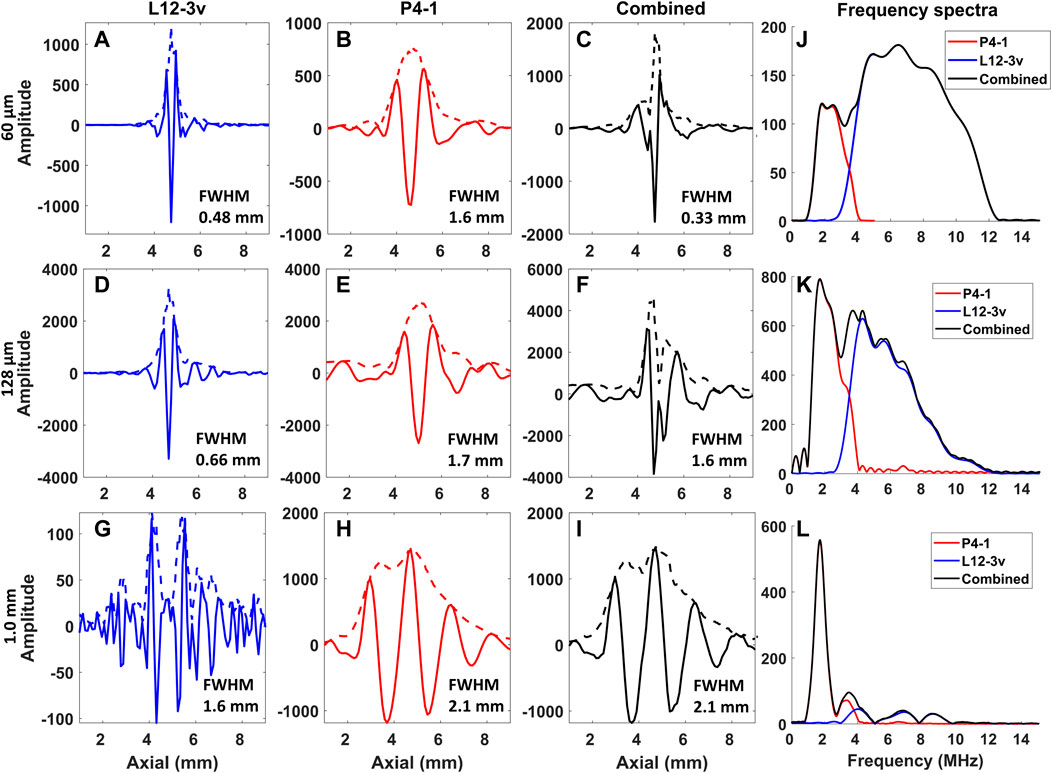
FIGURE 7. Axial profiles of the PA raw RF signal and corresponding frequency spectra acquired from the wire targets. Along the columns the L12-3v, P4-1, combined, and frequency spectra are displayed. Along the rows, the profile and frequency spectra of the 60 μm (A–C,J), 128 μm (D–F,K), and 1.0 mm (G–I,L) wire targets are displayed. The dotted line in fig (A–I) indicates the envelope of the profile.
Figure 6 displays PA B-mode images reconstructed from the wire targets using both transducers. Figure 7 shows the axial profile and frequency spectra plots of the corresponding wires. The “boundary buildup” effect is visible when comparing Figures 6A, 7A to Figures 6G, 7G. As expected, for the smaller targets, the high-frequency content dominates the combined image (Figures 6C,F), whereas in the 1.0 mm wire the low-frequency content dominates (Figure 6I). This relationship between target size and frequency content is also noticeable from amplitudes of the axial profile shown in Figures 7A–I and the frequency spectra plots shown in Figures 7J–L. In addition, the full width half maximum (FWHM) value of each target was calculated from the envelope and displayed within the axial profile plot shown in Figures 7A–I.
Imaging biological objects
Figure 8 shows results obtained from the bovine sample, imaged at the lipid absorption peak at 1,200 nm. The bovine sample is shown in Figure 4 with visible intermuscular adipose tissue, within the muscle and beneath the fascia. It can be observed that a thick lipid streak in the middle of the sample is positioned parallel to the transducer, at a depth of ∼25 mm, with smaller streaks throughout the sample. The US image acquired using L12-3v is displayed in Figure 8D; the lipid streaks can be identified as hyperechoic regions. It can be observed that the thick horizontal patch of lipid is present throughout the sample, whereas smaller lipid structures are present closer to the transducer at depths <25 mm. It can be further noted that the PA image acquired with L12-3v displayed in Figure 8A mainly visualizes smaller structures while the thicker horizontal streak is difficult to identify. On the other hand, the PA image acquired with P4-1 displayed in Figure 8B shows the presence of a thicker horizontal patch of lipids while the finer details are less present. Figure 8C shows merged images acquired with the different probes displayed using an HSV color model. Figure 8E shows the combined and compensated PA image and Figure 8F displays the overlaid PA image on the US image.
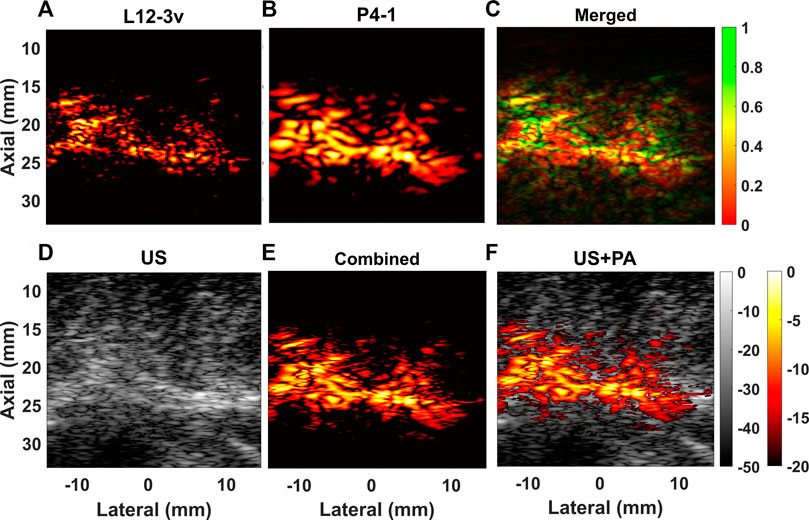
FIGURE 8. Reconstructed PA B-mode images obtained from the bovine tissue sample with (A) L12-3v (B) P4-1 are displayed and (C) merged image of L12-3v and P4-1is displayed., Figure (D) shows the US B-mode acquired with L12-3v, (E) shows combined and compensated image and (F) shows a superposition of (E) on (D).
Figure 9 shows results acquired from the ulnar wrist in vivo cross-section at a wavelength of 800 nm, where hemoglobin absorbs. In Figures 9A–C we show the PA images from the L12-3v, P4-1, and the merged image. The L12-3v visualizes the smaller superficial veins (white arrows), but only shows the closest boundary of the ulnar artery (blue arrow). Conversely, in the image acquired with P4-1 shown in Figure 9B, the cross-section of the artery is visible. After combining beamformed RF data acquired with both transducers (Figure 9E) both the smaller superficial veins and the ulnar artery are visible. Figure 9D shows the US image from the L12-3v, where the ulnar artery is already visible. In Figure 9E, the combined PA image is overlaid on the US image.
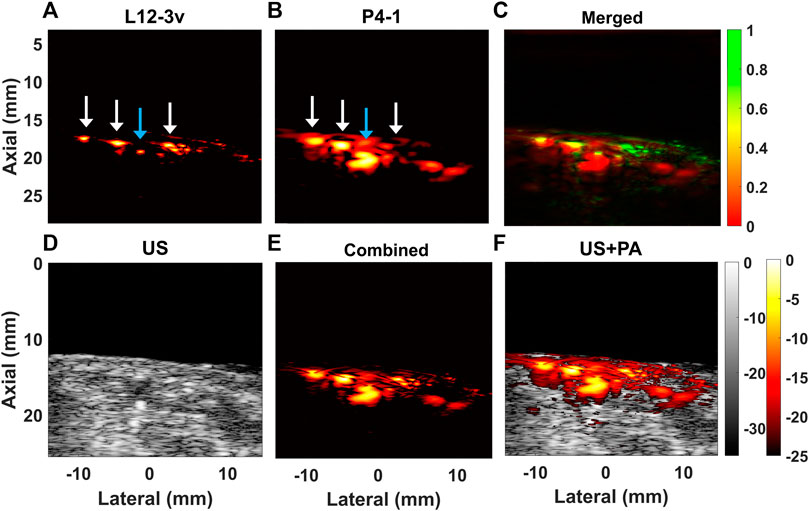
FIGURE 9. Reconstructed PA B-mode cross-sectional images obtained from human blood vessels from the volar wrist at 800 nm with (A) L12-3v, (B) P4-1, and (C) merged image obtained from the L12-3v and P4-1. (D) Shows the US B-mode acquired with L12-3v (E) image obtained after combining beamformed RF from L12-3v and P4-1 and (F) shows a superposition of (E) on (D). The white arrows indicate superficial veins and the blue arrow the ulnar artery.
Summary, discussion, and conclusion
In this paper, we present a novel method for combining PA data from two conventional transducers (L12-3v and P4-1) with complementary bandwidths to perform wide bandwidth in vivo PA imaging. Before combining, we calibrate the two dissimilar transducers in terms of sensitivity using the PA effect to ensure an accurate weighting of the contribution from the signals in both frequency bands. The results obtained demonstrate that it is feasible to image in vivo vascular structures of varying sizes including smaller veins and a large artery in a single image with the use of a dual transducer approach. They also show improved imaging sensitivity and the competence to visualize targets varying widely in size. The use of conventional US transducers for this purpose makes the imaging system less complex and easier to adapt in clinics without the need for customization.
The close correspondence between sensitivity compensation ratios measured experimentally and through theoretical estimation (Figure 5) shows the robustness of the experimental setup developed in this work. Based on this result, we estimate compensation ratios for the bovine sample and in vivo experiments by assuming homogeneous soft tissue attenuation of 0.7 dB/cm/MHz. The plot shown in Figure 5 also demonstrates that it is feasible to estimate the sensitivity compensation ratio for different homogeneous media with a known attenuation coefficient. We have chosen to use a representative homogeneous attenuation coefficient in this work, which appears to be adequate for the acoustically shallow targets we detect. In more heterogeneous tissues and greater depths, experimentally measured values or values for specific tissue regions reported in literature can be substituted for greater accuracy of the amplitude calibration.
For the imaging experiments, the sensitivity compensation ratios calculated from a series of calibration experiments were applied to the RF data, before combining them for display. The wire image results demonstrate the added benefit of the combined image display. For the 1.0 mm target, the L12-3v only visualizes the boundaries, while the P4-1 shows a filled target. The small 60 μm target cannot be resolved in the P4-1 image, while the L12-3v shows it with a higher resolution having FWHM of 0.48 mm (Figure 7A). The negative peaks from boundaries of the wire target seen in the beamformed RF of L12-3v when summed with P4-1 results in a lower amplitude near the outline of the target in the combined data and images (Figures 6C,F, 7C,F). In the bovine tissue sample, the L12-3v signal visualized small lipid streaks, while the P4-1 is sensitive to the larger structures. When only looking at the L12-3v image, it would be easy to miss the thicker horizontal patch of lipids. In the in vivo volar wrist images, it can be seen that the L12-3v image shows superficial veins in a higher resolution. However, it only shows the closest boundary of the ulnar artery, which makes it hard to identify. The P4-1 complements the L12-3v and shows a filled-in ulnar artery.
The multiplication of the sensitivity compensation ratio to the raw data amplifies noise in addition to the signal for that transducer chosen for compensation. In our experiments, the SNR of the L12-3v transducer, to which the compensation was applied, is greater (17.79 dB) than that of the P4-1 (11.24 dB) probe. Therefore, the effect of noise amplification is limited. However, an understanding of the SNR of the transducers of choice is important in understanding the effect of compensation on noise levels.
The acquired images show the feasibility and added value of combining the images acquired from two dissimilar transducers. However, not all the imaging situations exactly match the calibration scenario with targets covering the full elevational thickness of the US probes. The presence of heterogeneous, smaller, curved targets in the elevational direction of the transducer creates a differential response between the two transducers that are not captured by the sensitivity compensation ratio. The importance of this effect depends on the size, shape, and position of the target relative to the elevational focus of the transducer. This effect of different elevational thicknesses and lenses of the transducers should be considered when using this method of calibrating and combining two different transducers. An example of this occurs in the bovine imaging experiment, where the optical attenuation combined with the top illumination method results in a varying optical fluence rate over the elevational thickness of the US probes.
Further, in all experiments reported in this paper, data acquisition is performed with one transducer after the other sequentially. To correctly apply the sensitivity compensation ratio, the imaged plane and the illumination must be identical while swapping the transducers. During the calibration experiments, the custom-made transducer holder ensured the same position of the two different US transducers. Repeating the calibration multiple times made sure that the effect of misalignments was minimized. In the bovine sample and ulnar wrist imaging experiment in vivo, the US transducers were manually positioned one after the other to image the same cross-section. This method results in slight offsets in the exact imaging plane locations. Manual registration, based on anatomical landmarks, is performed to account for this effect as far as possible. For the in vivo ulnar measurement, the slit fibers were attached slightly differently for both transducers due to the different geometries. However, the use of the coupling pad and the effect of light scattering in tissue should minimize the effect of differences in illumination. In clinical practice, swapping between transducers is not practical and causes imaging plane misalignment issues. The usage of a probe holder for simultaneous acquisition of data is a possibility, but the overlapping of the imaging planes should be taken into account.
In conclusion, the results in this study demonstrate the presence of complementary information in PA images acquired with two transducers with non-overlapping frequency content. We demonstrated a method to combine data from two such probes, enabling quantitatively correct wide-band imaging with conventional equipment. This paper also shows the improved imaging sensitivity and the competence for visualizing targets varying widely in size.
Data availability statement
The original contributions presented in the study are included in the article/supplementary material, further inquiries can be directed to the corresponding author.
Ethics statement
The studies involving human participants were reviewed and approved by Medical Research Ethics Board of the Erasmus MC (MEC-2014-611). The patients/participants provided their written informed consent to participate in this study.
Author contributions
GvS and AvdS designed and supervised the research. SC, JR, and AN designed the method, performed experimental work, data processing, and interpretation of the data. The paper was written by SC and JR. All authors contributed to manuscript revision and approved the submitted version.
Funding
This research was funded by the Dutch Research Council (NWO) through the project Imaging atherosclerotic plaque lipidomics in vivo (Vici project number 16131). It was also supported by the Dutch LSH-TKI project PICA-Heart (project number EMC20024).
Conflict of interest
The authors declare that the research was conducted in the absence of any commercial or financial relationships that could be construed as a potential conflict of interest.
Publisher’s note
All claims expressed in this article are solely those of the authors and do not necessarily represent those of their affiliated organizations, or those of the publisher, the editors and the reviewers. Any product that may be evaluated in this article, or claim that may be made by its manufacturer, is not guaranteed or endorsed by the publisher.
References
1. Xu M, Wang LV. Photoacoustic imaging in biomedicine. Rev Scientific Instr (2006) 77(4):041101. doi:10.1063/1.2195024
2. Xia J, Yao J, Wang LV. Photoacoustic tomography: Principles and advances (invited review). Electromagn Waves (Camb) (2014) 147:1–22. doi:10.2528/pier14032303
3. Beard P. Biomedical photoacoustic imaging. Interf Focus (2011) 1(4):602–31. doi:10.1098/rsfs.2011.0028
4. Szabo TL, Lewin PA. Ultrasound transducer selection in clinical imaging practiceJ. Ultrasound Med. (2013) 70(3):573–582.
5. Lee W, Roh Y. Ultrasonic transducers for medical diagnostic imaging. Biomed Eng Lett (2017) 7(2):91–7. doi:10.1007/s13534-017-0021-8
6. Tian C, Pei M, Shen K, Liu S, Hu Z, Feng T. Impact of system factors on the performance of photoacoustic tomography scanners. Phys Rev Appl (2020) 13(1):014001. doi:10.1103/physrevapplied.13.014001
7. Song X, Wei J, Jiang Q, Song L. Research on the photoacoustic spectrum analysis using k-Wave2021.
8. Rathi N, Sinha S, Chinni B, Dogra V, Rao N. Computation of photoacoustic absorber size from deconvolved photoacoustic signal using estimated system impulse response. Ultrason Imaging (2021) 43(1):46–56. doi:10.1177/0161734620977838
9. Hysi E, Moore MJ, Strohm EM, Kolios MC. A tutorial in photoacoustic microscopy and tomography signal processing methods. J Appl Phys (2021) 129(14):141102. doi:10.1063/5.0040783
10. Gertsch A, Bush N, Birtill D, Bamber J. Towards characterising the size of microscopic optical absorbers using optoacoustic emission spectroscopy. Proc SPIE - Int Soc Opt Eng (2010) 7564.
11. Diebold G, Sun T, Khan MI. Photoacoustic monopole radiation in one, two, and three dimensions. Phys Rev Lett (1992) 67:3384–7. doi:10.1103/physrevlett.67.3384
13. Ku G, Wang X, Stoica G, Wang LV. Multiple-bandwidth photoacoustic tomography. Phys Med Biol (2004) 49(7):1329–38. doi:10.1088/0031-9155/49/7/018
14. Guo Z, Li L, Wang LV. On the speckle-free nature of photoacoustic tomography. Med Phys (2009) 36(9):4084–8. doi:10.1118/1.3187231
15.C Yang, P Li, Y Cui, W Shao, N Wang, and J Shen, editors. A dual-frequency probe with coded excitation for ultrasound guided screw insertion in spinal fusion surgery (2020). Las Vegas, NV: IEEE International Ultrasonics Symposium (IUS).
16. Wang Z, Martin KH, Dayton PA, Jiang X. Real-time ultrasound angiography using superharmonic dual-frequency (2.25MHz/30MHz) cylindrical array: In vitro study. Ultrasonics (2018) 82:298–303. doi:10.1016/j.ultras.2017.09.012
18. Lee J, Shin EJ, Lee C, Chang JH. Development of dual-frequency oblong-shaped-focused transducers for intravascular ultrasound tissue harmonic imaging. IEEE Trans Ultrason Ferroelectr Freq Control (2018) 65(9):1571–82. doi:10.1109/tuffc.2018.2844869
19. Liao A-H, Lin K-H, Chuang H-C, Tsai C-H, Lin Y-C, Wang C-H, et al. Low-frequency dual-frequency ultrasound-mediated microbubble cavitation for transdermal minoxidil delivery and hair growth enhancement. Sci Rep (2020) 10(1):4338. doi:10.1038/s41598-020-61328-0
20. Vos HJ, Frijlink MA, Droog E, Goertz DE, Blacquiere G, Gisolf A, et al. Transducer for harmonic intravascular ultrasound imaging. IEEE Trans Ultrason Ferroelectr Freq Control (2005) 52(12):2418–22. doi:10.1109/tuffc.2005.1563286
21. Bouakaz A, Krenning Bj Fau - Vletter WB, Vletter Wb Fau - ten Cate FJ, ten Cate Fj Fau - De Jong N, De Jong N. Contrast superharmonic imaging: A feasibility study. Ultrasound Med Biol (2003) 29(4):547–553.
22. Liu JH, Wei Cw Fau - Sheu Y-L, Sheu Yl Fau - Tasi Y-T, Tasi Yt Fau - Wang Y-H, Wang Yh Fau - Li P-C, Li PC. Design, fabrication and testing of a dual-band photoacoustic transducer. Ultrason. Imaging (2008) 30(4):217–227.
23. Kalkhoran MA, Varray F, Vray D. Dual frequency band Annular probe for volumetric pulse-echo optoacoustic imaging. Phys Proced (2015) 70:1104–8. doi:10.1016/j.phpro.2015.08.236
24. Wada T. Inventor; FUJIFILM CORPORATION (Tokyo, JP), assignee. Photoacoustic imaging apparatus. United States In: Photoacoustic imaging method, and probe for photoacoustic imaging apparatus 2013.
25. Aguirre J, Schwarz M, Garzorz N, Omar M, Buehler A, Eyerich K, et al. Precision assessment of label-free psoriasis biomarkers with ultra-broadband optoacoustic mesoscopy. Nat Biomed Eng (2017) 1(5):0068. doi:10.1038/s41551-017-0068
26. Cao Y, Alloosh M, Sturek M, Cheng J-X. Highly sensitive lipid detection and localization in atherosclerotic plaque with a dual-frequency intravascular photoacoustic/ultrasound catheter. Translational Biophotonics (2020) 2(3):e202000004. doi:10.1002/tbio.202000004
27. Luo X, Cai Y, Chen Z, Shan H, Sun X, Lin Q, et al. Stack-layer dual-element ultrasonic transducer for broadband functional photoacoustic tomography. Front Bioeng Biotechnol (2021) 9:786376. doi:10.3389/fbioe.2021.786376
28. Omar M, Rebling J, Wicker K, Schmitt-Manderbach T, Schwarz M, Gateau J, et al. Optical imaging of post-embryonic zebrafish using multi orientation raster scan optoacoustic mesoscopy. Light Sci Appl (2017) 6(1):e16186–e. doi:10.1038/lsa.2016.186
29. Li J, Chekkoury A, Prakash J, Glasl S, Vetschera P, Koberstein-Schwarz B, et al. Spatial heterogeneity of oxygenation and haemodynamics in breast cancer resolved in vivo by conical multispectral optoacoustic mesoscopy. Light: Sci. Appl. (2020) 9(1):57.
30.A Chekkoury, J Gateau, and V Ntziachristos, editors. Multiple bandwidth volumetric optoacoustic tomography using conventional ultrasound linear arrays. Opto-acoustic methods and applications. Munich: Optica Publishing Group (2013).
31. Rich KT, Mast TD. Methods to calibrate the absolute receive sensitivity of single-element, focused transducers. J Acoust Soc Am (2015) 138(3):EL193–8. doi:10.1121/1.4929620
32. Shabanimotlagh M. Ultrasound matrix transducers for high frame rate 3D medical imaging. Delft, Netherlands: Delft University of Technology (2018).
33. Gamelin J, Aguirre A, Maurudis A, Huang F, Castillo D, Wang LV, et al. Curved array photoacoustic tomographic system for small animal imaging. J Biomed Opt (2008) 13(2):024007. doi:10.1117/1.2907157
34. Beard PC, Perennes F, Mills TN. Transduction mechanisms of the Fabry-Perot polymer film sensing concept for wideband ultrasound detection. IEEE Trans Ultrason Ferroelectr Freq Control (1999) 46(6):1575–82. doi:10.1109/58.808883
35.C André, AE Sergey, S Richard, B Hans-Peter, PF Matthew, and AO Alexander, editors. Characterization of optoacoustic transducers through the analysis of angular-dependent frequency response. San Jose, CA: PIE BIOS: Photons plus ultrasound: Imaging and sensing (2009).
36. Rosenthal A, Ntziachristos V, Razansky D. Optoacoustic methods for frequency calibration of ultrasonic sensors. IEEE Trans Ultrason Ferroelectr Freq Control (2011) 58(2):316–26. doi:10.1109/tuffc.2011.1809
37. Cox BT, Kara S, Arridge SR, Beard PC. k-space propagation models for acoustically heterogeneous media: Application to biomedical photoacoustics. J Acoust Soc Am (2007) 121(6):3453–64. doi:10.1121/1.2717409
38. Treeby BE, CoxWave BTk-. k-Wave: MATLAB toolbox for the simulation and reconstruction of photoacoustic wave fields. J Biomed Opt (2010) 15(2):021314. doi:10.1117/1.3360308
39. Shankar H, Pagel P, Warner D. Potential adverse ultrasound-related biological effects. Anesthesiology (2011) 115:1109–24. doi:10.1097/aln.0b013e31822fd1f1
40. Pinkerton JMM. A pulse method for the measurement of ultrasonic absorption in liquids: Results for water. Nature (1947) 160(4056):128–9. doi:10.1038/160128b0
41. Cortela GA, Maggi LE, Kruger MA, Negreira CA, Pereira WCA. Ultrasonic attenuation and speed in phantoms made of polyvinyl chloride-plastisol and graphite powder. The J Acoust Soc America (2013) 133(5):3585. doi:10.1121/1.4806606
42. Gutierrez MI, Lopez-Haro SA, Vera A, Leija L. Experimental verification of modeled thermal distribution produced by a piston source in physiotherapy ultrasound. Biomed Res Int (2016) 2016:1–16. doi:10.1155/2016/5484735
43. Szabo TL. Diagnostic ultrasound imaging: Inside out. 2nd ed. Boston, MA, USA: Boston UniversityAcademic Press (2014).
44. Bader KB, Crowe MJ, Raymond JL, Holland CK. Effect of frequency-dependent attenuation on predicted histotripsy waveforms in tissue-mimicking phantoms. Ultrasound Med Biol (2016) 42(7):1701–5. doi:10.1016/j.ultrasmedbio.2016.02.010
45. Goldstein A, Powis RL. 2 - medical ultrasonic diagnostics. In: RN Thurston, AD Pierce, and EP Papadakis, editors. Physical acoustics, 23. Academic Press (1999). p. 43.
46.LIA. American national standard for the safe use of lasers ANSI z136.1-2000. American National Standards Institute (2000).
Keywords: photoacoustic (optoacoustic) imaging, conventional ultrasound transducer, calibration, broad bandwidth, frequency spectra, sensitivity, in vivo imaging
Citation: Chandramoorthi S, Riksen JJM, Nikolaev AV, Van Der Steen AFW and Van Soest G (2022) Wideband photoacoustic imaging in vivo with complementary frequency conventional ultrasound transducers. Front. Phys. 10:954537. doi: 10.3389/fphy.2022.954537
Received: 27 May 2022; Accepted: 21 September 2022;
Published: 06 October 2022.
Edited by:
Juan Aguirre, Technical University of Munich, GermanyReviewed by:
Antonios Stylogiannis, Helmholtz Association of German Research Centres (HZ), GermanyJaya Prakash, Indian Institute of Science (IISc), India
Subhamoy Mandal, Indian Institute of Technology Kharagpur, India
Copyright © 2022 Chandramoorthi, Riksen, Nikolaev, Van Der Steen and Van Soest. This is an open-access article distributed under the terms of the Creative Commons Attribution License (CC BY). The use, distribution or reproduction in other forums is permitted, provided the original author(s) and the copyright owner(s) are credited and that the original publication in this journal is cited, in accordance with accepted academic practice. No use, distribution or reproduction is permitted which does not comply with these terms.
*Correspondence: Gijs Van Soest, Zy52YW5zb2VzdEBlcmFzbXVzbWMubmw=
†These authors have contributed equally to this work
 Sowmiya Chandramoorthi
 Jonas J. M. Riksen
 Anton V. Nikolaev
 Antonius F. W. Van Der Steen
 Gijs Van Soest