
95% of researchers rate our articles as excellent or good
Learn more about the work of our research integrity team to safeguard the quality of each article we publish.
Find out more
REVIEW article
Front. Phys. , 11 October 2022
Sec. Optics and Photonics
Volume 10 - 2022 | https://doi.org/10.3389/fphy.2022.946515
This paper provides a comprehensive review of magneto-optical (MO) spectroscopy. In the first place, different methods of MO measurements such as the Faraday effect, MO Kerr effect, and Cotton-Mouton effect are briefly introduced. Next, macroscopic and microscopic origin in magnetic materials is summarized. In the third part, measuring techniques for MO spectroscopies are reviewed, with a particular reference to the polarization modulation technique.
It is well known that light is not influenced by a static magnetic field in a vacuum. On the contrary, light transmitted through materials or reflected by materials is influenced by a magnetic field or by magnetization of materials. These phenomena are called the magneto-optical (MO) effect. In recent years MO effects are utilized for not only optoelectronic devices but also as tools for investigating physical properties and electronic structures of materials. Particularly, MO spectroscopy is important for the latter purposes, since MO effects are originated from optical transitions in the spin-polarized electronic structures of materials.
In the case of transmission geometry, there are two types of magnetic field application, i.e., Faraday configuration in which a magnetic field is applied parallel to the propagation direction of light, and Voigt configuration in which a magnetic field is applied perpendicular to the light propagation.
MO effect in the Faraday configuration is called the Faraday effect, which causes rotation of light polarization (Faraday rotation) and elliptically polarized light (MCD). MO effect in the Voigt configuration is called the Cotton-Mouton effect, which causes magnetically induced birefringence.
MO effect in the reflection geometry is called the magneto-optical Kerr effect (MOKE). In Figure 1, three cases of MOKE are illustrated. If the magnetization is normal to the reflection plane, it is called the polar Kerr effect as shown in (a). If the magnetization lies in a plane, two cases exist; i.e., the longitudinal Kerr effect with the magnetization in the plane of light incidence 2) and the transverse Kerr effect with the magnetization perpendicular to the plane of incidence (c).
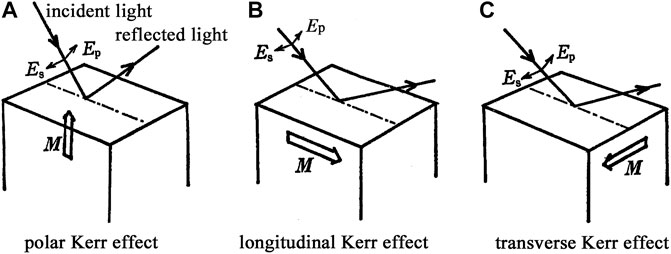
FIGURE 1. Three types of experimental geometry for MOKE measurement. (A) polar Kerr effect, (B) longitudinal Kerr effect, and (C) transverse Kerr effect.
Light propagation in a continuous medium can be described in terms of Maxwell’s equation, and the response of the medium may be described by the dielectric permittivity (or conductivity, in the case of a metallic medium). We assume relative magnetic permeability μ as unity since the magnetic moment cannot follow the vibration of the frequency of light.
The dielectric permittivity is a quantity that provides a relation between the electric displacement D and the electric field E as described in Eq. 1.
Here
Each element of the tensor is a complex as described in Eq. 3.
In the following chapters, we also use an electric conductivity tensor
The electric conductivity tensor can be described as Eq. 5.
Each component of
There holds an equation between the components of
If the conductivity is given in CGS unit (s−1) the Eq. 7 can be rewritten as Eq. 8.
Here we assume an isotropic medium. Without a magnetic field or without magnetization the dielectric permittivity tensor
The introduction of a magnetization M along the light propagation direction z causes uniaxial anisotropy to the medium. Then the tensor components of Eq. 2 can be described as Eq. 10.
Then the dielectric permeability tensor
According to Onsager, the diagonal elements are an even function of M and the off-diagonal elements are an odd function of M.
It will be revealed in the following sections that the off-diagonal element
Figure 2 provides schematic illustrations of how Faraday rotation and Faraday ellipticity occur in the medium when a magnetization vector is perpendicular to the plane. In this figure, light propagates vertically to the surface toward the backside, and straight arrows represent electric field vectors of light.
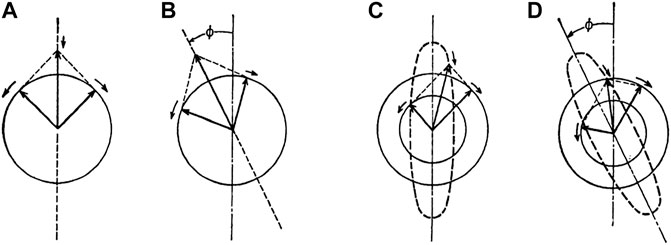
FIGURE 2. Origin of Faraday rotation and Faraday ellipticity (Magnetic field is applied perpendicular to the surface of the paper (A) Linearly polarized (LP) light can be decomposed to right circularly polarized (RCP) and left circularly polarized (LCP) lights (B) When the phase of the RCP wave advances faster than that of the LCP wave, composed polarization of the light transmitted three the medium is LP rotated from the incident LP. (C) When the amplitude of the RCP wave is larger than that of the LCP wave, composed polarization shows a trajectory of an ellipse. (D) When the amplitude and phase of RCP and LCP are different, the trajectory becomes an ellipse with the principal axis inclined.
As shown in 1) the electric field vector of the linearly polarized light can be decomposed into two circularly rotating electric field vectors, namely right-circularly polarized light (RCP) and left-circularly polarized light (LCP). If phases of RCP and LCP are different after traveling through a medium of l in length as shown in (b), the trajectory of light composed of two circularly polarized lights becomes a linearly polarized light which is rotated from the incident light vector. The rotation angle
where
where
The phase difference can be expressed using refractive indices
where
On the other hand, ellipticity or circular dichroism appears if there is a difference between extinction coefficients for RCP and LCP.
where
We define complex rotation as
In the following, the Faraday rotation and ellipticity are described in terms of the dielectric permittivity tensor of Eq. 11.
Light propagation through the medium with the dielectric permittivity tensor
We assume that the time- and location-dependence of the electric field and the magnetic field are expressed by the form of
The secular equation is
The eigenvalues of the equation are obtained by
The solution is
where eigenvalues
The electric field vectors corresponding to
The difference between complex refractive indices
The complex rotation
Then Faraday rotation
Here we used a formula
If we consider a transparent medium, the extinction coefficient
We assume the light beam comes through a vacuum. Using electromagnetic theory, the Fresnel coefficient (complex amplitude reflectance)
We assume
The polar Kerr rotation
Then complex Kerr rotation
where
From Eq. 25–23 we can write complex Kerr rotation by Eq. 26
This equation suggests that Kerr rotation is enhanced when the denominator takes a small value, i.e.,
This equation provides
We assume that the light is incident with an angle of incidence
where
Snell’s law holds between the angle of incidence
where
When the magnetization vector is vertical to the plane of incidence, the incident s-polarization is subjected to no effect, while incident p-polarization is subjected to a change of reflection intensity. No rotation of polarization occurs for this configuration.
The reflectivity of intensity is proportional to
The cotton-Mouton effect is a magnetically induced birefringence in the Voigt configuration. Magnetization vector M is perpendicular to the light propagation. The existence of M induces uniaxial anisotropy along the magnetization direction. Assuming the light propagation direction as x, Maxwell’s Eq. 16 leads to the secular Eq. 32
We get two eigenvalues N1 and N2 as follows.
Solutions corresponding to N1 and N2 are extraordinary waves and ordinary waves, respectively, and give rise to optical retardation
The electric displacement D in a medium and the electric field E can be related by
where p is the electrical polarization which is related by
Therefore, dielectric permittivity can be expressed in terms of electric polarizability as
Electric polarization P is the sum of electric dipole vectors in unit volume. Assuming the density of dipoles as n, the charges as q and -q and displacement by electric field E as u, P is expressed as
As explained in Section 2 2 magneto-optical effect is caused by the off-diagonal element
In the following, we obtain the tensor elements from an equation of motion for a charged particle with mass m and charge q.
Here γ is a probability of scattering as defined by
Substituting
where x, y, and z are components of vector u in the Cartesian coordinate.
Substituting solutions of x, y, and z into Eq. 37 we obtain polarizability tensor elements as
where tensor elements of
Here
Using relation 36) the dielectric tensor elements are given by Eq. 41.
In the following, three cases are discussed (A) B = 0, (B) B = 0 and
A) Without magnetic field: Lorentz formula
Eq. 41 becomes simple when B = 0 (
Figure 3A shows a schematic illustration of spectra for
B) Without magnetic field and without restoring force: Drude formula
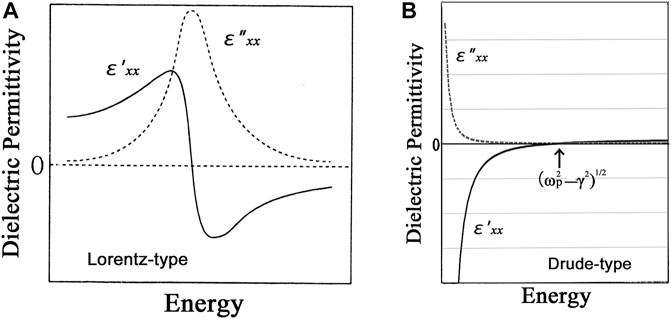
FIGURE 3. Spectra of dielectric permittivity derived from the classic equation of motion for electrons (A) Lorentz-type spectra, (B) Drude-type spectra.
If we consider the free carrier motion without magnetic field B and without restoring force, we can assume
Eq. 43 are typical Drude formulas and spectra for
C) With non-zero magnetic field and without restoring force: Magneto-plasma resonance and Hall effect
The second term gives rise to magneto-optical spectra, in which the real part shows a dispersion-type spectrum and the imaginary part a bell-type. If scattering is neglected (
This case leads to a transport phenomenon of free carriers in the magnetic field. In this case, we should use a conductivity tensor instead of a dielectric permittivity tensor. For this purpose, we use relation
If we assume
By calculating the inverse matrix, we obtain resistivity tensor elements as
Here
In this section, we describe that dielectric permittivity tensor elements are expressed by superposition of dispersion relations based on optical transitions in materials. According to the Kubo formula [6], the electric polarizability tensor element
Here
and
where
Electric permittivity can be converted to dielectric permittivity as
Here
At absolute zero temperature T = 0, we assume
In the following, we make a physical interpretation of why permittivity as shown by (50) can be expressed in terms of optical transitions between electronic states. First, the diagonal element of dielectric permittivity is a quantity showing how easily materials can be polarized by an external electric field. Figure 4A illustrates how the charge distribution of an atom is altered from an unperturbed state by an application of an electric field as a perturbation, producing an electric dipole moment. It is well known that any perturbed wavefunctions can be Fourier expanded with unperturbed eigenfunctions. Here coefficients of expansion are given by the oscillator strength and energy nominators
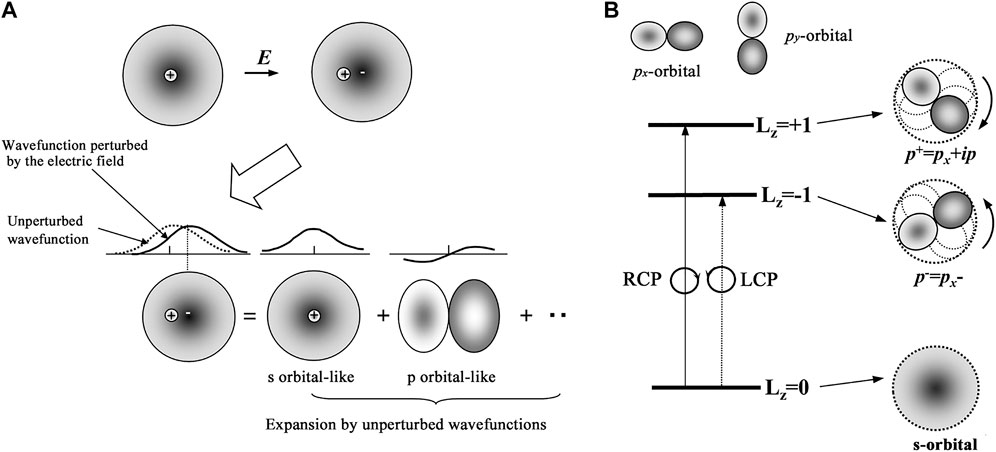
FIGURE 4. (A) The charge distribution of an atom is altered from an unperturbed state by an application of an electric field as a perturbation, producing an electric dipole moment.(B) Schematic illustration explaining the origin of the magneto-optical effect. Angular distribution of electron for Lz = ±1 is considered p-electron-like and can be expressed as p± = px ± ipy expressing right-hand rotation and left-hand rotations of p-like distribution around the z-axis. This means circularly polarized light induces rotation of electrons.
In the second place, we provide physical interpretation for off-diagonal elements of dielectric permittivity. In order to get a non-zero off-diagonal element,
In the above discussion, the effect of magnetization has not appeared explicitly. In the following, we treat the effect using the electronic level diagram shown in Figure 5 Without magnetization energy levels of Lz = +1 and those with Lz = -1 degenerate as shown in Figure 5A. Magnetization lifts the spin degeneracy by exchange splitting, giving rise to splitting for the up-spin and down-spin states but does not lift angular orbital degeneracy as in Figure 5B. With the spin-orbit interaction, total angular momentum J (=L + S) becomes a good quantum number to represent the states as in Figure 5C. If the ground state splitting is sufficiently larger than thermal energy kT The ground state is composed of only up-spin electrons, the transition from Jz = +1/2 ground state to Jz = +3/2 occurs by RCP, and the transition from Jz = +1/2 to Jz = -1/2 occurs by LCP. The magneto-optical effect appears if the transition energies of the two transitions are different.
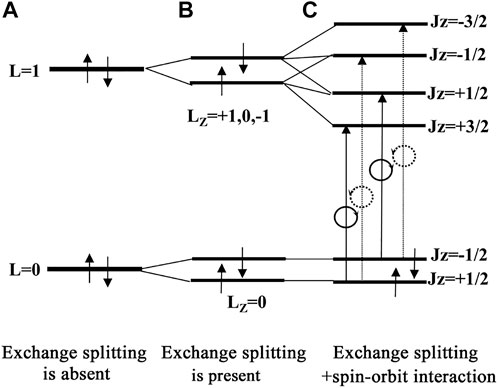
FIGURE 5. Schematic illustration showing an importance of spin-orbit interaction for magneto-optical effect to occur. (A) exchange splitting is absent, (B) exchange splitting is present, and (C) exchange splitting and spin-orbit interaction are present.
For elevated temperatures transitions from Jz = -1/2 brings about inverse spectral response should be considered considering the distribution of Jz = +1/2 and Jz = -1/2 states.
In this subsection, we discuss the shape of magneto-optical spectra in magnetic insulators.
1) Diamagnetic term or two-transition-type spectrum
The energy diagram of Figure 6A assumes that the ground state has no orbital degeneracy, and the excited state is split by the spin-orbit interaction. Using Eq. 50 and assuming T = 0, real and imaginary parts of
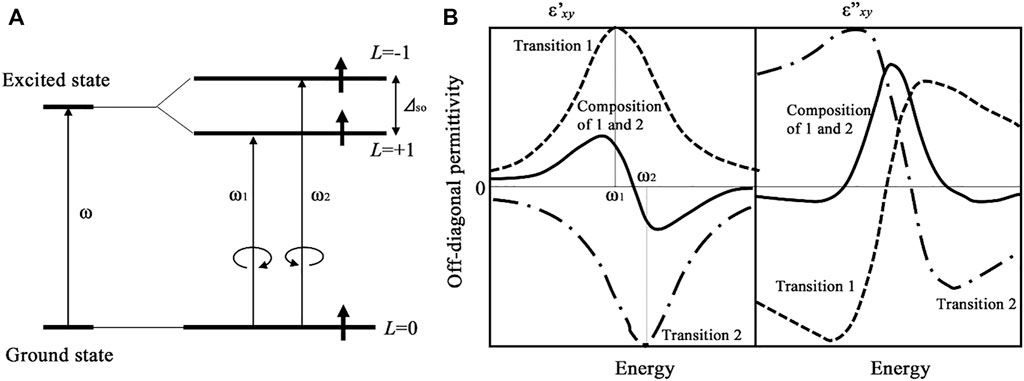
FIGURE 6. Diamagnetic term of magneto-optical spectra (A) Energy level diagram with spin-orbit split excited state (B) Diamagnetic spectra of off-diagonal dielectric permittivity elements.
Spectra of
2) Paramagnetic term or one-transition-type spectrum
The energy diagram of Figure 7A assumes that both ground and excited states are not subjected to splitting in energy, but oscillator strengths
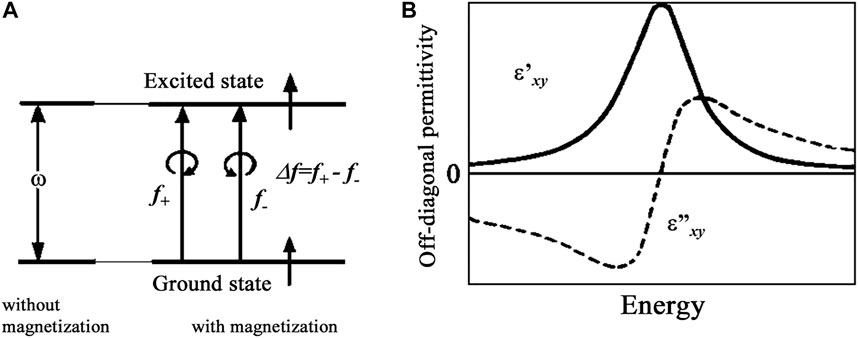
FIGURE 7. Paramagnetic term of magneto-optical spectra (A) Energy level diagram without splitting and with a difference in oscillator strengths for RCP and LCP (B) Paramagnetic spectra of off-diagonal dielectric permittivity.
Spectra of
Optical phenomena in metals should be explained in terms of inter-band transitions. In this case, energy band calculations are employed to obtain eigenvalues and eigenfunctions of band-states in k-space, from which optical responses are calculated using the Kubo formula. For metals, conductivity tensor is used instead of permittivity tensor. We introduce momentum operator
Here
Using
According to Erskine and Stern, the above formula can be expressed in an integral form on k as Eq. 55.
Here Fnl is oscillator strength or transition and can be expressed in terms of optical transition matrix as (56)
By defining average transition probability
We define average oscillator strength for RCP and LCR as
This formula means that the magneto-optical spectrum of metals can be expressed as a difference between inter-band transitions for RCP and LCP.
Figure 8 shows a schematic illustration of the joint density of state (JDOS) spectra for LCP and RCP. Without magnetization JDOSs for LCP and RCP are canceled out as in (a). With a magnetization, the center of gravity of JDOS curves for LCP and RCP shift by
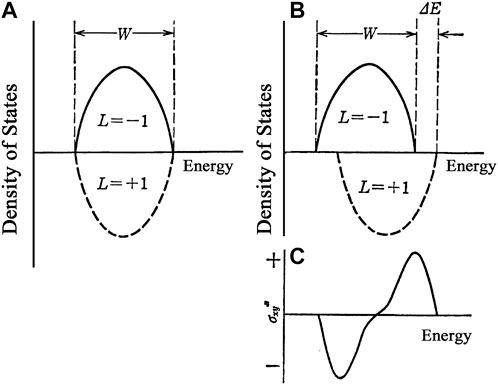
FIGURE 8. Schematic illustration of band structure and magneto-optical spectra in metals (A) Density of state curves of a metal without magnetization (B) Density of state curves of a metal with magnetization (C) Typical magneto-optical spectrum of a metal with magnetization.
The most orthodox technique for evaluation of magneto-optical rotation is the “Orthogonal Polarizer Method”, or the so-called “Cross-Nicol Method”.
Optical setups are shown in Figure 9A for a Faraday configuration in which a magnetic field is applied parallel to the optical path. Let the angle of the optical axis of polarizer P and analyzer A form the vertical axis
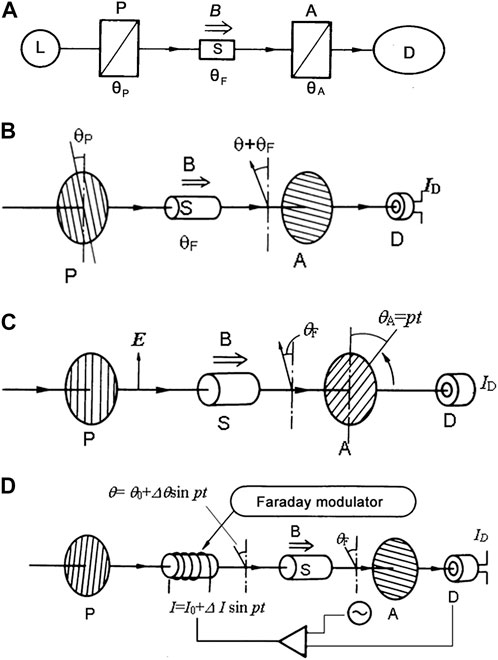
FIGURE 9. Magneto-optical measurement technique (A) Orthogonal polarizer technique L: light source, p: polarizer, S: sample, A: analyzer, D: detector (B) Rotating polarizer technique p: rotating polarizer (polarizing angle θp, S: sample (Faraday rotation θF), A: analyzer, D: detector (C) Oscillating polarizer technique p: polarizer, S: sample, A oscillating analyzer, D: detector (D) Faraday cell technique p: polarizer, S: sample. A: analyzer, D: detector.
For cross nicol condition
When
This method employs constant rotation of polarizer P or analyzer A. Figure 9B shows a case in which the angle of P is fixed, and the angle of A is rotated with constant angular frequency p. The output ID of detector D is expressed by Eq. 61 and doubled frequency signal appears.
Faraday rotation angle can be obtained from the phase shift
As shown in Figure 9C, the angle of analyzer is oscillated with a small angle amplitude of
Then output of D can be expanded using Bessel’s function
Here Faraday rotation is assumed to be small, leading to the last expression. In the above formula, the term with angular frequency p is proportional to the intensity and Faraday rotation and the term with 2p is proportional to the intensity, then by taking a ratio of p-component and 2p-component we can obtain Faraday rotation
In this method, we use a Faraday cell to compensate Faraday rotation of the sample by using a feedback system. Figure 9D shows an experimental setup, where the optical axis of polarizer P and that of analyzer A are set vertically, leading to zero output in detector D without a sample. The feedback system works to compensate for the Faraday rotation by flowing current to the Faraday cell to keep the output zero. To increase sensitivity, modulating AC current is superposed to the DC current supply for the Faraday cell and the output AC signal detected by a lock-in amplifier is fed to the DC supply. Using the Faraday cell, we can add polarization
The p component of the output, which is proportional to
Magneto-optical ellipticity or magnetic circular dichroism (MCD) can be measured using magneto-optical measurement techniques introduced in sub-sections 3.1.1–3.2.4 by introducing a quarter wave plate in front of the analyzer.
As shown in Figure 10, we assume that light with an ellipticity η is incident to a quarter wave plate, then incident elliptically polarized electric vector can be expressed as
The emitted light is a linearly polarized light rotated by angle η from the x-axis as shown in the left figure.
In this way, we can convert an elliptically polarized light to a linearly polarized light with an inclination of ellipticity. However, for spectroscopic measurement for a wide wavelength region, the quarter wave plate should be changed for different wavelengths. Use of a Babinet-Soleil compensator is recommended.
For spectroscopic measurement of both rotation and ellipticity, we recommend the use of the optical retardation modulation technique, as illustrated in Figure 11.
We use a piezo birefringent modulator (commercially sold PEM = photo-elastic modulator) to modulate optical retardation. The polarization axis of polarizer P should be set to be 45° inclined to the optical axis of the PEM, while that of analyzer A parallel to the optical axis of the PEM. Assuming modulated optical retardation as
By taking the ratio of the p-component and DC component, we obtain ellipticity, and the ratio of the 2p-component and DC component gives rotation. Therefore, we can obtain both ellipticity and rotation simultaneously.
Assuming modulation amplitude of optical birefringence of PEM as
To calibrate the rotation angle, we remove the sample, and the polarization angle of p is adjusted to be nearly vertical where the minimum output of the 2p-component is obtained. Then the analyzing angle is rotated from +2° to -2° by a step of 1.0° and the value of the ratio of 2p-component and DC component is recorded. By taking the difference between the values for the analyzer angles of the same absolute values with different signs (e.g., +1° and -1°), the calibrated value per unit angle is obtained.
For calibration of ellipticity, a retardation plate made of sapphire is employed. A sapphire crystal plate of 0.295 mm thickness was cut along the crystal plane which assures double refraction. If we set the optic axis of the sapphire plate in the vertical direction and the polarizing direction of the analyzer at
In the case of MO imaging, lock-in detection cannot be employed since image sensors such as the CCD camera cannot respond to the modulation frequency of the PEM. Instead of the lock-in detection, the difference between two images corresponding to different polarization states is calculated by using an image-processing technique, which is equivalent to the PEM-lock-in method described in the previous sub-section. To generate different polarization states, we use a liquid crystal modulator (LCM). Schematic drawings of MO microscopes using a λ/4 plate and an LCM are shown in Figure 12.
In the following, we explain a principle of the polarization-modulation MO imaging technique in terms of the Jones matrix method. Each optical component shown in Figure 12 is expressed in terms of a Jones matrix.
A matrix of the polarizer with its optic axis parallel to the vertical axis 10) is expressed by
Jones matrix for the LCM in which retardation δ can be controled by an applied voltage can given by
where LP, RCP and LCP correspond to δ = 0, π/2 and -π/2, respectively.
For a Faraday configuration shown in Figure 12, a matrix of a sample having Faraday rotation θF and Faraday ellipticity ηF is expressed by
An analyzer with an optical axis of 45° is
Using these matrices, an output signal E2 using the LCM can be calculated by
Consequently, an intensity measured at a detector is a square of the absolute value of E2 as a function of θF, ηF and δ, as Eq. 67.
Images of Faraday rotation θF and ellipticity ηF can be reconstructed from three images for different polarization states, LP, RCP and LCP, by calculating at each pixel using the following formulae.
where ILP, IRCP, and ILCP are intensities at each pixel for LP, RCP, and LCP, respectively. For small values of θF and ηF less than a few degrees, Eq. 68 can be reduced to simple expressions (69) by replacing |Ex|2 with (ILCP + IRCP) as follows,
Optical retardation can be modulated in a few tenths of a second by changing AC voltages applied to the LCM, which provides a possibility of real-time imaging using the polarization modulation technique.
Figure 13 provides a measurement setup for the polar magneto-optical Kerr effect for a wide spectral region from near-ultraviolet to near-infrared region. The system consists of a light source, a monochromator, a polarizer, a photo-elastic modulator, an analyzer, ellipsoidal mirrors, and a detector. As the light source, we use a halogen tungsten lamp for the visible to infrared wavelength region and a Xenon lamp for the near-ultra-violet ∼ visible ∼ near-infrared region. The halogen tungsten lamp shows a flat spectral distribution, while the Xenon lamp has a high light intensity for the short wavelength region but has a drawback of line spectra in the near-infrared region. For wavelengths shorter than 200 nm a deuterium lamp is employed. For the monochromator, we select one with a small f-number (f = 3–4) At the expense of high resolution. It is common to prepare two or three diffraction gratings with different blaze-wavelengths according to the wavelength region. Since xenon lamps bring stray light to the monochromator, it is desirable to use a double-monochromator. For the spectroscopic measurement in a wide wavelength region, it is desirable to construct the light condensing system using ellipsoidal mirrors with less chromatic aberration. As a polarizer and analyzer, we recommend the use of a MgF2-made Rochon prism polarizer. Since this type of polarizer has a double image, a slit is used to cut unnecessary polarization. Finally, as a detector, we use a photomultiplier with a compound-semiconductor cathode having lowered affinity for 200–1800 nm. For longer wavelengths, we use a cooled CdHgTe photodiode.
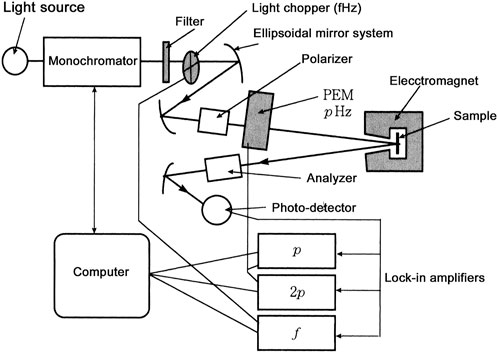
FIGURE 13. Spectroscopic measurement setup for polar magneto-optical Kerr effect for wide spectral region from near-ultraviolet to near infrared region.
Figure 14 shows a schematic diagram of the MO spectrometer utilizing the polarization modulation method with a multichannel spectrometer. A halogen lamp is used as a light source, and a multi-channel spectrometer having a detection range of 350–1000 nm, with a 2048-element linear silicon CCD array detector, is used as a light detector.

FIGURE 14. Schematic diagram of the MO spectrometer utilizing the polarization modulation method with a multichannel spectrometer. LS: light source (halogen tungsten lamp), L1 L2 L3: collimating lenses, ph: pinhole, P: polarizer, Q: quarter wave plate, EM: electromagnet, S: sample, A: analyzer, D: multi-channel spectrometer with a 2048-element linear silicon CCD array detector.
For the MO measurement, collimating lenses (L1, L2, L3), pinhole (ph), polarizer (P), perforated electromagnet (EM), and an analyzer (A) were used. A quarter wave plate (Q) was used to carry out the polarization modulation method. The Q will be rotated by a stepping motor. The transmission axis of the analyzer (α) forms an angle of 45° with the polarizer, and the Q will be set to −45°, 0°, and +45° with the polarizer for the measurement.
The procedure of measurement of the Faraday rotation and Faraday ellipticity spectra is as follows. While applying a magnetic field to the sample, the optical axis of the Q is set to −45°, 0°, and +45°, corresponding to left-circularly, linearly and right-circularly polarized light, respectively. Those three polarized light intensity spectra were measured, and Faraday rotation angle (θF) and Faraday ellipticity angle (ηF) are calculated by the following Eq. 69,
where I−45°, I0, and I45° are light intensities when the optical axis of the Q is −45°, 0°, and 45°. The units of the values obtained by Eq. 70 are radians.
As described in section 2, MO effects are derived from the off-diagonal element
In the analysis, we calculate the spectrum of phase shift
The integral requires spectral data for ω from 0 to
From Faraday rotation θF and Faraday ellipticity ηF, we get the real and imaginary part of the off-diagonal element of permittivity tensor as follows.
From MOKE rotation θK and MOKE ellipticity ηK, we get real and imaginary part of the off-diagonal element of permittivity tensor as follows.
As described in subsection 2,2,5, the Cotton-Mouton effect is a MO effect in the Voigt configuration, where the applied magnetic field is perpendicular to the light propagation. The effect appears as magnetically induced optical retardation. The experimental setup (Figure 15) consists of a polarizer, a photo-elastic modulator PEM, a sample, an analyzer, and a detector. The polarization angle of both the polarizer and the analyzer is set 45° to the optic axis of PEM.
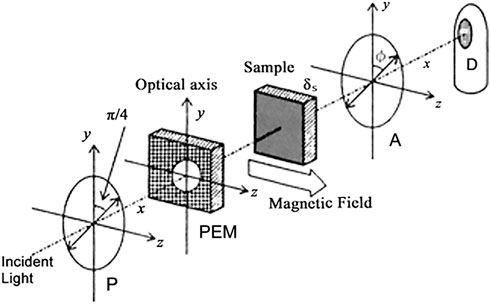
FIGURE 15. Experimental setup for measurement of Cotton Mouton effect, which consists of a polarizer P, a photo-elastic modulator PEM, a sample, an analyzer A, and detector D.
Assuming optical retardation is described as
By taking a ratio of the p-component to the DC component we obtain optical retardation of the sample.
First, we have described the fundamentals of the magneto-optical effect from macroscopic and microscopic stand-point, to demonstrate that off-diagonal element of electric permittivity, as well as the contribution of a diagonal element, have crucial importance for the interpretation of magneto-optical spectra of materials. Next, we described different measurement techniques of magneto-optical effect, with particular reference to the retardation modulation technique.
We hope that this review article will be useful for beginners in magneto-optics research.
All authors listed have made a substantial, direct, and intellectual contribution to the work and approved it for publication.
The authors declare that the research was conducted in the absence of any commercial or financial relationships that could be construed as a potential conflict of interest.
All claims expressed in this article are solely those of the authors and do not necessarily represent those of their affiliated organizations, or those of the publisher, the editors and the reviewers. Any product that may be evaluated in this article, or claim that may be made by its manufacturer, is not guaranteed or endorsed by the publisher.
The Supplementary Material for this article can be found online at: https://www.frontiersin.org/articles/10.3389/fphy.2022.946515/full#supplementary-material
1. K. Sato . Light and Magnetism (revised edition). in Japanese: Asakurashoten Chap.3-4 (2001). p. 25–89. (ISBN 4-254-13628-5 C3342).
3. Argyres PN. Theory of the Faraday and Kerr effects in ferromagnetics. Phys Rev (1955) 97:334–45. doi:10.1103/physrev.97.334
5. Sato K, Ikekame H, Hongu H, Fujisawa M, Takanashi K, Fujimori H. Reflectivity Spectra in As-Polished and Annealed PtMnSb between 0.5 eV and 25 eV Measured by Synchrotron Radiation, Proc Int Conf Ferrites (1992). p. 1647–1650.
6. Kubo R. Statistical-mechanical theory of irreversible processes. I. General theory and simple applications to magnetic and conduction problems. J Phys Soc Jpn (1957) 12:570–86. doi:10.1143/jpsj.12.570
7. Kahn FJ, Persian PS, Remeika JP. Ultraviolet magneto-optical properties of single-crystal orthoferrites, garnets, and other ferric oxide compounds. Phys Rev (1969) 186:891–918. doi:10.1103/physrev.186.891
8. Erskine JL, Stern EA. Magneto-optic Kerr effect in Ni, Co, and Fe. Phys Rev Lett (1973) 30:1329–32. doi:10.1103/physrevlett.30.1329
9. Sato K. “Magneto-optical measurents” in Magnetic measurements” 1, eds. K. Kon, and H. Yasuoka, Maruzen, 2000 (in Japanese) (ISBN 4-621-04716-7 C3342)Chap.6, pp203-249.
10. Sato K. Measurement of magneto-optical Kerr effect using piezo-birefringent modulator. Jpn J Appl Phys (1981) 20:2403–9. doi:10.1143/jjap.20.2403
11. Sato K, Hongu H, Ikekame H, Tosaka Y, Watanabe M, Takanashi K. Magnetooptical Kerr spectrometer for 1.2-5.9 eV region and its application to FePt/Pt multilayers. Jpn J Appl Phys (1993) 32:989–95. doi:10.1143/jjap.32.989
12. Ishibashi T, Kuang Z, Yufune S, Kawata T, Oda M, Tani T, Magneto-optical imaging using polarization modulation method. J Appl Phys (2006) 100:093903. doi:10.1063/1.2357699
Keywords: magneto-optics, spectroscopy, electronic structures, measurements, ferromagnet
Citation: Sato K and Ishibashi T (2022) Fundamentals of Magneto-Optical Spectroscopy. Front. Phys. 10:946515. doi: 10.3389/fphy.2022.946515
Received: 17 May 2022; Accepted: 13 June 2022;
Published: 11 October 2022.
Edited by:
Rui Min, Beijing Normal University, ChinaReviewed by:
Hang Yin, Shandong University, ChinaCopyright © 2022 Sato and Ishibashi. This is an open-access article distributed under the terms of the Creative Commons Attribution License (CC BY). The use, distribution or reproduction in other forums is permitted, provided the original author(s) and the copyright owner(s) are credited and that the original publication in this journal is cited, in accordance with accepted academic practice. No use, distribution or reproduction is permitted which does not comply with these terms.
*Correspondence: Katsuaki Sato, a2F0c3Vha2kuc2F0b2xAbmlmdHkuY29t
Disclaimer: All claims expressed in this article are solely those of the authors and do not necessarily represent those of their affiliated organizations, or those of the publisher, the editors and the reviewers. Any product that may be evaluated in this article or claim that may be made by its manufacturer is not guaranteed or endorsed by the publisher.
Research integrity at Frontiers

Learn more about the work of our research integrity team to safeguard the quality of each article we publish.