- 1Benjamin Levich Institute and Department of Chemical Engineering, CUNY City College of New York, New York, NY, United States
- 2Martin Fisher School of Physics, Brandeis University, Waltham, MA, United States
Dense suspensions of particles in viscous liquid often demonstrate the striking phenomenon of abrupt shear thickening, where their viscosity increases strongly with increase of the imposed stress or shear rate. In this work, discrete-particle simulations accounting for short-range hydrodynamic, repulsive, and contact forces are performed to simulate flow of shear thickening bidisperse suspensions, with the packing parameters of large-to-small particle radius ratio δ = 3 and large particle fraction ζ = 0.15, 0.50, and 0.85. The simulations are carried out for volume fractions 0.54 ≤ ϕ ≤ 0.60 and a wide range of shear stresses. The repulsive forces, of magnitude FR, model the effects of surface charge and electric double-layer overlap, and result in shear thinning at small stress, with shear thickening beginning at stresses σ ∼ FRa−2. A crossover scaling analysis used to describe systems with more than one thermodynamic critical point has recently been shown to successfully describe the experimentally-observed shear thickening behavior in suspensions. The scaling theory is tested here on simulated shear thickening data of the bidisperse mixtures, and also on nearly monodisperse suspensions with δ = 1.4 and ζ = 0.50. Presenting the viscosity in terms of a universal crossover scaling function between the frictionless and frictional maximum packing fractions collapses the viscosity for most of the suspensions studied. Two scaling regimes having different exponents are observed. The scaling analysis shows that the second normal stress difference N2 and the particle pressure Π also collapse on their respective curves, with the latter featuring a different exponent from the viscosity and normal stress difference. The influence of the fraction of frictional contacts, one of the parameters of the scaling analysis, and its dependence on the packing parameters are also presented.
1 Introduction
Suspensions of solid particles in liquids, under highly concentrated or ‘dense’ conditions in which the volume fraction ϕ approaches the jamming fraction, can exhibit strong shear thickening. This is seen as an abrupt increase in apparent viscosity η with increasing shear stress σ or shear rate
Based on the lubrication-to-frictional transition scenario [12], Wyart and Cates (WC) [10] developed a model where shear thickening viscosity η is controlled by divergences at two jamming volume fractions:
Rheological experiments were carried out by Guy et al. [17] on monodisperse suspensions of poly-methylmethacrylate particles sterically stabilized by poly-12-hydroxystearic acid, where the data are shown to be fitted by the WC model. This model’s predictions were, however, found [18] to exhibit significant discrepancies from the experimental data for binary mixtures of spheres with large-to-small particle size ratio δ = 4. This was especially pronounced for cases with a predominance of particle volume from the large particles. Unlike monodisperse systems, where there is only one type of frictional contact, the bidisperse systems have three different types of frictional contact coming from the large-large, the large-small, and the small-small particles contact that contribute to stress development differently. This motivates our consideration of suspensions with significant bidispersity.
A recent study [19] showed that the WC model can be framed in the language of crossover scaling. Specifically, the shear thickening transition was described in terms of a crossover between two critical points, at each of which the viscosity diverges, the frictionless
where the scaling variable
with g allowing dependence on variables beyond the stress dependence of f(σ), and
The scaling of the viscosity presented in Eq. 2 resembles a well-known form called crossover scaling. An alternative way of representing this scaling, which is better suited to identifying any change in the nature of the divergence with g (σ, ϕ) is the Cardy scaling form [20]. Cardy scaling is typically applied in study of critical points and phase transitions in thermal equilibrium systems, among which a well-known example is that of magnetic systems described by Heisenberg and Ising models. These differ in their symmetry properties [21], as the Heisenberg model is isotropic, whereas the Ising model has uniaxial symmetry as it considers a single component of the vector spin. Based on these different symmetry properties, the two models for magnetic systems show different universality classes characterized by different critical exponents and scaling functions [22], and a crossover in the dominant singularity may be observed. Analogously, the dense suspension that undergoes shear thickening by the lubricated-to-frictional mechanism also consists of different states, namely frictionless and frictional. Note that the function g (σ, ϕ) plays the same role as the uniaxial anisotropy plays in the Heisenberg-Ising crossover, but the suspension crossover does not involve a clear change of symmetry. Ramaswamy et al. [19] expressed the scaling function for the viscosity in the Cardy scaling form
where
In this work, we apply the scaling approach presented in Ramaswamy et al. [19] to dense suspension rheological data obtained from numerical simulation. We consider nearly-monodisperse systems, as well as more strongly bidisperse systems of varying large particle fraction. The analyses of the simulation data are carried out by two different approaches. We first consider the critical exponents and scaling functions. Following this, we implement Cardy scaling to study the crossover behavior.
2 Methods
Shear thickening has been observed in molecular dynamics simulations [23], including approaches which also introduce friction to the particle interactions [24]. Here, we prefer to consider the viscous fluid effects, but in a simplified fashion relative to the more rigorous Stokesian Dynamics [25, 26]. To this end, we use the lubrication flow-discrete element model (LF-DEM) [6] to simulate shear flow of dense suspensions of non-Brownian frictional spheres immersed in a viscous Newtonian fluid under an imposed shear stress σ. With a repulsive interaction and contact forces including friction, this method has been found to successfully describe the flow of dense suspensions [11], and to closely reproduce essential features of DST and shear jamming seen experimentally [5]. Recent work [27] has extended this approach to include a rolling friction [28], but here we consider only frictional resistance to slipping of the contact.
Our typical simulation is performed using 1,000 particles in a cubic box with periodic boundary conditions, to mimic an infinite system. Shear flow is imposed using Lees-Edwards boundary conditions. The suspensions studied in this work are bidisperse with as and al as the radii of the smaller and larger particles, respectively, with the size ratio defined as δ ≡ al/as. The motion of particles is considered inertialess, i.e. to be at particle Reynolds number
The hydrodynamic forces are of the form FH = −RFU ⋅ (U − U∞) + RFE: E∞, where U is the particle translational and angular velocity,
A repulsive electrical double layer (EDL) force maintains the particle surface separation at low stress. The force decays exponentially with the interparticle gap h over the length scale defined by Debye length κ−1 as
The repulsive force sets the level of the critical stress, such that when the applied stress σ ≪ σ0, the interactions between the particles are lubricated (frictionless). When σ ≫ σ0, the interactions are predominately frictional contacts. At each time step, we evaluate FR and FC and solve the equation of motion for the particle velocities,
The stress-controlled simulations were performed over a range of dimensionless shear stresses of 0.3 ≤ σ/σ0 ≤ 562. Each simulation was run to
3 Results
We present the results of the scaling analysis for all suspensions studied, first applying it to prior work on nearly monodisperse suspensions [15] with δ = 1.4 and ζ = 0.50 for volume fractions 0.52 ≤ ϕ ≤ 0.63 and shear stresses 0.1 ≤ σ/σ0 ≤ 100. For brevity, we call these suspensions monodisperse, as the slight bidispersity avoids the layering or string ordering of particles subjected to shear flow [30] but the shear thickening at δ = 1.4 is found to differ little from smaller δ = 1.2 [11]. We then present the scaling analysis applied to our rheological property data for bidisperse suspensions with δ = 3 and varying ζ = 0.15, 0.50, and 0.85 for 0.54 ≤ ϕ ≤ 0.60 and 0.3 ≤ σ/σ0 ≤ 562. Unless otherwise stated, we model the fraction of frictional contacts as
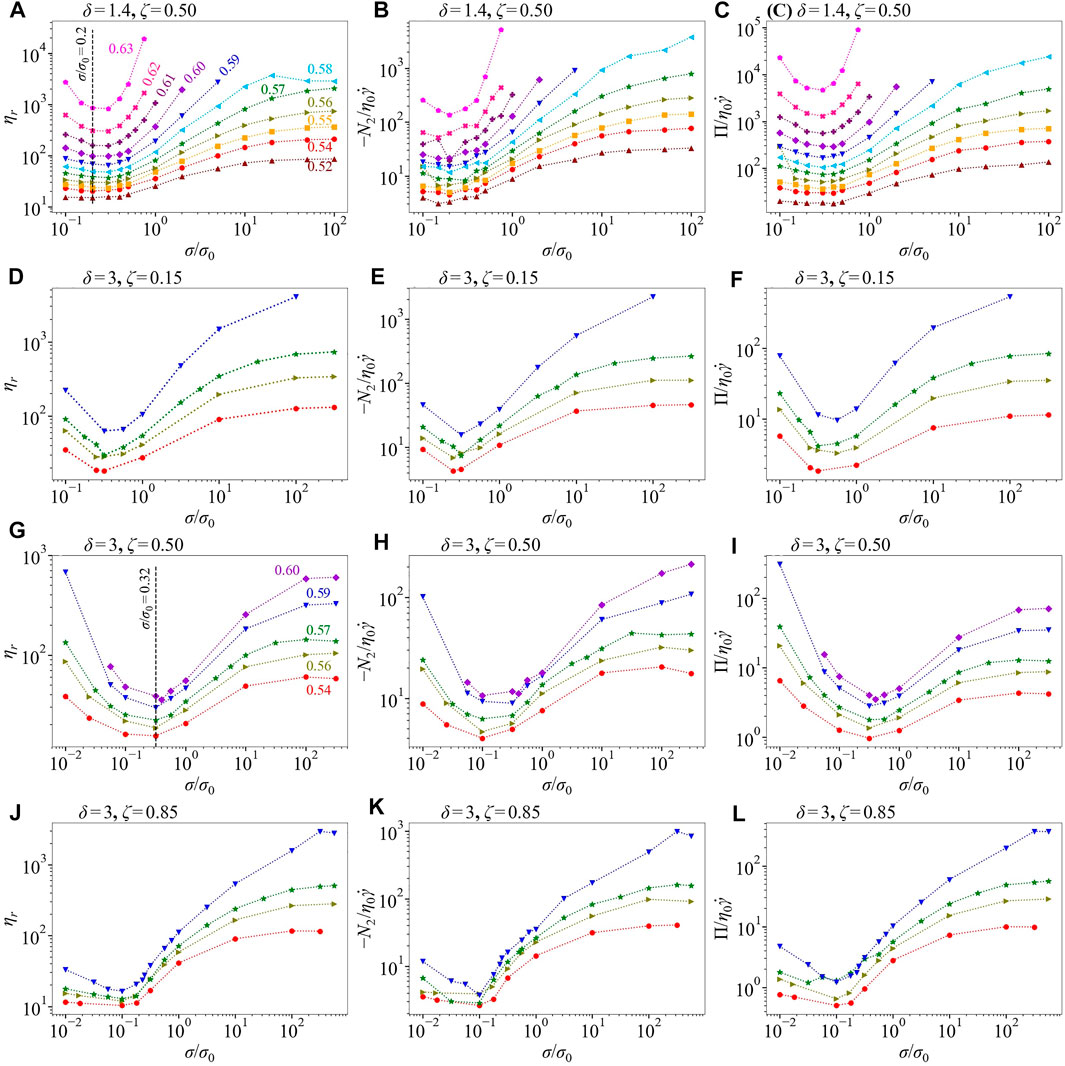
FIGURE 1. Rheology of simulated suspensions as a function of dimensionless shear stress. Row 1: Nearly monodisperse suspensions, δ = 1.4 and ζ = 0.50; rows 2–4: bidisperse suspensions. Row 2: δ = 3 and ζ = 0.15; row 3: δ = 3 and ζ = 0.50; row 4: δ = 3 and ζ = 0.85 (A) (D) (G) (J): relative viscosity ηr (B) (E) (H) (K): the second normal stress difference plotted as
As the two scaling methods we apply in this work have not previously been applied to simulated suspension rheology data, we provide some guidance before presenting our results. The two methods (which we will call crossover and Cardy scaling) have the same content, but the insights gained from the two are different. In the crossover scaling analysis (presented in Figure 2, and 4–6), the scaling approach can be seen based on the WC [10] form of the viscosity
where, as defined previously,
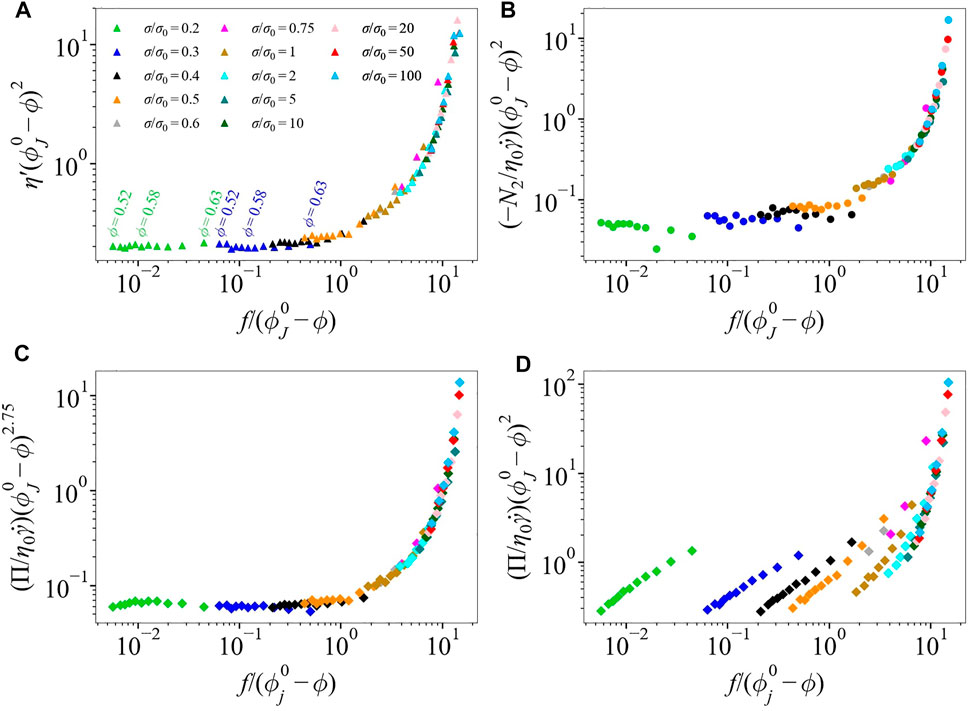
FIGURE 2. The scaling functions (A)
Thus we see that if x → xc, there are two possible divergences. From the crossover scaling analysis we find the data presented as
Plotting η′f2 as a function of
3.1 Monodisperse Suspensions
We first consider the scaling of data for δ = 1.4. This data was previously fitted [15] to the forms proposed by Wyart and Cates [10], with
At small values of
For the particle pressure,
We treat the same data shown in Figure 2 using the Cardy scaling approach, as described by Eq. 3 with f(σ) in place of g (σ, ϕ). The two scaling forms have the same physical content, but the Cardy scaling proves better for understanding the precise form of the divergence at the second critical point where f(σ) is large and x ∼ xc. Therefore, it is better at identifying changes in the nature of the divergence (change in exponents) from the frictionless, f(σ) = 0, viscosity divergence to the frictional one. In the Cardy scaling, the viscosity scaling function is
In Figure 3, we plot the scaling function
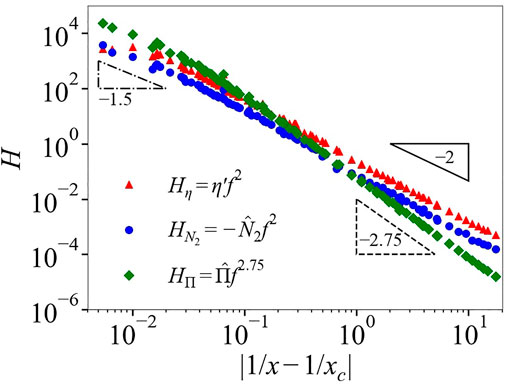
FIGURE 3. Scaling functions
3.2 Bidisperse Suspensions
In this section, we test the scaling of Eq. 1 on our simulation data from bidisperse suspensions. These are at δ = 3 and ζ = 0.15, 0.50, and 0.85 for 0.54 ≤ ϕ ≤ 0.60 and 0.32 ≤ σ/σ0 ≤ 562. Based on the scaling procedure, we find that the data collapse requires frictionless maximum packing fractions of
In Figure 4 we plot the viscosity scaling function
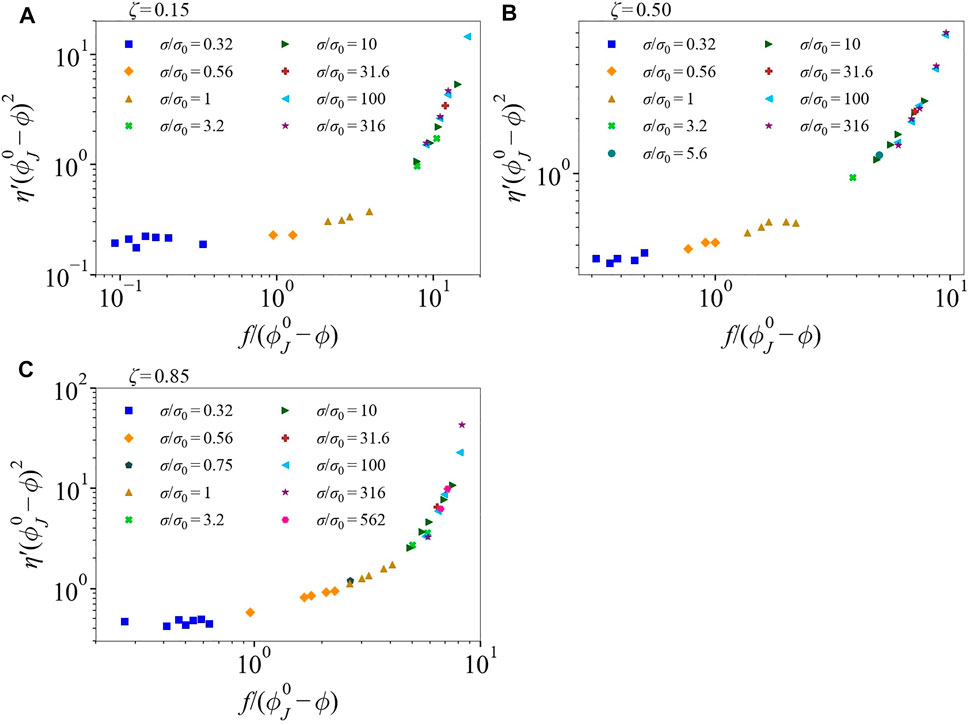
FIGURE 4. The scaling function
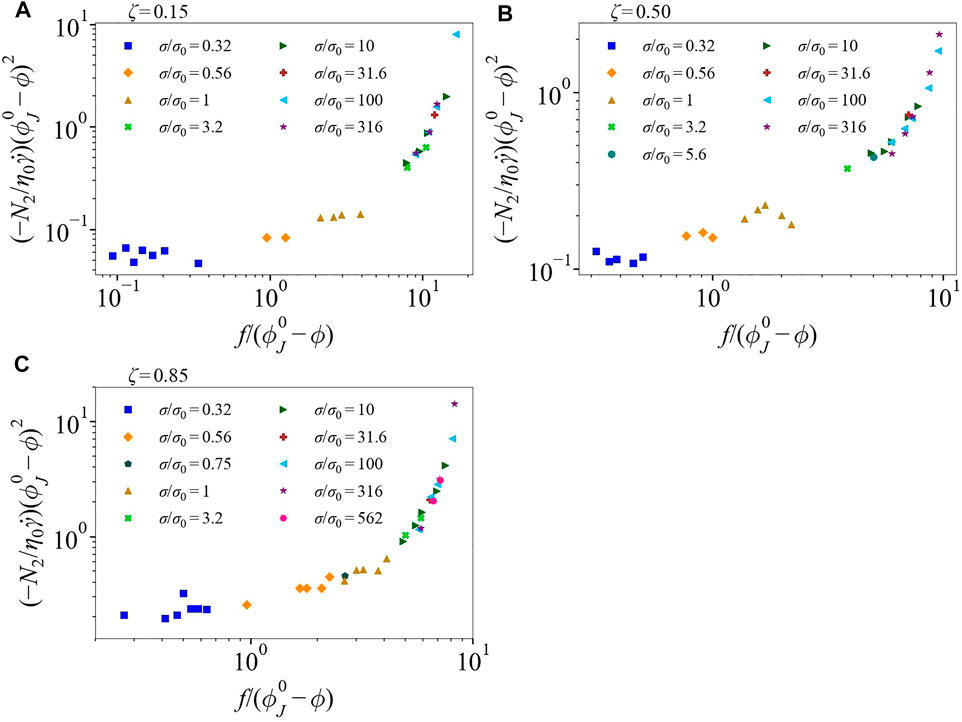
FIGURE 5. The scaling function
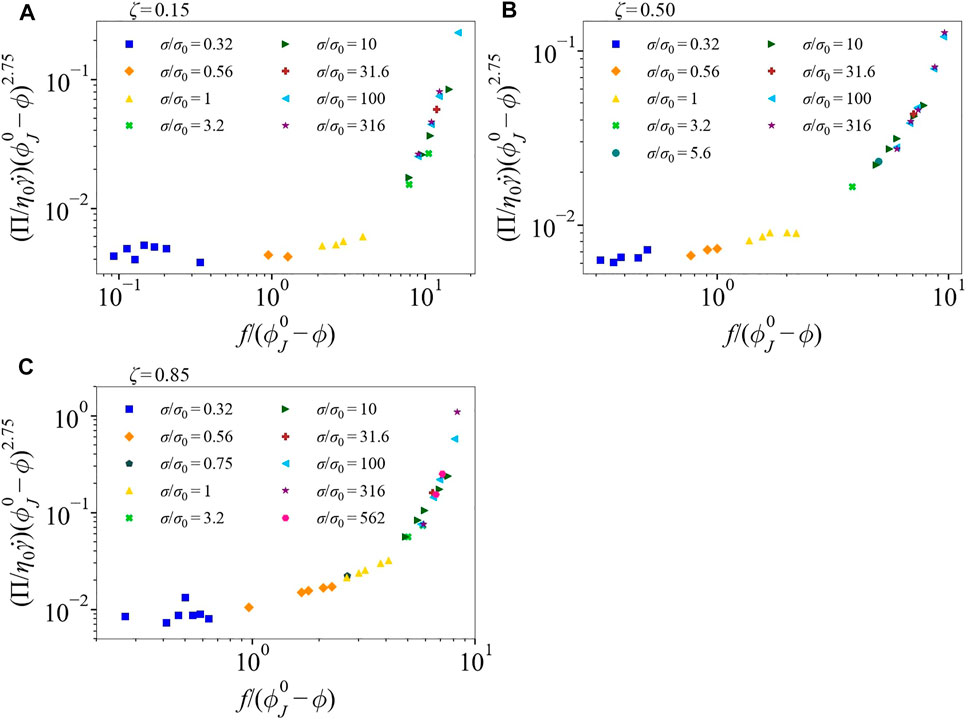
FIGURE 6. The scaling function
For ζ = 0.15, we use f(σ) = exp (σ*/σ), as done for the monodisperse suspension data. For ζ = 0.50 and 0.85, however, we have to modify the expression. To do so, we fit the function manually, calling the result ffit, in order that the data collapse to their respective curves. The selected values are the same for any fixed value of σ/σ0, consistent with f = ffit being a function only of σ and independent of ϕ. It is important to highlight that the ζ = 0.15 suspension consists of mostly small particles. This makes the suspension very similar to the monodisperse case with just a few large particles, thus creating no issues with using f(σ) = exp (σ*/σ); note that the dominant fraction is truly monodisperse in this mixture.
To illustrate the form of ffit and how it differs from the exponential f(σ) = exp (σ*/σ), in Figure 7 we plot both forms as a function of dimensionless shear stress σ/σ0. There are significant differences, and these depend on the packing parameters. For ζ = 0.85, ffit is larger compared to the exponential f, with df/dσ being more gradual at low shear stresses σ/σ0 ≤ 3. As shear stress increases, ffit crosses the exponential f and eventually saturates at high shear stress but slightly slower than its counterpart. For ζ = 0.50, ffit is slightly larger than the exponential f at low stresses, but becomes gradually smaller after σ/σ0 ≥ 6 and requires larger stress to saturate. The difference between the forms of f raises the question of how f is related to frictional contacts of different types of particles, i.e. between small-small, small-large, and large-large particles. Note that in the work of Ramaswamy et al. [19], it was found necessary to allow a modification of the function related to the fraction of frictional contacts, g (σ, ϕ) to allow data collapse; in the current work, the added dependence is not on ϕ but on packing parameters.
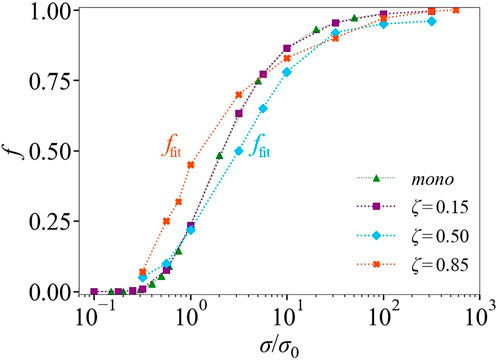
FIGURE 7. Fraction of frictional contacts f and ffit as a function of dimensionless shear stress σ/σ0 for monodisperse suspension δ = 1.4 ζ = 0.50 and bidisperse suspensions δ =3 for ζ = 0.15, 0.50 0.85. For δ = 1.4 with ζ = 0.50 and δ = 3 with ζ = 0.15, the form of f is exponential f(σ) = exp (σ*/σ) with σ* = 1.45. For ζ = 0.50 and 0.85, it is fitted manually f = ffit.
To provide an essentially similar form for each rheological function across all cases, we normalize the scaled data. Scaling each
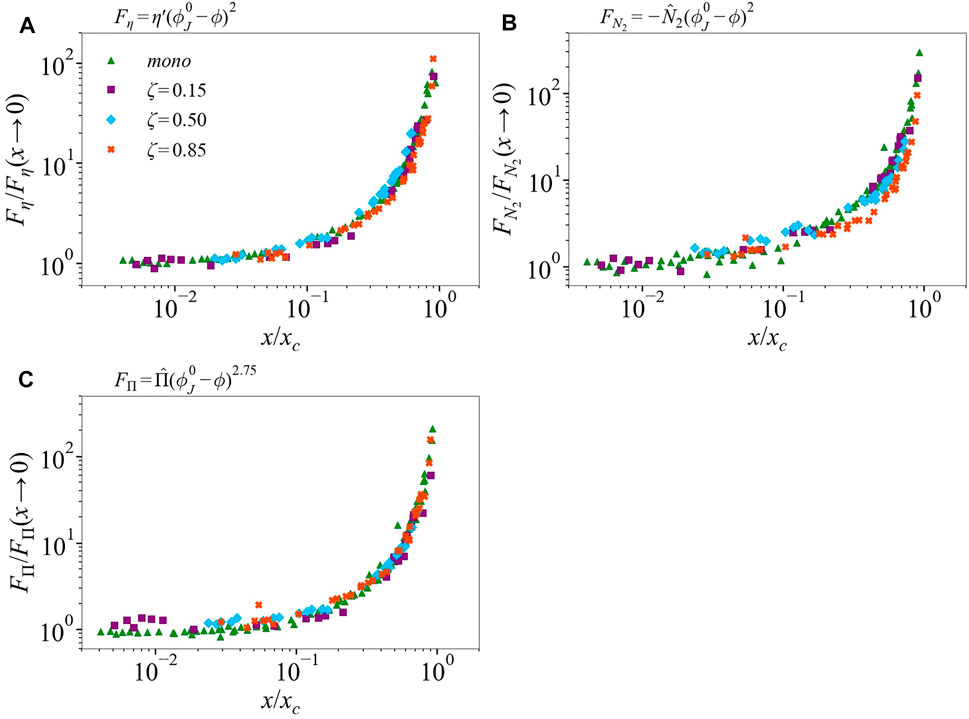
FIGURE 8. Scaling functions (A)
Cardy scaling: We now apply the Cardy scaling to the bidisperse suspension data. We plot the scaling functions
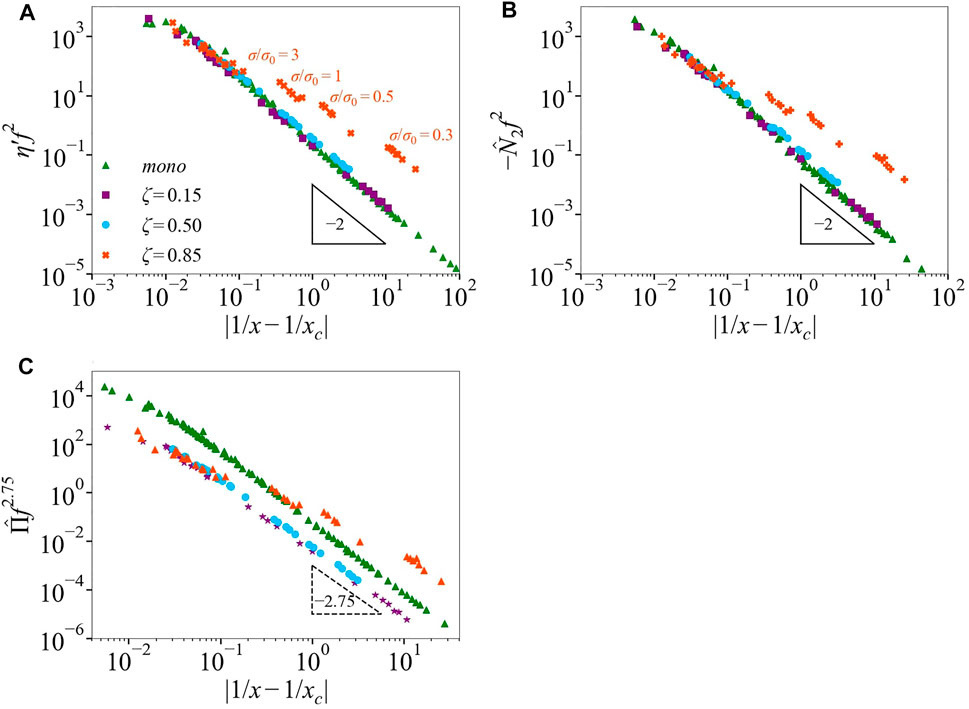
FIGURE 9. The scaling functions (A)
For ζ = 0.15, an excellent collapse on the same curve as the monodisperse data is found over almost five orders of magnitude in the scaling variable for η′ and
The Cardy scaling of bidisperse particle pressure data shows two notable features. First is that the scaling requires the different dependence of f2.75 to achieve collapse, and the data for the bidisperse cases do not fall on the line with the nearly monodisperse data, but both have power law scaling with an exponent of −2.75 at larger values of |1/x − 1/xc| (lower stress). Similar to η′ and
The crossover behavior for both monodisperse and bidisperse suspensions is in line with the findings from experimental work of Ramaswamy et al. [19] carried out for two different suspensions, cornstarch in glycerol and silica particles in glycerol-water mixtures. On the other hand, this appears to disagree with the previous simulation work [32], where the monodisperse (δ = 1.4, ζ = 0.50) and bidisperse (δ = 3 and four for ζ = 0.15, 0.50, 0.85) viscosity data were shown to diverge with a single exponent as
4 Conclusion
We have carried out a scaling analysis on the rheology determined from simulations of shear-thickening suspensions. This is the first application of the crossover and Cardy scaling to simulated suspension rheology data. Our analysis includes nearly monodisperse suspensions studied in prior work [15] and bidisperse suspensions with particle size ratio δ = 3 for fractions of the particle volume occupied by large particles given by ζ = 0.15, 0.50, and 0.85. We considered first a critical exponent approach and then Cardy scaling. We showed that the singular part of the suspension relative viscosity given by η′ = ηr − (1 + 5ϕ/2) exhibits critical scaling, with the data collapsing to a universal curve when plotted as
The normal stress response was also found to follow the scaling, albeit with more scatter. Adapting Eq. 1 for
The Cardy scaling analysis revealed a change in the exponent for the divergences of η′,
We have also demonstrated that the fraction of frictional contacts f necessary to obtain collapse differs in form depending on the suspension packing parameters. Specifically, for monodisperse suspensions and the bidisperse ζ = 0.15-suspensions, f follows the exponential form
Data Availability Statement
The raw data supporting the conclusion of this article will be made available by the authors, without undue reservation.
Author Contributions
NM performed the simulations. NM, AS, and JM analyzed the data. BC conceived the scaling analysis approach for the system under study and oversaw its application. JM developed the simulation approach and designed the study of the bidisperse suspensions. All authors wrote the manuscript.
Funding
This work was supported by a collaborative grant, NSF CBET-1916877 (BC) and NSF CBET- 1916879 (JM). Computations resulting in this work were supported, in part, under the NSF grants CNS-0958379, CNS-0855217, and ACI-1126113 to the City University of New York High Performance Computing Center at the College of Staten Island.
Conflict of Interest
The authors declare that the research was conducted in the absence of any commercial or financial relationships that could be construed as a potential conflict of interest.
Publisher’s Note
All claims expressed in this article are solely those of the authors and do not necessarily represent those of their affiliated organizations, or those of the publisher, the editors and the reviewers. Any product that may be evaluated in this article, or claim that may be made by its manufacturer, is not guaranteed or endorsed by the publisher.
Acknowledgments
The authors are grateful to Abhinendra Singh (University of Chicago) for providing data for the δ = 1.4 suspension. We are grateful for support in the simulation effort from Romain Mari (CNRS, Grenoble).
Supplementary Material
The Supplementary Material for this article can be found online at: https://www.frontiersin.org/articles/10.3389/fphy.2022.946221/full#supplementary-material
References
1. Barnes HA. Shear Thickening ("Dilatancy") in Suspensions of Nonaggregating Solid Particles Dispersed in Newtonian Liquids. J Rheol (1989) 33(2):329–66. doi:10.1122/1.550017
2. Wagner NJ, Brady JF. Shear Thickening in Colloidal Dispersions. Phys Today (2009) 62(10):27–32. doi:10.1063/1.3248476
3. Peters IR, Majumdar S, Jaeger HM. Direct Observation of Dynamic Shear Jamming in Dense Suspensions. Nature (2016) 532(7598):214–7. doi:10.1038/nature17167
4. Brown E, Jaeger HM. Shear Thickening in Concentrated Suspensions: Phenomenology, Mechanisms and Relations to Jamming. Rep Prog Phys (2014) 77(4):046602. doi:10.1088/0034-4885/77/4/046602
5. Morris JF. Shear Thickening of Concentrated Suspensions: Recent Developments and Relation to Other Phenomena. Ann Rev Fluid Mech (2020) 52, 121. doi:10.1146/annurev-fluid-010816-060128
6. Seto R, Mari R, Morris JF, Denn MM. Discontinuous Shear Thickening of Frictional Hard-Sphere Suspensions. Phys Rev Lett (2013) 111(21):218301. doi:10.1103/physrevlett.111.218301
7. Lin NYC, Guy BM, Hermes M, Ness C, Sun J, Poon WCK, et al. Hydrodynamic and Contact Contributions to Continuous Shear Thickening in Colloidal Suspensions. Phys Rev Lett (2015) 115(22):228304. doi:10.1103/physrevlett.115.228304
8. Lootens D, Van Damme H, Hémar Y, Hébraud P. Dilatant Flow of Concentrated Suspensions of Rough Particles. Phys Rev Lett (2005) 95(26):268302. doi:10.1103/physrevlett.95.268302
9. Brown E, Jaeger HM. Dynamic Jamming point for Shear Thickening Suspensions. Phys Rev Lett (2009) 103(8):086001. doi:10.1103/PhysRevLett.103.086001
10. Wyart M, Cates ME. Discontinuous Shear Thickening without Inertia in Dense Non-brownian Suspensions. Phys Rev Lett (2014) 112(9):098302. doi:10.1103/PhysRevLett.112.098302
11. Mari R, Seto R, Morris JF, Denn MM. Shear Thickening, Frictionless and Frictional Rheologies in Non-brownian Suspensions. J Rheol (2014) 58(6):1693–724. doi:10.1122/1.4890747
12. Morris JF. Lubricated-to-frictional Shear Thickening Scenario in Dense Suspensions. Phys Rev Fluids (2018) 3(11):110508. doi:10.1103/physrevfluids.3.110508
13. O'Hern CS, Silbert LE, Liu AJ, Nagel SR. Jamming at Zero Temperature and Zero Applied Stress: The Epitome of Disorder. Phys Rev E Stat Nonlin Soft Matter Phys (2003) 68(1):011306. doi:10.1103/PhysRevE.68.011306
14. Morris JF, Boulay F. Curvilinear Flows of Noncolloidal Suspensions: The Role of normal Stresses. J Rheol (1999) 43(5):1213–37. doi:10.1122/1.551021
15. Singh A, Mari R, Denn MM, Morris JF. A Constitutive Model for Simple Shear of Dense Frictional Suspensions. J Rheol (2018) 62(2):457–68. doi:10.1122/1.4999237
16. Royer JR, Blair DL, Hudson SD. Rheological Signature of Frictional Interactions in Shear Thickening Suspensions. Phys Rev Lett (2016) 116(18):188301. doi:10.1103/physrevlett.116.188301
17. Guy BM, Hermes M, Poon WCK. Towards a Unified Description of the Rheology of Hard-Particle Suspensions. Phys Rev Lett (2015) 115(8):088304. doi:10.1103/physrevlett.115.088304
18. Guy BM, Ness C, Hermes M, Sawiak LJ, Sun J, Poon WCK. Testing the Wyart-Cates Model for Non-brownian Shear Thickening Using Bidisperse Suspensions. Soft Matter (2020) 16(1):229–37. doi:10.1039/c9sm00041k
19. Ramaswamy M, Griniasty I, Liarte DB, Shetty A, Katifori E, Del Gado E, et al. Universal Scaling of Shear Thickening Transitions. arXiv preprint arXiv:2107.13338 (2021).
20. Cardy J. Scaling and Renormalization in Statistical Physics. Cambridge: Cambridge University Press (1996).
21. Greiner W, Neise L, Stöcker H. The Models of Ising and Heisenberg. In: Thermodynamics and Statistical Mechanics. New York: Springer (1995). p. 436–56. doi:10.1007/978-1-4612-0827-3_18
22. Kadanoff LP. Critical Behavior. Universality and Scaling. In: MS Green, editor. Proceedings of the International School of Physics ’Enrico Fermi’ Course LI. New York: Italian Physical Society, Academic Press (1971). p. 100–17.
23. Loose W, Hess S. Rheology of Dense Model Fluids via Nonequilibrium Molecular Dynamics: Shear Thinning and Ordering Transition. Rheol Acta (1989) 28(2):91–101. doi:10.1007/bf01356970
24. Heussinger C. Shear Thickening in Granular Suspensions: Interparticle Friction and Dynamically Correlated Clusters. Phys Rev E Stat Nonlin Soft Matter Phys (2013) 88(5):050201. doi:10.1103/PhysRevE.88.050201
25. Sierou A, Brady JF. Rheology and Microstructure in Concentrated Noncolloidal Suspensions. J Rheol (2002) 46(5):1031–56. doi:10.1122/1.1501925
26. Jamali S, Brady JF. Alternative Frictional Model for Discontinuous Shear Thickening of Dense Suspensions: Hydrodynamics. Phys Rev Lett (2019) 123(13):138002. doi:10.1103/physrevlett.123.138002
27. Singh A, Ness C, Seto R, de Pablo JJ, Jaeger HM. Shear Thickening and Jamming of Dense Suspensions: The “Roll” of Friction. Phys Rev Lett (2020) 124(24):248005. doi:10.1103/physrevlett.124.248005
28. Estrada N, Azéma E, Radjai F, Taboada A. Identification of Rolling Resistance as a Shape Parameter in Sheared Granular media. Phys Rev E Stat Nonlin Soft Matter Phys (2011) 84(1):011306. doi:10.1103/PhysRevE.84.011306
29. Ball RC, Melrose JR. A Simulation Technique for many Spheres in Quasi-Static Motion under Frame-Invariant Pair Drag and Brownian Forces. Physica A (1997) 247(1-4):444–72. doi:10.1016/s0378-4371(97)00412-3
30. Ackerson BJ. Shear Induced Order and Shear Processing of Model Hard Sphere Suspensions. J Rheol (1990) 34(4):553–90. doi:10.1122/1.550096
31. Ness C, Sun J. Shear Thickening Regimes of Dense Non-brownian Suspensions. Soft Matter (2016) 12(3):914–24. doi:10.1039/c5sm02326b
Keywords: scaling, suspension rheology, bidispersity, friction, shear thickening
Citation: Malbranche N, Santra A, Chakraborty B and Morris JF (2022) Scaling Analysis of Shear Thickening Suspensions. Front. Phys. 10:946221. doi: 10.3389/fphy.2022.946221
Received: 17 May 2022; Accepted: 22 June 2022;
Published: 11 July 2022.
Edited by:
Ramon Planet, University of Barcelona, SpainReviewed by:
Abram H. Clark, Naval Postgraduate School, United StatesMartin Kröger, ETH Zürich, Switzerland
Copyright © 2022 Malbranche, Santra, Chakraborty and Morris. This is an open-access article distributed under the terms of the Creative Commons Attribution License (CC BY). The use, distribution or reproduction in other forums is permitted, provided the original author(s) and the copyright owner(s) are credited and that the original publication in this journal is cited, in accordance with accepted academic practice. No use, distribution or reproduction is permitted which does not comply with these terms.
*Correspondence: Jeffrey F. Morris, bW9ycmlzQGNjbnkuY3VueS5lZHU=
 Nelya Malbranche
 Aritra Santra
 Bulbul Chakraborty
 Jeffrey F. Morris