- 1The School of Communication Engineering, Hangzhou Dianzi University, Hangzhou, China
- 2The School of Automation, Beijing Institute of Technology, Beijing, China
- 3Beijing Kedong Electric Power Control System Co., Ltd., Beijing, China
- 4The College of Information Science and Electronic Engineering, Zhejiang University, Hangzhou, China
Extreme events are always accompanied with extensive failures and sharp performance degradation in the power network. This study aims to derive an effective scheme to identify the transmission bottlenecks and improve the power network’s resilience under extreme events. A greedy search scheme is designed for the quick and slow restoration stage to obtain the largest power supply (LPS), which is a significant engineering indicator of the power network. In the quick restoration stage, we use interior point optimization to adjust the operating parameters of undamaged components and maximize the LPS with limited resources. It is worth pointing out that the LPS cannot be further improved, even by increasing the capacities of most transmission links. This phenomenon is due to the existence of transmission bottlenecks, which operate at their capacity limits. Thus, in the slow restoration stage, we identify these transmission bottlenecks and further improve the LPS by expanding the capacities of these links. Case studies show that the proposed greedy search scheme can not only greatly improve the LPS available to the post-disaster network but can also accurately identify the transmission bottlenecks. This work provides practical insights for building resilient infrastructures, although the power network is the object of study.
1 Introduction
A continuous and stable power supply from the power network is an important prerequisite for the normal operation of all commercial activities [1, 2]. However, with the increasing geographical coverage of the power network, a large number of components are exposed to the natural environment for a long time. Various disturbances, especially extreme events, can create significant risks to the safe and stable operation of the power network [3]. Therefore, it is of great practical significance to study the ability to resist disturbances and put forward effective improvement methods for the power network.
Previous studies have developed a series of measures to enhance the reliability of the power network against high-frequency low-impact disturbances [4, 5]. However, low-frequency extreme events, such as cyberattacks and hostile attacks, can also cause multiple physical damage and lead to sharp performance degradation of the power network. For example, in 2015, a power outage was caused in Ukraine by cyberattacks [6]. In 2008, a heavy snowstorm led a large number of transmission lines to fall off in China’s Southern Power Grid [7], which affected a million households and caused huge economic losses.
Considering the lack of restoration from extreme events, power network resilience has been of considerable interest to both academia and industry in recent years [8, 9]. Power network resilience refers to the resistance, adaptation, and restoration ability during violent disturbances [10]. By definition, the whole resilience process should include sharp performance degradation and two restoration stages. Figure 1 illustrates the entire process of power network resilience, from the occurrence of extreme events to full recovery. First, a series of components fall off from the network, which triggers cascading failure [11–13] and causes a sharp decline of power supply in the fast degradation stage. Then, the scheduling department will apply different measures to gradually restore the power supply capacity in the next two restoration stages. According to the actual time scale, the restoration can be divided into two types: 1) quick restoration by power dispatch among the available resources; and 2) slow restoration by expanding the components’ capacities or repairing damaged components.

FIGURE 1. Schematic diagram of the entire resilience process, from the occurrence of disturbances to the full recovery of the power network.
For the three stages during the resilience process, the previous studies have proposed various models and methods to enhance power network resilience. A large number of scholars have modeled cascading failure and studied the impact of different critical factors on performance from a network science perspective by abstracting the power network into graphs [14–18]. Indeed, power network resilience is largely determined by the recovery process that occupies the largest portion of the whole resilience process. Among the various recovery strategies, the optimal power scheduling strategies have been extensively studied because they can achieve quick power supply restoration by coordinating the resources of undamaged components in the post-disaster network. For example, in the quick restoration stage [19], the genetic algorithm and the inner point method have been combined. Meanwhile, a double-loop optimization strategy has been proposed to achieve the largest power supply (LPS) after the occurrence of extreme events [20, 21] and the LPS has been improved through collaborative operation between distributed generators in distribution networks. In addition to the power scheduling strategies, repairing damaged components and expanding the capacities of the transmission links, which need more repair time, can also increase the LPS. For instance, repair strategies to boost the slow recovery process have been proposed [22, 23]. However, capacity-expansion strategies that can further increase the LPS in post-disaster network but have rarely been considered, such as adding enhanced or parallel power cables on existing towers.
The main aim of this study is to boost the resilience of the power network under extreme conditions. An iterative greedy search scheme, which applies the interior point optimization and search algorithm in quick and slow restoration stages, respectively, is designed to achieve the LPS. The quick restoration method is introduced in Section 2, where the operating parameters of the undamaged components are first optimized within their capacities to improve the LPS based on limited post-disaster resources. In Section 3, we show that the LPS can be further improved by increasing the capacities of the remaining links. However, the LPS can only be improved by increasing the capacities of a few transmission links, while most do not show obvious effects. We interpret these critical links that limit the improvement of LPS in the power network as transmission bottlenecks. In light of this, in Section 4 we further design a search algorithm to identify these bottlenecks and obtain the maximum expansion values for each bottleneck to improve the LPS. We then verify the efficiency of the proposed restoration scheme by conducting the simulations on three IEEE Tested Cases, and the conclusions are given in Section 5. This work provides useful advice for the power sector on how to develop restoration strategies to boost the power network’s resilience under extreme conditions.
2 Model Description and Problem Formulation
The occurrence of extreme events can physically damage a large number of components and trigger cascading failure process in a short time. As a result, the system’s performance will degrade dramatically due to the removal of these failed components. In this section, we use interior point optimization to rapidly improve the LPS with limited post-disaster resources by adjusting the operating status of each undamaged component. In the following subsection, we will introduce the cascading failure model and give a description of inter-point optimization.
2.1 Cascading Failure Model
The basic requirement of a power network is to ensure that electricity can be transmitted from the generators to the consumers through transmission lines under a series of electrical constraints. In this article, we denote power network as G = {N, L}, where N represents the set of power nodes and L represents the sets of links. Here, power nodes include the generators and loads nodes, and the power links include the transmission lines and transformers.
Cascade failures can be completed in a surprisingly short time due to violent disturbances caused by extreme events. Here, a widely adopted cascading failure model [24] is briefly described, as follows:
• Step 1: The failed nodes and links are removed from the power network, which changes the network’s structure and thus causes power flow redistribution due to power imbalance.
• Step 2: The working clusters are detected in the post-disaster network. For each cluster, all of the components are defined as outage state if there are no generators for power supply.
• Step 3: The updated power flow of each remaining component is calculated by the AC power flow equation [25]:
Here, Pi and Qi are the active and reactive power of node i; Vi represents the voltage amplitude of node i; θij is the phase angle difference between nodes i and j; Gij and Bij are the real and imaginary parts of the admittance of the link (i, j) connecting nodes i and j; Pij and Qij are the active and reactive power flow through link (i, j).
• Step 4: A new round of overload detection is executed. Each component will be removed once the updated power flow exceeds their operating limits according to constraints (5) to (8).
Constraints (5) to (8) ensure that all of the components operate within their upper and lower bounds.
If there are no overloaded components in the remaining network, then the cascading failure process ends. Otherwise, return to step 1.
After the cascading failures process, the largest power supply—which is a significant indicator to reflect service ability in the power network—of all of the connected clusters decreases sharply. We therefore use the interior point algorithm to improve the LPS of the post-disaster network before taking a slow repair plan.
2.2 Inter-Point Optimization for LPS Improvement
The repair of physically damaged components takes a long time, which makes it difficult for the network to provide enough electricity in a short period of time. Thus, it is practical for an engineer to achieve the largest amount of power supply by properly coordinating the operating parameters of all of the undamaged components in extreme conditions. After the cascading failure process, the original network G can be divided into several interconnected clusters Si. The largest values of the power supply in each cluster can be denoted as LPS(Si). When the network suffers extreme events, we first check the connectivity of the remaining network and calculate the LPS of each connected cluster by using interior point optimization. Thus, the optimization problem of improving the Fmax(G) can be generally represented as follows:
where Nd and Ng represent the sets of load nodes and generation nodes; Fmax(G) is the optimization goal, which is the sum of LPS(Si) of each cluster Si; Pg and Pd are the active power of generation nodes and consumer nodes; and Constraint (10) ensures the power balance between all the generators and loads.
The aforementioned optimization problem is a typical nonlinear problem, which includes many nonlinear constraints in a large-scale power network. The interior point method [26] has the advantage of dealing with such nonlinear and convex optimization problems, and is not sensitive to the scale of the optimization problem. By introducing a utility function, the original optimization can be transformed into an unconstrained problem. Then, the utility function is updated continuously in the optimization iterative process to make the algorithm converge. This is equivalent to building a very high wall on the boundary of the feasible region. When the iteration point is close to the boundary, the objective function increases in vain and produces a punishment to prevent the iteration point from crossing the boundary. Therefore, the optimal solution can be blocked within the feasible region. More details about interior point method are given in [26].
3 Transmission Bottlenecks in the Power Network
The question of how to quickly restore power supply under extreme conditions has been of considerable interest in the field of power network resilience. Compared to cascading failures process and quick restoration strategies, repairing physical damage to components takes a long period of time. To make full use of the available resource in the post-disaster network, we try to improve the LPS based on limited resources by properly adjusting the operating parameters of each undamaged elements.
In this study, we use interior point method to solve the optimization (9)–(11), and obtain the optimal operation parameters of each undamaged component in each cluster Si. Theoretically, the interior point method can be applied to large-scale networks. However, this process often requires a huge amount of computing time. Meanwhile, the purpose of this study is not to study the algorithm’s efficiency but to study the resilience of the power network under extreme events. The size of the simulation network will only change the quantitative results, and will not change the qualitative conclusions. Thus, we conduct the simulations based on three power tested cases—the IEEE 39-Bus Case (IEEE39), IEEE 57-Bus Case (IEEE57) and IEEE 118-Bus Case (IEEE118)[27]—to verify the efficiency of proposed strategy. To better reflect the uncertainty of extreme events, in each tested case we imitate the disturbances caused by extreme disasters by randomly removing 30% links and we then run the simulations 50 times to eliminate the effect of random selection. The number of buses, generators, and transmission links of the three tested power network are shown in Table 1. More system parameters of these three tested networks are provided by [28] in the calculations.

TABLE 1. Number of buses N, generators Ng, and transmission links Nl of the three tested power networks.
The occurrence of extreme events can physically damage multiple components and further cause a fast-cascading failure process. Figure 2 gives the results of LPS after the cascading failure process and the interior point optimization, respectively. The results of the three cases are very similar, which proves that our proposed greedy scheme can effectively improve the LPS by adjusting the operating parameters of undamaged components in the post-disaster network. For example, in IEEE 118-Bus Case, the values of LPS increase from 3421 MW (before the interior point optimization) to 3675 MW (after the interior point optimization). As a result, we can effectively and quickly improve the LPS by adjusting the operating status of each component to achieve the optimal network performance, which can relieve power supply pressure after extreme events occur.
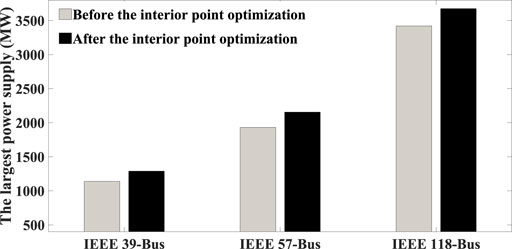
FIGURE 2. Comparison of LPS in three IEEE Tested Cases after the cascading failure process and optimized by the interior point optimization.
After the quick parameters adjustment of each undamaged component in the remaining network, we can obtain the LPS based on limited resources in the post-disaster network. Intuitively, the overall LPS can be further improved if we increase the capacity while the damaged transmission lines are being repaired. However, all of the components in the power network must satisfy electrical constraints, such as Kirchhoff’s law and Ohm’s law. The performance of the whole network depends on a small number of links, which are always limited by voltage or current and run in the boundary state. With this consideration in mind, we study how the capacity increment of undamaged transmission links affect the LPS. Figure 3 gives the results of the improvement ratio of LPS when applying the interior point optimization in the IEEE 118-Bus Case. For each remaining link after an extreme event, we expand the constraint boundary of these links by increasing 1% capacities. From Figure 3, we can find that, for most transmission links, increasing their capacity cannot further improve the LPS of the whole network. On the contrary, there are only a small number of links that directly determine whether the LPS of power network can be further improved. As shown in Figure 4, there are 14 transmission links, whose capacity increment can increase the LPS of the whole network over 1%.
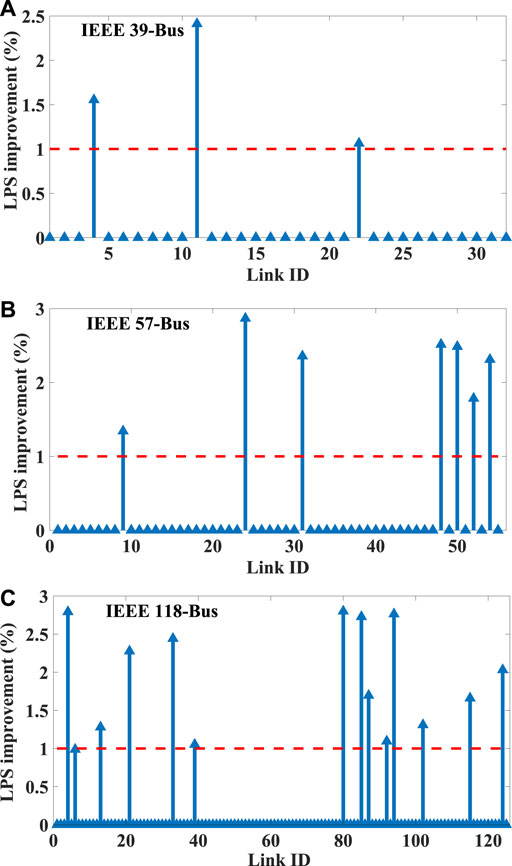
FIGURE 3. LPS improvement by increasing 1% capacity of each transmission link in (A) IEEE 39-Bus Case, (B) IEEE 57-Bus Case, and (C) IEEE 118-Bus Case.
Although we can restore the power supply by rapidly adjusting the operating parameters of each undamaged component under extreme conditions, transmission congestion still exists in the post-disaster network. In other words, the LPS in the post-disaster network is limited by the minimum transmission capacity of a few critical links. In this study, we interpret this congestion phenomenon as transmission bottlenecks, which is a pervasive phenomenon in real networks. One of the basic tasks of many infrastructure networks (e.g., power network, transportation network, and communication network) is to provide a certain amount of flow to the demand through a set of links. The performance of a network is always determined by the bottlenecks, which represent the links with the lowest performance in the entire network. For example, in Figure 5, when the power network is able to generate 3 MW power but the transmission line is only capable of transmitting 1 MW power, then the whole network cannot transmit the entire power generation because it is limited by the transfer capability of the transmission line. To transfer that amount of power, the operators can add new transmission lines or increase the capacity of the remaining lines. Transmission bottlenecks are one of the main challenges that are faced by power utilities in extreme events, and they limit the improvement of the system’s performance. For the sake of clarity, we define a link with transmission bottlenecks as a congestion link, and the link that can alleviate transmission congestion the most is defined as the bottleneck link in the power network.
4 A Greedy Search Scheme for Resilience Improvement
To eliminate the negative effect of transmission bottlenecks, we propose a search algorithm to identify these congestion links, and thus design an iterative greedy search scheme to achieve the LPS under extreme conditions. Inspired by the above analysis, the congestion link identification algorithm expands the capacity of each link to judge whether or not the LPS can be positively improved. Referring to Figure 6, the process of iterative greedy search scheme can be described as follows:
• Step 1: Network Initialization. At the beginning of the scheme, we initialize all of the parameters and topology of the power network, and imitate the damage of extreme disasters by randomly removing 30% of the links.
• Step 2: Connectivity detection. Identify the connected cluster in G after intense disturbances. In each connected cluster Si, all of the components are unserved and removed if cluster Si contains no generator. The LPS of cluster Si is defined as 0 because there is no power source.
• Step 3: Power adjustment. Based on the limited resources after extremes, improve the LPS by adjusting the operating parameters of the remaining components using the interior point optimization.
• Step 4: Capacity expansion. For each link (i, j), we expand their capacity by adding δ to the original capacity at each round and we then recalculate the LPS. If the updated LPS increment ΔLPS is greater than the capacity increment δ, then accumulate the capacity increment of δ for the corresponding link Δij.
• Step 5: Iteration steps. Repeat steps 3-4 until the capacity of each link is increased to their maximum value.
• Step 6: Results output. Select the corresponding links according to the descending order of Δ, and output the set of congestion links and the LPS after quick mode adjustment and elimination of transmission bottlenecks.
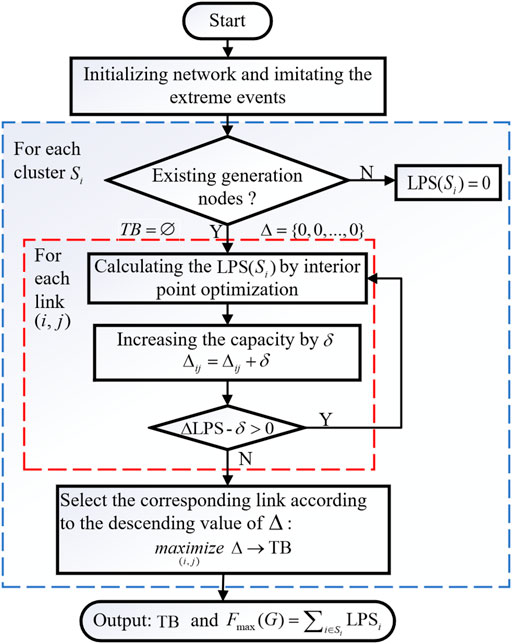
FIGURE 6. The flowchart of the iterative greedy search scheme, which includes the interior point optimization and bottleneck identification algorithm.
Figure 7 shows the values of capacity expansion (blue bars) and their corresponding improvement ratio of LPS (red bars) of each congestion link after extremes. The proposed scheme can effectively identify all of the congestion links in a power network. From Figure 7, we can clearly find that expanding the capacity of these congestion links can improve the LPS of the power network. Specifically, in each case, different congestion links play different roles in improving the performance of the power network. Taking the most congested link as an example, as shown in Table 2, the LPS can be greatly improved by applying the iterative greedy search scheme, comparing with the post-disaster network without any restoration strategy. For example, the value of LPS after a cascading failure process is 3421 MW because multiple components are removed from the network. By properly coordinating the operation parameters of the remaining components, the value of LPS can be increased to 3675 MW. The interior point optimization can make full use of the limited resources in the quick restoration stage. After that, in the slow restoration stage, the LPS can achieve the maximal values by further increasing the capacities of the transmission bottlenecks. Finally, the value of the LPS can achieve 3991 MW, which improves the LPS by 16%.
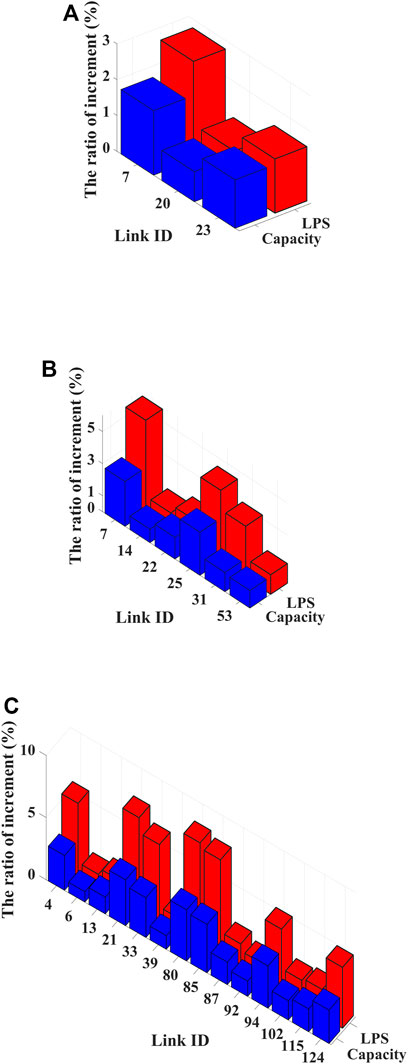
FIGURE 7. The ratio of LPS improvement by increasing the capacity of each congestion link in (A) IEEE 39-Bus Case, (B) IEEE 57-Bus Case, and (C) IEEE 118-Bus Case. In each case, 30% of the nodes are removed from the network by random selection.

TABLE 2. The values of LPS (MW) when the iterative greedy search scheme is applied to the bottleneck link in three IEEE tested cases.
5 Conclusion
The main purpose of this study is to boost the resilience of power networks after extreme events. In light of this, we design an iterative greedy search scheme, which considers the interior point optimization in quick restoration stage and bottlenecks identification algorithm in slow restoration, to obtain the amount of LPS. In the quick restoration stage, we make full use of the remaining resources to improve the LPS by properly adjusting the operation parameters of each undamaged component. However, we find that the LPS cannot be further improved, even by increasing the capacities of most transmission links, and we interpret this congestion phenomenon as transmission bottlenecks. Then, we further propose a bottleneck identification algorithm in the slow restoration stage. By increasing the capacity of these bottlenecks, we can expand the feasible domain of power flow calculation, which can further improve the LPS of the whole power network. Simulation results based on three IEEE tested cases demonstrate that our proposed restoration scheme can efficiently boost the power network’s resilience, and greatly increase the amount of LPS by identifying the transmission bottlenecks and increasing their capacity. This work can provide practical insights when building resilient infrastructures, although we take the power network as a simulation network.
Data Availability Statement
The original contributions presented in the study are included in the article/Supplementary Material; further inquiries can be directed to the corresponding author.
Author Contributions
All authors listed have made a substantial, direct, and intellectual contribution to the work and approved it for publication.
Funding
This work was supported by the Fundamental Research Funds for the Provincial Universities of Zhejiang under Grant GK229909299001-018.
Conflict of Interest
FG was employed by the Beijing Kedong Electric Power Control System Co., Ltd. The remaining authors declare that the research was conducted in the absence of any commercial or financial relationships that could be construed as a potential conflict of interest.
Publisher’s Note
All claims expressed in this article are solely those of the authors and do not necessarily represent those of their affiliated organizations, or those of the publisher, the editors, and the reviewers. Any product that may be evaluated in this article, or claim that may be made by its manufacturer, is not guaranteed or endorsed by the publisher.
Supplementary Material
The Supplementary Material for this article can be found online at: https://www.frontiersin.org/articles/10.3389/fphy.2022.941165/full#supplementary-material
References
1. Jusup M, Holme P, Kanazawa K, Takayasu M, Romić I, Wang Z, et al. Social Physics. Phys Rep (2022) 948:1–148. doi:10.1016/j.physrep.2021.10.005
2. Xia Y, Small M, Wu J. Introduction to Focus Issue: Complex Network Approaches to Cyber-Physical Systems. Chaos (2019) 29:093123. doi:10.1063/1.5126230
3. Wang S, Zhang J, Yue X. Multiple Robustness Assessment Method for Understanding Structural and Functional Characteristics of the Power Network. Physica A: Stat Mech its Appl (2018) 510:261–70. doi:10.1016/j.physa.2018.06.117
4. Eryilmaz S, Bulanık İ, Devrim Y. Reliability Based Modeling of Hybrid Solar/wind Power System for Long Term Performance Assessment. Reliability Eng Syst Saf (2021) 209:107478. doi:10.1016/j.ress.2021.107478
5. Wang Z, Chen G, Liu L, Hill DJ. Cascading Risk Assessment in Power-Communication Interdependent Networks. Physica A: Stat Mech its Appl (2020) 540:120496. doi:10.1016/j.physa.2019.01.065
6. Tu H, Xia Y, Chen X. Vulnerability Analysis of Cyber Physical Systems under the False Alarm Cyber Attacks. Physica A: Stat Mech its Appl (2022) 599:127416. doi:10.1016/j.physa.2022.127416
7. Ye Q. Building Resilient Power Grids from Integrated Risk Governance Perspective: A Lesson Learned from china's 2008 Ice-Snow Storm Disaster. Eur Phys J Spec Top (2014) 223:2439–49. doi:10.1140/epjst/e2014-02218-7
8. Xu F, Si S, Duan D, Lv C, Xie J. Dynamical Resilience of Networks against Targeted Attack. Physica A: Stat Mech its Appl (2019) 528:121329. doi:10.1016/j.physa.2019.121329
9. DeWit A. Japan’s” National Resilience” and the Legacy of 3-11. Asia-Pacific Journal-Japan Focus (2016) 14:1–7. doi:10.1080/09555803.2017.1378698
10. Bie Z, Lin Y, Li G, Li F. Battling the Extreme: A Study on the Power System Resilience. Proc IEEE (2017) 105:1253–66. doi:10.1109/jproc.2017.2679040
11. Guo H, Yu SS, Iu HHC, Fernando T, Zheng C. A Complex Network Theory Analytical Approach to Power System Cascading Failure-From a Cyber-Physical Perspective. Chaos (2019) 29:053111. doi:10.1063/1.5092629
12. Wenli F, Zhigang L, Ping H, Shengwei M. Cascading Failure Model in Power Grids Using the Complex Network Theory. IET Generation, Transm & Distribution (2016) 10:3940–9. doi:10.1049/iet-gtd.2016.0692
13. Cai M, Liu J, Cui Y. Network Robustness Analysis Based on Maximum Flow. Front Phys (2021) 767. doi:10.3389/fphy.2021.792410
14. Zhou D, Hu F, Wang S, Chen J. Power Network Robustness Analysis Based on Electrical Engineering and Complex Network Theory. Physica A: Stat Mech its Appl (2021) 564:125540. doi:10.1016/j.physa.2020.125540
15. Tu H, Xia Y, Iu HH-C, Chen X. Optimal Robustness in Power Grids from a Network Science Perspective. IEEE Trans Circuits Syst (2019) 66:126–30. doi:10.1109/tcsii.2018.2832850
16. Huang Y, Li P, Zhang X, Mu B, Mao X, Li Z. A Power Dispatch Optimization Method to Enhance the Resilience of Renewable Energy Penetrated Power Networks. Front Phys (2021) 9:517. doi:10.3389/fphy.2021.743670
17. Guo H, Zheng C, Iu HH-C, Fernando T. A Critical Review of Cascading Failure Analysis and Modeling of Power System. Renew Sustainable Energ Rev (2017) 80:9–22. doi:10.1016/j.rser.2017.05.206
18. Fu JQ, Guo Q, Yang K, Liu JG. Network Reconstruction in Terms of the Priori Structure Information. Front Phys (2021) 9:452. doi:10.3389/fphy.2021.732835
19. Zhang X, Tu H, Guo J, Ma S, Li Z, Xia Y, et al. Braess Paradox and Double-Loop Optimization Method to Enhance Power Grid Resilience. Reliability Eng. Syst. Safety (2021) 215:107913. doi:10.1016/j.ress.2021.107913
20. Chen C, Zhou X, Li Z, He Z, Li Z, Lin X. Novel Complex Network Model and its Application in Identifying Critical Components of Power Grid. Physica A: Stat Mech Its Appl (2018) 512:316–29. doi:10.1016/j.physa.2018.08.095
21. Wang Y, Xu Y, He J, Liu C-C, Schneider KP, Hong M, et al. Coordinating Multiple Sources for Service Restoration to Enhance Resilience of Distribution Systems. IEEE Trans Smart Grid (2019) 10:5781–93. doi:10.1109/tsg.2019.2891515
22. Zhou D, Hu F, Wang S, Chen J. Robustness Analysis of Power System Dynamic Process and Repair Strategy. Electric Power Syst Res (2021) 194:107046. doi:10.1016/j.epsr.2021.107046
23. Jing K, Du X, Shen L, Tang L. Robustness of Complex Networks: Cascading Failure Mechanism by Considering the Characteristics of Time Delay and Recovery Strategy. Physica A: Stat Mech its Appl (2019) 534:122061. doi:10.1016/j.physa.2019.122061
24. Li J, Shi C, Chen C, Dueñas-Osorio L. A Cascading Failure Model Based on Ac Optimal Power Flow: Case Study. Physica A: Stat Mech its Appl (2018) 508:313–23. doi:10.1016/j.physa.2018.05.081
25. Smed T, Andersson G, Sheble GB, Grigsby LL. A New Approach to Ac/dc Power Flow. IEEE Trans Power Syst (1991) 6:1238–44. doi:10.1109/59.119272
26. Dantzig GB, Thapa MN. Linear Programming 2: Theory and Extensions. Hongkong: Springer Science & Business Media (2006).
27.[Dataset] Christie RD. University of washington Power Systems Test Case Archive (1999). Available at: (????) https://www.ee.washington.edu/research/pstca/.
28. Zimmerman RD, Murillo-Sánchez CE, Gan D. Matpower. PSERC.[Online] (1997). Software Available at: http://www.pserc.cornell.edu/matpower.
Keywords: complex network, network bottlenecks, resilience improvement, optimization, power network
Citation: Tu H, Zhang X, Xia Y, Gu F and Xu S (2022) Bottlenecks Identification and Resilience Improvement of Power Networks in Extreme Events. Front. Phys. 10:941165. doi: 10.3389/fphy.2022.941165
Received: 11 May 2022; Accepted: 21 June 2022;
Published: 08 August 2022.
Edited by:
Hui-Jia Li, Beijing University of Posts and Telecommunications (BUPT), ChinaReviewed by:
Chuang Liu, Hangzhou Normal University, ChinaLin Wang, University of Cambridge, United Kingdom
Copyright © 2022 Tu, Zhang, Xia, Gu and Xu. This is an open-access article distributed under the terms of the Creative Commons Attribution License (CC BY). The use, distribution or reproduction in other forums is permitted, provided the original author(s) and the copyright owner(s) are credited and that the original publication in this journal is cited, in accordance with accepted academic practice. No use, distribution or reproduction is permitted which does not comply with these terms.
*Correspondence: Yongxiang Xia, eGlheXhAaGR1LmVkdS5jbg==
 Haicheng Tu
 Xi Zhang
 Yongxiang Xia
 Fengqiang Gu3
 Sheng Xu