
94% of researchers rate our articles as excellent or good
Learn more about the work of our research integrity team to safeguard the quality of each article we publish.
Find out more
ORIGINAL RESEARCH article
Front. Phys., 06 July 2022
Sec. Optics and Photonics
Volume 10 - 2022 | https://doi.org/10.3389/fphy.2022.931958
This article is part of the Research TopicAdvances in Optical Imaging Techniques for Microscopy and NanotechnologyView all 7 articles
In this study, we present a flat-field Mueller matrix imaging system to reduce the reconstruction error caused by critical illumination. This study demonstrates that the signal-to-noise ratio (SNR) of the reconstructed images is improved by about eight times by adding a beam shaping module made up of microlens arrays to a traditional Mueller system. The scalar diffraction theory and polarization numerical simulation show the ability of the new device in minimizing the adverse effects of light source noise on polarization reconstruction results. Finally, the experiment results on standard resolution board, porous anodic alumina, and real pathological slices further confirm the superiority of the flat-field Mueller system in precisely identifying sample structure and quantitative differences between various polarization parameters (depolarization ratio Δ, linear retardance δ, and birefringence orientation θ), demonstrating the potential of flat-field polarization imaging in pathological diagnosis and tissue characteristic extraction.
Polarization imaging has shown to have the potential as a label-free tool in biomedical research due to its sensitivity to microstructural tissue changes [1–3]. Especially the wide-field Mueller microscopes, upgraded by installing polarization devices on commercial microscopes, have been successfully applied in pathological diagnoses, including liver cancer [4], breast ductal carcinoma [5], and cervical carcinoma [6], and have gradually progressed from qualitative to quantitative recognition.
However, identifying the lesion on pathological sections accurately imposed stringent requirements on the polarization systems. For example, the microstructure features and the extremely thin thickness of pathological slices demand a high contrast of polarimetry, while tissue anisotropy requires the uniformity of polarization imaging. Unfortunately, traditional critical illumination used in Mueller microscopes is likely to generate non-uniform projection accompanied by spatially varying irradiance [7], possibly due to unaligned optics, dust, nonuniform light sources, and vignetting[8]. This not only results in the spatial instability of the signal-to-noise ratio (SNR) in polarization images but also has negative effects on splicing adjacent polarization subgraphs to observe the polarization features of the entire sample, limiting the increase of the field of view (FOV).
Previous works about improving the accuracy of polarization imaging systems focused on estimating the acquisition noise of the camera [9], numerically calibrating the fast axis angle of the waveplate [10], and applying advanced imaging techniques [11]. However, these methods do not address the issue of non-uniform noise distribution caused by the light source, which limits the further improvement of the resolution and the SNR of the Mueller microscope. Although Köhler illumination can provide excellent illumination uniformity, it comes at the expense of illumination intensity and FOV. Therefore, reducing light source noise and maintaining a good SNR and measurement accuracy in a large FOV poses a challenge for the Mueller matrix imaging system.
In this study, we optimize the flat-field Mueller matrix imaging (MMI) with a large FOV by the Köhler integrator [12, 13], which consists of dual microlens arrays (MLAs). A theoretical analysis based on scalar diffraction theory is established to analyze the field propagated from the point sources to the sample plane, revealing that the mechanism of the Köhler integrator is the superposition of the images of MLA1 by the corresponding lenslets in MLA2. Furthermore, we illustrate the importance of flat-field MMI by examining polarization reconstruction errors caused by uneven illumination. Various samples are used to validate the advantages of flat-field polarization imaging. By comparing several important polarization parameters (depolarization, linear retardance, and birefringence orientation), we demonstrate the superiority not only in enhancing the SNR but also in precisely recognizing the structural and quantitative difference of various polarization parameters, which lays the foundation for the future pixel-level polarization digital pathology.
The flat-field Mueller matrix imaging system is based on the traditional wide-field dual-rotated-retarder system. As shown in Figure 1, a new component of the beam shaping module is added. In the system, the illuminating light from an LED source (3 W, 620–640 nm, Xlamp XP-E, Cree) is first focused by a 10× objective (GCO-2131, Daheng Optics, China) and then spatially filtered with a diaphragm to obtain a group of point sources marked as S, with a total extension width h of 1 mm based on the real experimental situation. After being collimated by lens L1 (MAD406-A, LBTEK, China), the beams emitted from the point source located at various positions in S illuminate the beam shaping module from various angles and the maximum incident angle of the array onto the MLA1 αmax ≈ h/2fL1. Before being modulated by a polarization state generator (PSG), the illumination passes through the beam shaping module which consists of two identical spherical microlens arrays (MLAs) (MLA1M, Thorlabs Inc., United States) and an achromatic lens (MAD408-A, LBTEK, China). Specifically, the MLA1 divides the entrance beam into several independently propagating beamlets. The MLA2 is located at one lenslet focal length behind the MLA1 [13, 14], in combination with the Fourier lens L2, and it can superimpose the images of the beamlets in MLA1 onto the back focal plane of L2, which also serves as the sample plane. As a result, a pattern of uniform irradiance is formed and projected onto the sample. After being analyzed by a polarization state analyzer (PSA) part, the scattered light from the sample is imaged by CMOS (MV-CA023-10UM, HIKROBOT, China) with lens L3 (MAD412-A, LBTEK, China). Thirty light intensity images that captured every 6⁰ of rotation of R1 and every 30⁰ of rotation of R2 are acquired to calculate and derive the Mueller matrix elements [15, 16]. A calibration method is used in this study with air as a reference sample, and the maximum errors in flat-field and wide-field are both less than 0.015 [10].
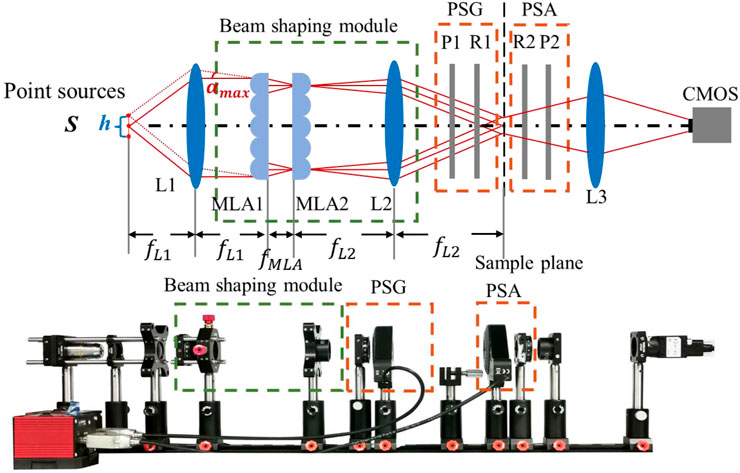
FIGURE 1. Principle and schematic of the flat-field Mueller matrix imaging system, which contains point sources, beam shaping module, polarization state generator (PSG), polarization state analyzer (PSA), and CMOS. S, point sources; L, lens; P, polarizer; R, quarter-wave plate; MLA, microlens array.
The focal lengths of MLA and of the lenses L1, L2, and L3, denoted as fMLA, fL1, fL2, and fL3 are 4.7, 50, 100, and 75 mm, respectively, and the distances between the optical devices are marked in Figure 1. The distances between the sample plane and L3, L3 and the CMOS are determined by the Gaussian imaging formula, which is slightly adjusted according to the thickness of the sample.
Mueller matrix elements contain all polarization information of the experimental sample, but they cannot be directly mapped to the specific microstructure of the sample. The Mueller matrix polar decomposition (MMPD) is proposed by Lu and Chipman [17] to decompose the interaction between polarization light and samples into a product of diattenuation (D), retardation (R), and depolarization (Δ) matrices. Furthermore, two important parameters: linear retardance (δ) and birefringence orientation (θ) are extended from the retardation [18], as stated in Eqs 1–3, where a2 and a3 are the elements of the retardation vector. In this study, Δ, δ, and θ are selected as the indicators to evaluate the enhancement of uniform illumination for the MMI system.
The model is established according to the scalar diffraction theory [19], as shown in Figure 2A, with a coordinate system located at the center of the S. For sake of simplicity and intuitive analysis, the analysis is based on the y-direction. In general, the propagation of the light from the beam shaping module to the sample plane can be divided into two steps: the first is to propagate the transmitted field U(y1, zA1+) behind the MLA1 to the plane in front of the second array U(y2, zA2-), and the second step is to propagate the beams from the transmitted field behind the MLA2 U(y2, zA2+) to the sample plane U(y, zF).
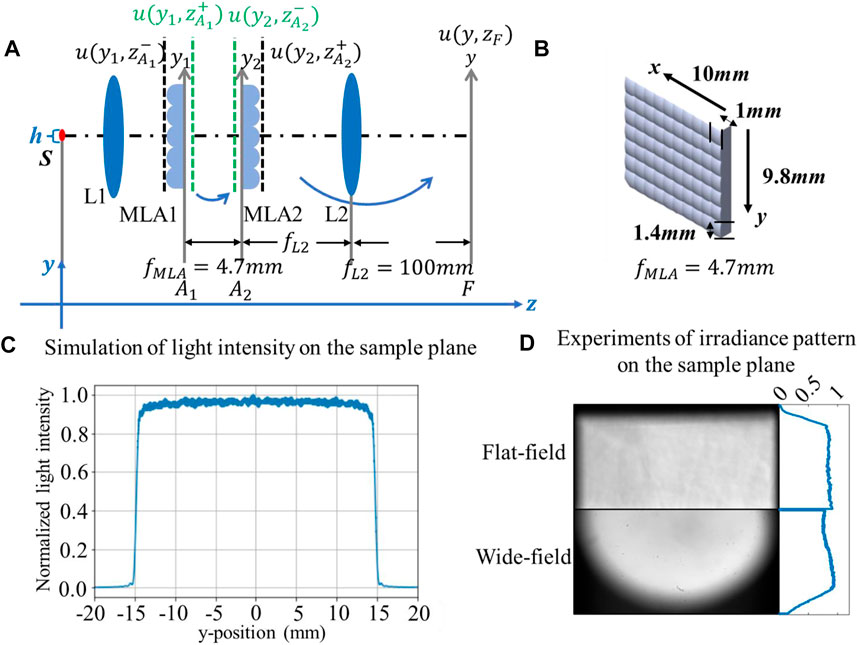
FIGURE 2. (A) Model of the beam shaping module; (B) physical size of the MLAs; (C) simulation result of light intensity on the sample plane; (D) comparison of the irradiance distribution on the sample plane between flat-field and wide-field in the experiment.
Specifically, the collimating lens L1 converts the light emitted by the LED from spherical waves to plane waves; however, due to the physical size of the point sources, the field in front of the MLA1 is expressed as a superposition of illumination from different incident angles, which are emitted from different positions in point sources, as presented in Eq. 4, where a (α; y’) represents the spatial weighting coefficient closely related to the incident angles.
Eq. 5 describes the transmission function of MLA and the single lenslet in MLA as TMLA and TL, respectively, with dL denoting the physical size of the single lenslet and (2N + 1) representing the number of lenslets. By applying the Fresnel approximation of the Fresnel–Kirchhoff diffraction integral, the field in front of the MLA2 is presented as Eq. 6. The opposite signs in the exponent show that MLA2 eliminates the parabolic phase curvature introduced by MLA1. Therefore, MLA2 smooths the inhomogeneous illumination distribution by converting the spherical waves to plane waves. Then, the field and light intensity on the sample plane can be calculated by Fourier transforming the field behind the MLA2, as shown in Eqs 7–8. When compared to traditional wide-field imaging, the double microlens array averages out the variance in the original illumination beam by first splitting and then overlapping, contributing to a uniform irradiance on the sample plane.
Figure 2B shows the size parameters of the MLAs used in the experiment. The total width of the array in the x and y directions is 10 and 9.8 mm, respectively, with 10 and seven lenslets in each direction, and the focal length of every single lenslet is 4.7 mm. Figure 2C shows the simulation result of irradiance variation on the sample plane, and the parameters used in the simulation are all based on the experiment. Figure 2D presents the irradiance patterns on the sample plane by flat-field and wide-field systems in the experiment, and a more quantitative description of the light intensity variation in the cross section is also shown in the subgraphs, proving the advantages of incorporating the beam shaping module into wide-field imaging.
To emphasize the necessity of uniform illumination for polarimetry, we analyze the error transfer of the reconstruction process and evaluate the polarization image results with a relative illumination perturbation of 3%. Numerical simulations confirm the ability of flat-field illumination to suppress background noise in polarized images.
In the dual-rotated MMI, as shown in Eqs 9–11, the Mueller matrix of the sample is coupled to the light intensity and can be demodulated by performing Fourier expansion on the thirty sets of light intensity signals, which is generated by two synchronously rotating waveplates [15]. Since the rotation angle β of the waveplate (in PSG) is an experimentally known parameter, Eq. 9 is typically written as the linear equation Eq. 10 to calculate the coefficient (an and bn) of the Fourier series, where I, T, and A represent a 30 × 1 light intensity matrix, a 30 × 25 angle matrix, and a 25 × 1 Fourier coefficient matrix, respectively. As shown in Eq. 11, the final Mueller matrix is the linear combination of Fourier coefficients an and bn, and matrix C can be found in the ninth equation of Ref. [10]. Therefore, thirty light intensity images modulated by the polarizing and analyzing module can be transformed into the Mueller matrix Mv by the reconstruction matrix W, where W = CT−1. We present a more intuitive illustration of the Mueller matrix calculation process in Figure 3, and the variation of intensity images is taken care of by the function g(β). The function g(β) describes the variation of thirty light intensities at a pixel collected with the rotation of the waveplate in PSG during the measurement, where β represents the rotation angle of the waveplate in PSG, which ranges from 0°to 180°with the interval at 6°. Figure 3 shows the function g(β) of the air sample as an example.
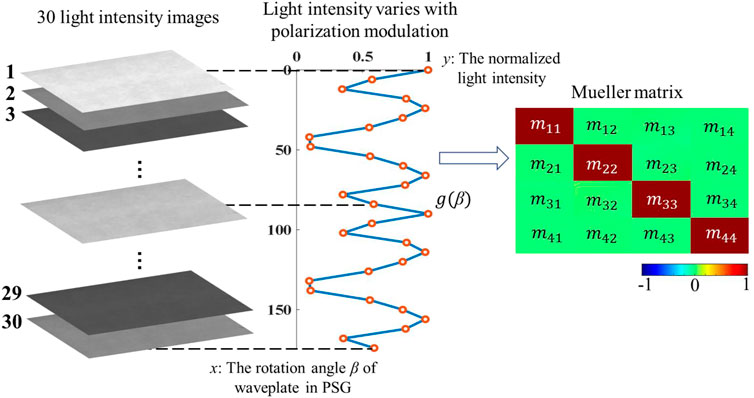
FIGURE 3. Schematic diagram of the periodically varying light intensity modulated by the polarizing device.
The measured Mueller matrix contains two types of errors: systematic error (∆) and random error (δ). The systematic error is inherent in the experiment, but it can be compensated or eliminated through instrument calibration, optimization of experimental procedures, and so on. Random error is a type of statistical error that affects the accuracy of the experiment result, such as unstable rotation of the waveplate and random noise of the light source or COMS. The footnote t indicates the theoretical value, such as Mt, Wt, and It, while the lowercase e indicates the experimental value: Me, We, and Ie. Then, by demodulating light intensity signals, the experimental value of each Mueller matrix located at position (x,y) consists of three components: theoretical value (t), systematic error (∆), and random error (δ), as shown in Eq. 12. Since matrix I includes thirty light intensities, the random noise attached to each intensity picture follows the variation pattern of function g(β).
After neglecting the higher-order terms, the deviation between theoretical and experimental values is as Eq. 13:
Previous studies concentrated on the calibration of the reconstruction matrixes ∆W and δW but less on the effect of the light source (∆I + δI). However, we notice in Eq. 12 that the deviation of the incident light is transmitted unreservedly to the measured Mueller matrix and the MMPD result. To further quantitatively explore the influence on the polarimetry and effectiveness of the improvement on flat-fielding, three cases are simulated with air as a standard sample, and the corresponding Mueller matrix is a unitary matrix with no depolarization and linear retardance under the ideal situation.
• Case 1: ∆I ≠ 0, δI = 0;
A radially distributed non-uniform irradiance but without random noise is presented in Figures 4A,D,G,J as an example, and ∆I refers to the inhomogeneous spatial distribution of the light intensity, which is inherent in the system; however, the calculated polarization parameters are not affected.
• Case 2: ∆I ≠ 0, δI ≠ 0;
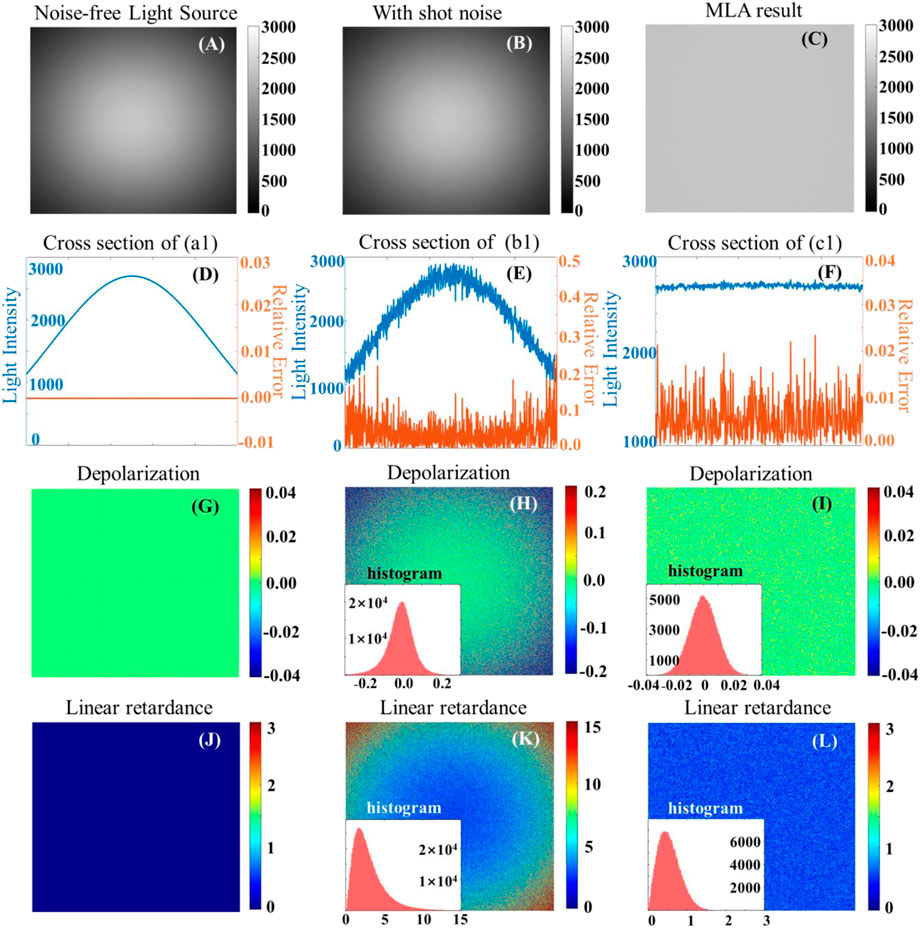
FIGURE 4. (A), (B), and (C): three typical cases for the first light intensity image; (D), (E), and (F): the cross-section of light intensity (blue curve) and relative error (orange curve) corresponding to (G) -(I) and (J) -(L) are the calculated depolarization and linear retardance results for the three typical cases, respectively.
According to the variation of the g(β), shot noise is added to all thirty images, as shown in Figures 4B,E,H,K, and the mean value of shot noise for each image is 3% of the maximum value of the corresponding image. Figures 4H, K illustrate that given the uneven distribution of the light intensity, the higher the light intensity, the lower the relative noise and the less accurate in the estimated polarization parameters. Furthermore, the error distribution of polarization parameters exhibits a similar radial pattern as the light intensity image (Figure 4B). This means that the polarization error is proportional to the relative noise level of the light intensity rather than the absolute magnitude of the light intensity distribution itself.
• Case 3: min {∆I + δI};
Figures 4C, F, I, L show the simulation results optimized by the dual MLA module, and Figure 4C is calculated by the method described in Section 2.2. The shot noise satisfies the Poisson distribution statistically and the SNR is defined as the square root of the number of photons received per pixel. As a result, the SNR of light intensity image (Figure 4C) is improved by about
We take the inhomogeneous illumination with two-dimensional Gaussian distribution and shot noise as an example. The comparison of cases 1 and 2 demonstrates that the uneven spatial distribution of light intensity alone does not corrupt the polarization images, indicating that the measurement of the Mueller matrix is independent of the light intensity; however, the results of case 2 show that the key factor affecting the background noise is the spatially varying SNR brought by δI/I. It is the relative noise that corrupts the polarization accuracy.
To further illustrate the effect of inhomogeneous illumination on real sample imaging from the simulation, we construct three domains with gradients in depolarization and linear retardance in Figure 5, where the polarization properties within each domain are consistent [20]. Figures 5A–C and Figures 5D–I show the images of light intensity and polarization parameters for three domains under three cases corresponding to Figure 4, respectively. It is found that the simulation results under uniform illumination are closer to the theoretical values for both region 1 with weak polarization effects and region 3 with significant polarization effects.
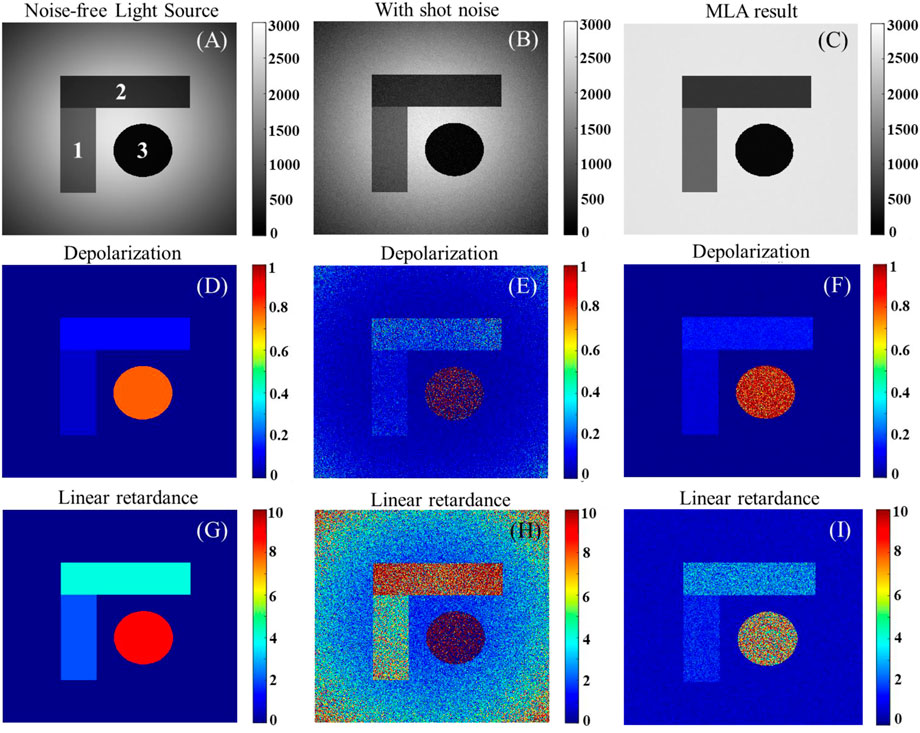
FIGURE 5. (A), (B), and (C): three typical cases for the first light intensity image for three domains; (D) -(F) and (G) -(I) are the corresponding calculated depolarization and linear retardance for three domains under three typical cases, respectively.
In this part of the simulation, Figure 4 shows that uniform illumination improves the SNR by suppressing the background noise of the polarization parameters, while Figure 5 further demonstrates the effect of SNR enhancement on real sample imaging, with the results under flat-field illumination being closer to the theoretical value of the sample, emphasizing the necessity of uniform illumination to the polarimetry.
Polarization images are reconstructed from 30 light intensity images containing polarization information; however, the response of the polarization signal to the incident is nonlinear, making it difficult to compensate for the effects of inhomogeneous illumination by post-processing [8]. If Iincident (x,y) is assumed to represent the light intensity projected onto the sample at position (x,y), Ipolarization (x,y) represents the ideal value of light intensity passing through the PSA after scattering from the sample as in Eq. 14.
Figure 6B describes the variation of 30 light intensity maps of a sample with block structures, and the variation for the air is due to the polarization state modulation of PSG and PSA, representing the effect of polarization state change on light intensity, which is presented as reference values, and there is a significant difference between zones 1 and 2 due to their different polarization structures (the sample is described specifically in Section 4.2, where the birefringence orientation of the two regions is different). However, comparing these three curves, the Ipolarization (x,y) of samples does not only change linearly with the reference values as the polarization states change but is also influenced by the sample structures, illustrating that f (x,y) in Eq. 14 is a nonlinear function involving multiple factors, making it difficult to be modified through post-processing.
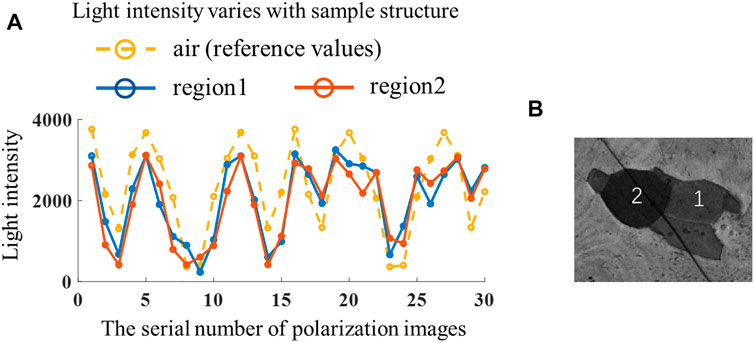
FIGURE 6. (A) Comparisons of light intensity changes with different sample structures; (B) different imaging areas of the sample.
The simulation results in Section 3 demonstrate the advantages of flat-field MMI in suppressing the background noise of the polarimetry. To further illustrate the improvements in highlighting the microstructures of samples due to the reduction of noise, three different samples are chosen to compare the capability of two illumination modes. Since the flat-field imaging system is upgraded by adding a beam shaping module on the wide-field system, the following demonstration is based on imaging the same region with and without beam shaping components. Polarization parameters Δ, δ, and θ, which represent the depolarization, linear retardance, and birefringence orientation, respectively, are investigated, and all of these parameters have been proven as important indicators in biomedical studies [21].
To begin, a 1951 USAF resolution board with a perfect binary distribution comprising the transparent and shaded parts is chosen as a reference example. Figures 7A,B compare the normalized light intensity and depolarization picture for the resolution bars from group 5, element 1 to group 5, and element 5, where the selected region is close to the resolution limit in both systems and corresponds to the line width ranging from 15.6 to 9.84 μm. Intuitively, the flat-field illumination improves the imaging clarity, particularly at the edge of various areas in the image. The probability density function (PDF) of the pixel distribution characteristics of the dashed rectangles in Figures 7A–D is shown in Figures 7E, G, where the flat-field system exhibits an evident double-peak feature, clearly showing binary properties. Further image resolution analysis utilizing group 5, element 4 is displayed in subpictures in Figures 7F, H. The peaks in Figure 7F indicate a strong light transmission area, while those in Figure 7H indicate a more severe depolarization impact caused by the shaded area. The transmission and shading parts cannot be correctly distinguished from the depolarization picture under traditional critical lighting, but they can be easily separated under flat-field illumination. From Figures 7F, H, the image resolution problem caused by the illumination mode appears to have little effect on non-polarized intensity images but will clearly affect the resolution of polarization images, implying the importance of uniform illumination for biomedical applications of polarized optics.
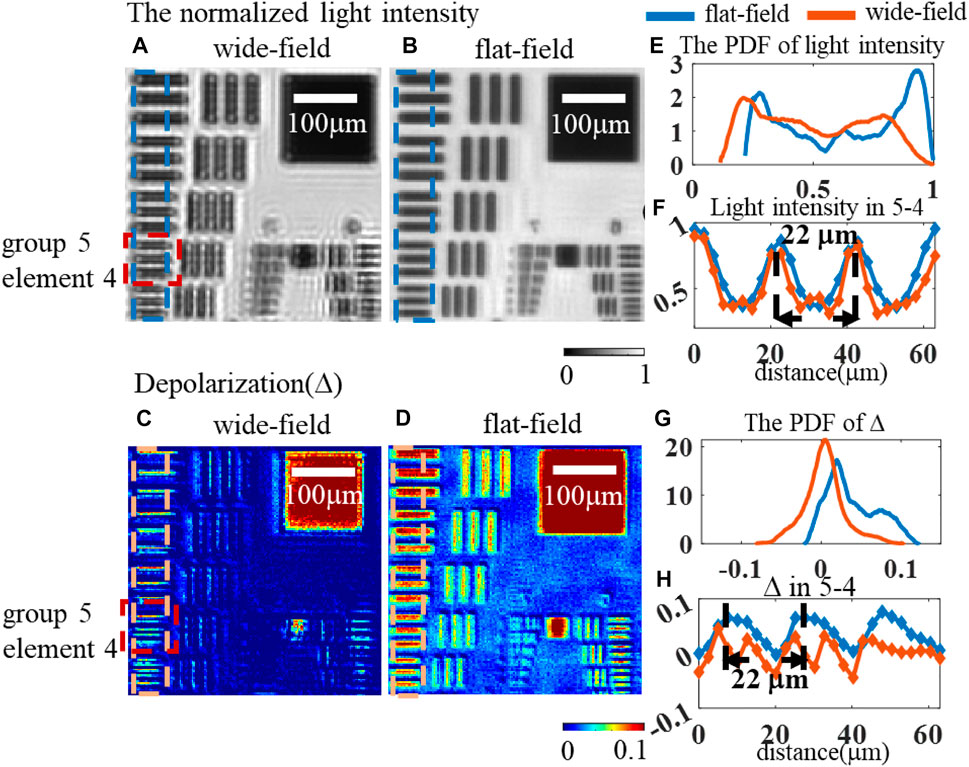
FIGURE 7. Comparison of the resolution board between two systems: (A) normalized light intensity for the wide-field; (B) normalized light intensity for the flat-field; (C) Δ of wide-field; (D) the Δ of flat-field; (E) distribution of the normalized light intensity in two systems; (F) variation of light intensity with distance; (G) distribution of Δ in two systems; (H) variation of Δ with distance.
Except for the depolarization parameter closely related to tissue scattering, the linear retardance δ and the birefringence orientation θ are also important parameters to explore anisotropic tissue microstructures and then reveal the initial pathological features of many diseases, such as fiber proliferation. We utilize porous anodic alumina (PAA) as the experimental material to investigate the effect of flat-field illumination on these two anisotropic characteristics. PAA is a photonic crystal with porous structure, and it displays an obvious optical anisotropy produced by birefringence. Based on our earlier research, several domains with different optical axis orientations will form on the surface of PAA depending on the preparation process [22]. We compare the δ, θ images under two lighting modes in Figures 8A,B and Figures 8D,E, both showing similar δ values and apparent differences for θ values across adjacent domains. For a more quantitative comparison, we present the PDF of three regions in Figures 8C, F. Since the δ values from the three regions are very similar, only region 1 is chosen as the representative in Figure 8C, while Figure 8F shows all of the PDFs of θ from three regions under two different illumination modes. The consistent peaks of the PDF distribution under two illumination modes appear to have little effect on the rough extraction of anisotropic characteristics. However, considering highly consistent microstructures within each domain on a PAA plate, the narrower FWHM (listed in Table 1) by the flat-field system may imply that the improvement of illumination uniformity can effectively improve the accuracy and contrast of sample anisotropy analysis.
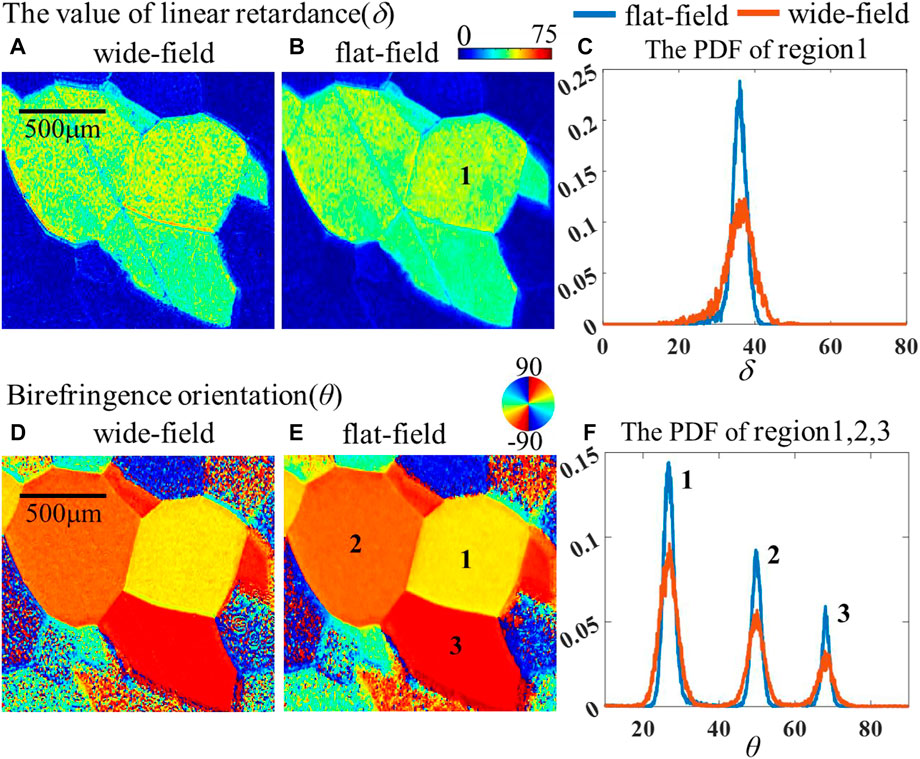
FIGURE 8. Comparison of PAA in two systems: (A) δ for the wide-field; (B) δ for the flat-field; (C) distribution of the δ in two systems; (D) θ for the wide-field; (E) θ of flat-field; (F) distribution of θ in two systems.
To further investigate why the FWHM of polarization parameters is obviously narrower under the flat-field mode while the mean values remain constant, we used a 200-μm myocardial tissue sample. As shown in Figure 9A, the empty regions without the sample in the myocardial section cannot generate any phase retardance theoretically. However, compared with the δ image under the flat-field lighting in Figure 9D, the δ values from the empty regions are not exactly zero under the wide-field mode in Figure 9C. This inaccuracy might explain the difference in the δ value distribution of myocardial tissue at the same place under two different illumination modes seen in Figure 9B. Also, Figure 9D further confirms the importance of illumination uniformity on polarization parameter extraction.
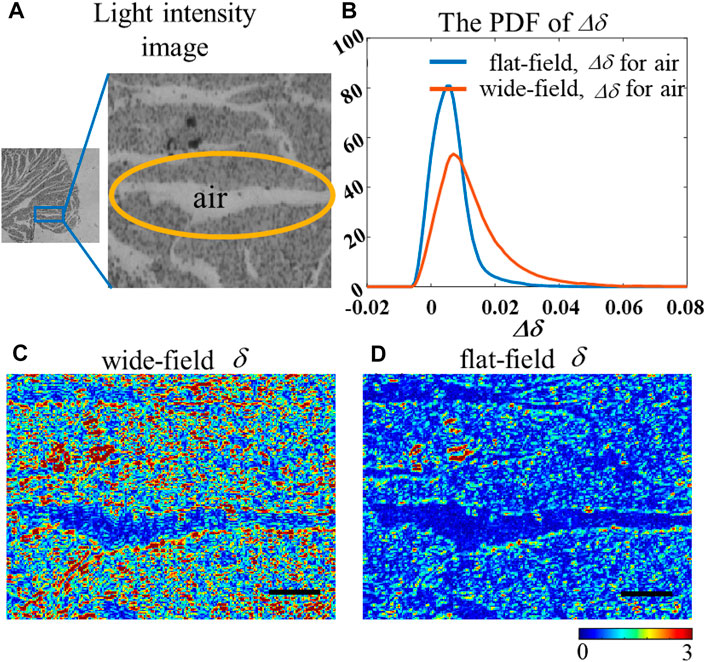
FIGURE 9. (A) Light intensity image of the sample, the circled area is the gap between the samples; (B) PDF of the linear retardance deviation calculated in the gap; (C–D) 2D images of the δ under wide-field and flat-field, respectively. The black scale bar is 100 μm.
The aforementioned studies indicate that the flat-field system has advantages in suppressing background noise, which improves the SNR of polarization images and the extraction accuracy of polarization parameters. As a result, a flat-field polarization imaging system will be more suitable for the division of lesions and healthy areas on pathological samples.
Next, we prepare two 4-μm pathologic tissue slices of human liver cirrhosis at stage IV with typical fibrous microstructures, whose stained microscopic images are shown in Figure 10A,B. We select two regions in each slice to compare their δ values under two illumination modes in Figures 10C, D, F, G, respectively. According to the HE stained results, the red rectangular areas represent the fibroproliferative part, while the yellow ones represent the non-fibrous tissues. Similar to Figures 7, 8; Figure 10E, H shows that the ranges of each area are more concentrated regardless of tissue types, whose FWHM can be found in Table 2. To further quantitatively compare the discrimination of different degrees of liver fibrosis under two illumination modes, Jensen–Shannon divergence (JSD) is chosen as an indicator. JSD is based on information entropy and describes the difference between two distributions; the larger JSD means the greater difference between the two distributions [23], as presented in Eqs 15-16, where p(x) and q(x) represent two distribution functions. Here, we introduce a parameter Cim as defined in Eq. 17, to describe the contrast improvement due to the optimized flat-field illumination mode:
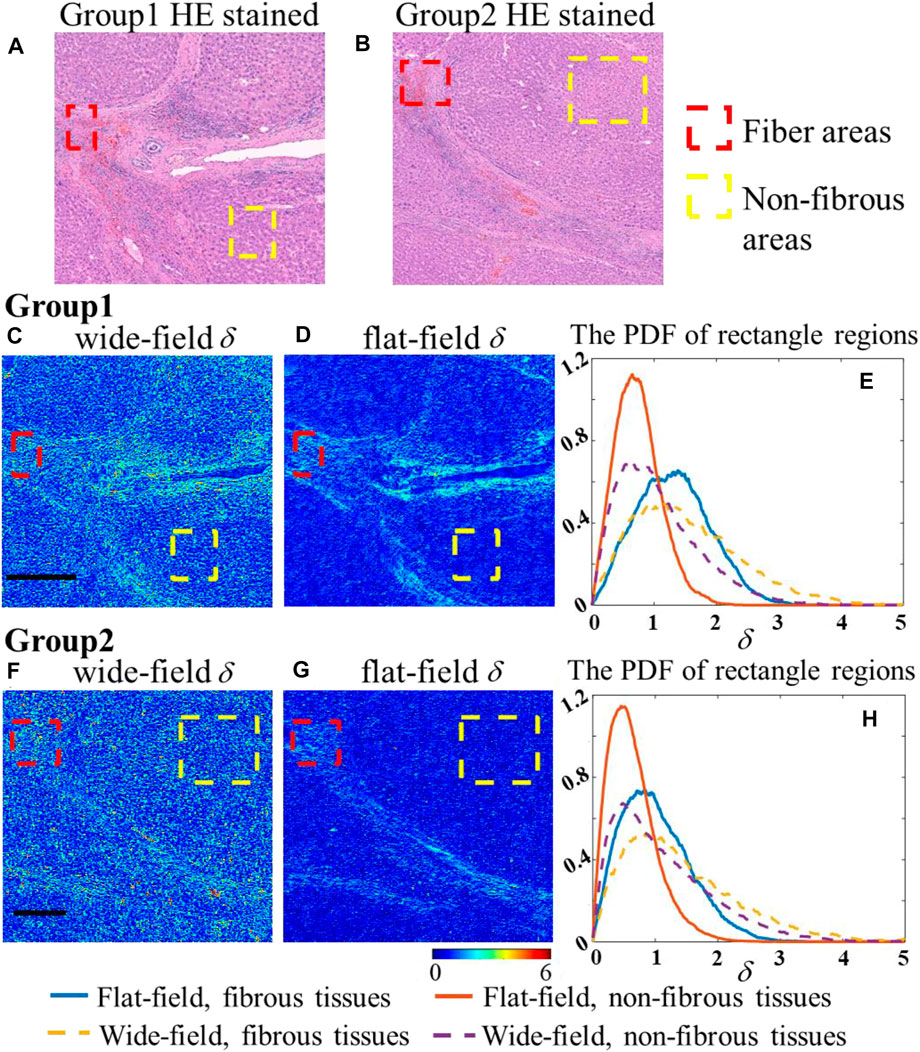
FIGURE 10. (A-B) Chosen regions of liver cirrhosis in HE stained slices; (C-D) comparison of δ of group 1 in two systems, respectively; (E) PDF of δ with fibers and non-fibrous tissues in group 1, respectively; (F-G) comparison of δ of group 2 in two systems, respectively; (H) PDF of δ with fibers and non-fibrous tissues in group 2, respectively; the black scale bar is 500 μm.
Table 2 shows that the increasing SNR from flat-field illumination highlights the differences between different structures, as reflected in the value of Cim increased by 2.5 times and three times in two slices, making it easier to distinguish between healthy and abnormal areas in pathology.
The aforementioned experiments have demonstrated the benefits of single-wavelength MMI in quantitatively identifying different microstructures. Considering that the Köhler integrator is insensitive to the wavelengths [13, 24], a single-wavelength MMI can be easily upgraded to a multiwavelength MMI in the future for more application scenarios.
In this study, we propose a method to improve the illumination uniformity of the MMI, where two MLAs and a Fourier lens are used to overlap the images of multi-lenslets in the array to implement a uniform irradiance. Theoretically, we establish the light propagation model of the beam shaping module and analyze the error transfer in polarization parameters induced by spatially varying noise of the incident light, emphasizing the importance of flat-field illumination on noise suppression and polarization signal generation.
Experimentally, combined with the resolution board, we first highlight the significance of uniform illumination applied to polarimetry in biomedical research. The improvement of microstructural identification by flat-field illumination is particularly evident in polarized images when compared with light intensity images.
The experiments of various samples further confirm the advantages of a flat-field system in the extraction of typical polarization characterization parameters, including depolarization Δ, phase retardance δ, and birefringence orientation θ. Specifically, the flat-field system can preserve the sharp variations between different depolarization regions, which is beneficial to the recognition of scattering characteristics of samples. The SNR of polarization images on tissue anisotropy parameters δ and θ is also enhanced, showing advantages in identifying lesion areas with varying optical anisotropy. By comparing polarization images of two liver cirrhosis tissue slices under two illumination modes, the advantage of flat-field polarization imaging in discriminating the degree of tissue fibrosis has been demonstrated. In the follow-up study, the flat-field Mueller matrix imaging also showed the potential to acquire the full polarization imaging of a whole pathological slice by stitching the adjacent region.
The raw data supporting the conclusions of this article will be made available by the authors, without undue reservation.
NZ, WG, and JS conceived the idea of the manuscript. WG and JS prepare the samples and performed the experiments. WG and JS wrote the original manuscript and analyzed the results. NZ and HM performed the language editing. All authors have given approval to the final version of the manuscript.
This work is supported by the National Key Program of Science and Technology Supporting Economy of China (2020YFF01014500ZL) and the Science and Technology Research Program of Shenzhen Grant (JCYJ20200109142820687).
The authors declare that the research was conducted in the absence of any commercial or financial relationships that could be construed as a potential conflict of interest.
All claims expressed in this article are solely those of the authors and do not necessarily represent those of their affiliated organizations, or those of the publisher, the editors, and the reviewers. Any product that may be evaluated in this article, or claim that may be made by its manufacturer, is not guaranteed or endorsed by the publisher.
1. He H, Liao R, Zeng N, Li P, Chen Z, Liu X, et al. Mueller Matrix Polarimetry-An Emerging New Tool for Characterizing the Microstructural Feature of Complex Biological Specimen. J Lightwave Technol (2019) 37(11):2534–48. doi:10.1109/jlt.2018.2868845
2. He C, He H, Chang J, Chen B, Ma H, Booth MJ. Polarisation Optics for Biomedical and Clinical Applications: A Review. Light Sci Appl (2021) 10(1):194. doi:10.1038/s41377-021-00639-x
3. He C, Chang J, Salter PS, Shen Y, Dai B, Li P, et al. Revealing Complex Optical Phenomena through Vectorial Metrics. Adv Photon (2022) 4(02):026001. doi:10.1117/1.Ap.4.2.026001
4. Wang Y, He H, Chang J, Zeng N, Liu S, Li M, et al. Differentiating Characteristic Microstructural Features of Cancerous Tissues Using Mueller Matrix Microscope. Micron (2015) 79:8–15. doi:10.1016/j.micron.2015.07.014
5. Dong Y, Wan J, Si L, Meng Y, Dong Y, Liu S, et al. Deriving Polarimetry Feature Parameters to Characterize Microstructural Features in Histological Sections of Breast Tissues. IEEE Trans Biomed Eng (2021) 68(3):881–92. doi:10.1109/TBME.2020.3019755
6. Dong Y, Wan J, Wang X, Xue J-H, Zou J, He H, et al. A Polarization-Imaging-Based Machine Learning Framework for Quantitative Pathological Diagnosis of Cervical Precancerous Lesions. IEEE Trans Med Imaging (2021) 40(12):3728–38. doi:10.1109/TMI.2021.3097200
7. Florijn RJ, Bonnet J, Vrolijk H, Raap AK, Tanke HJ. Effect of Chromatic Errors in Microscopy on the Visualization of Multi-Color Fluorescence In Situ Hybridization. Cytometry (1996) 23(1):8–14. doi:10.1002/(sici)1097-0320(19960101)23:1<8::Aid-cyto2>3.0.Co;2-i
8. Smith K, Li Y, Piccinini F, Csucs G, Balazs C, Bevilacqua A, et al. Cidre: An Illumination-Correction Method for Optical Microscopy. Nat Methods (2015) 12(5):404–6. doi:10.1038/nmeth.3323
9. Hu H, Ossikovski R, Goudail F. Performance of Maximum Likelihood Estimation of Mueller Matrices Taking into Account Physical Realizability and Gaussian or Poisson Noise Statistics. Opt Express (2013) 21(4):5117–29. doi:10.1364/OE.21.005117
10. Goldstein DH. Mueller Matrix Dual-Rotating Retarder Polarimeter. Appl Opt (1992) 31:6676–83. doi:10.1364/AO.31.006676
11. Angelo JP, Germer TA, Litorja M. Structured Illumination Mueller Matrix Imaging. Biomed Opt Express (2019) 10(6):2861–8. doi:10.1364/BOE.10.002861
12. Winston R, Schreiber P, Koshel RJ, Kudaev S, Dannberg P, Zeitner UD. Homogeneous Led-Illumination Using Microlens Arrays. Nonimaging Opt Efficient Illumination Syst (2005) 5942:59420K. doi:10.1117/12.618747
13. Duparré A, Voelkel R, Geyl R, Weible KJ. Laser Beam Homogenizing: Limitations and Constraints. Opt Fabrication, Test MetrologyIII. (2008) 7102:71020J. doi:10.1117/12.799400
14. Douglass KM, Sieben C, Archetti A, Lambert A, Manley S. Super-resolution Imaging of Multiple Cells by Optimized Flat-Field Epi-Illumination. Nat Photon (2016) 10(11):705–8. doi:10.1038/nphoton.2016.200
15. Azzam RMA. Photopolarimetric Measurement of the Mueller Matrix by Fourier Analysis of a Single Detected Signal. Opt Lett (1978) 2(6):148. doi:10.1364/ol.2.000148
16. Chenault DB, Pezzaniti JL, Chipman RA. Mueller Matrix Algorithms. Proc SPIE - Int Soc Opt Eng USA (1992) 1746:231–46. doi:10.1117/12.138793
17. Lu S-Y, Chipman RA. Interpretation of Mueller Matrices Based on Polar Decomposition. J Opt Soc Am A (1996) 13(5):1106–13. doi:10.1364/josaa.13.001106
18. Ghosh N, Wood MFG, Vitkin IA. Mueller Matrix Decomposition for Extraction of Individual Polarization Parameters from Complex Turbid Media Exhibiting Multiple Scattering, Optical Activity, and Linear Birefringence. J Biomed Opt (2008) 13(4):044036. doi:10.1117/1.2960934
20. Karnoukian M, Faisan S, Heinrich C, Lallement A, Zallat J. Segmentation of Mueller Matrix Images under Non-uniform Illumination. Opt Express (2015) 23(14):18218–35. doi:10.1364/OE.23.018218
21. Qi J, Elson DS. Mueller Polarimetric Imaging for Surgical and Diagnostic Applications: a Review. J Biophotonics (2017) 10(8):950–82. doi:10.1002/jbio.201600152
22. Wang C, Qin P, Lv D, Wan J, Sun S, Ma H. Characterization of Anisotropy of the Porous Anodic Alumina by the Mueller Matrix Imaging Method. Opt Express (2020) 28(5):6740–54. doi:10.1364/OE.380070
23. Lin J. Divergence Measures Based on the Shannon Entropy. IEEE Trans Inform Theor (1991) 37(1):145–51. doi:10.1109/18.61115
Keywords: Mueller matrix imaging, uniform illumination, microlens array, polarization, signal-to-noise ratio
Citation: Guo W, Song J, Zeng N and Ma H (2022) Mueller Matrix Imaging Optimized by Uniform Illumination. Front. Phys. 10:931958. doi: 10.3389/fphy.2022.931958
Received: 29 April 2022; Accepted: 30 May 2022;
Published: 06 July 2022.
Edited by:
Le Liu, Tsinghua University, ChinaReviewed by:
Chengliang Zhao, Soochow University, ChinaCopyright © 2022 Guo, Song, Zeng and Ma. This is an open-access article distributed under the terms of the Creative Commons Attribution License (CC BY). The use, distribution or reproduction in other forums is permitted, provided the original author(s) and the copyright owner(s) are credited and that the original publication in this journal is cited, in accordance with accepted academic practice. No use, distribution or reproduction is permitted which does not comply with these terms.
*Correspondence: Nan Zeng, emVuZ25hbkBzei50c2luZ2h1YS5lZHUuY24=
†These authors have contributed equally to this research
Disclaimer: All claims expressed in this article are solely those of the authors and do not necessarily represent those of their affiliated organizations, or those of the publisher, the editors and the reviewers. Any product that may be evaluated in this article or claim that may be made by its manufacturer is not guaranteed or endorsed by the publisher.
Research integrity at Frontiers

Learn more about the work of our research integrity team to safeguard the quality of each article we publish.