- 1Laboratory of Intelligent Perception and Smart Operation and Maintenance, School of Information Science and Technology, Southwest Jiaotong University, Chengdu, China
- 2Center for Information Photonics and Communications, School of Information Science and Technology, Southwest Jiaotong University, Chengdu, China
Non-local effect is an important issue for a pulse-coded Brillouin optical time domain analyzer. Segmental frequency modulated probe, with a dedicated frequency step of half the natural Brillouin linewidth of the sensing fiber, is proposed to solve this issue. It can provide a wideband Brillouin gain as well as loss in the frequency band of the pump to alleviate pump distortions and thus non-local effects. This method can narrow the bit interval towards a level limited by the time of the Brillouin gain transition due to frequency switching, resulting in a bit interval as short as 900 ns for a 225 MHz frequency scanning range. A hot spot at the far fiber end is successfully detected even the probe power reaches −3 dBm under a cumulated Brillouin gain of 267.4%.
Introduction
Brillouin optical time domain analyzer (BOTDA) is widely employed for distributed temperature and strain monitoring, exhibiting distinct advantages in sensing distance, sensing accuracy, and spatial resolution [1]. It has found many practical applications in the ocean monitoring, such as leakage detection of off-shore pipelines [2]. For a BOTDA, two light waves, called pump and probe, counter-propagate along the sensing fiber. The interference between them generates the acoustic wave, which serves as a medium for energy transfer between the pump and probe. This process is called the well-known stimulated Brillouin scattering (SBS) [3]. The amount of the transferred energy from the pump to the probe depends on their frequency difference. This dependence is characterized by the Brillouin gain spectrum (BGS), whose central frequency, i.e., Brillouin frequency shift (BFS), is linearly related to the temperature and strain applied to the sensing fiber [4–6]. Hence, the desired temperature and strain information can be obtained by retrieving the BFS. In addition to the energy transfer from the pump to the probe, the probe also gives energy to the pump. The spectrum of the pump would be distorted when the sum of the Brillouin gain and loss provided by the probe to the pump does not equal zero [7, 8]. Pump distortion leads to the so-called non-local effect, which is an important issue for BOTDAs [7–13].
The non-local effect in single-pulse BOTDAs can be effectively alleviated by several methods, such as scanning the pump frequency [8], using the Brillouin phase-gain ratio [9], and using the linear frequency modulated (LFM) dual-sideband probe [10–13]. Among them, the LFM probe method can reach a record peak power of 12 dBm by providing a wideband Brillouin gain through the high-frequency sideband as well as loss through the low-frequency sideband, i.e., the total energy transfer to the pump can be zero [12]. Recently, it was found that this powerful method can also be effective in non-local effect reduction for a pulse-coded BOTDA, enabling a 11.7 μs bit interval for a 250 MHz frequency scanning range [13]. Note that, the much higher Brillouin gain in a pulse-coded BOTDA considerably increase the difficulties in non-local effect mitigation compared to a single-pulse BOTDA [13, 14].
In this work, we design a new type of probe for non-local effect reduction in pulse-coded BOTDAs, which is called segmental frequency modulated (SFM) probe. This method is inspired by the rectangular SBS filter [15, 16], which uses a segmental frequency pump with a step of half the natural Brillouin linewidth to generate a wideband and rectangular Brillouin gain response for filtering. Similarly, the frequency of the SFM probe also changes segmentally with a step of half the natural Brillouin linewidth. As a result, it can alleviate non-local effect in a similar way to the LFM probe. Numerical simulations are performed to analyze temporal and spatial evolutions of the acoustic and probe waves. A Golay-coded BOTDA using the SFM probe with a code length of 512 bits and a sensing distance of 117.46 km is experimentally implemented. Non-local effect does not occur even the power of the SFM probe is as high as −3 dBm under a cumulated peak Brillouin gain of 267.4%. As a result, the figure-of-merit (FoM) of the sensor can be >800′000. To the best of our knowledge, this is the highest FoM achieved for a repeaterless standard BOTDA until now. At last, we discuss the advantages of the SFM probe method over the LFM probe method. The simulation and experimental results show that the SFM probe method can realize much purer single-frequency Brillouin gain measurement, and thus reduce the BFS measurement error.
Operation Principle and Simulation Results
The operation principle of the proposed SFM probe method is shown in Figure 1. The SFM probe is composed of N frequencies in the lower-frequency sideband (i.e., f1, f2,…, fN) and higher-frequency sideband (i.e., 2fP−f1, 2fP−f2,…, 2fP−fN, where fP is the frequency of the pump), respectively. The frequency step is fixed at ΔνB/2, where ΔνB is the natural Brillouin linewidth of the sensing fiber. The upper and lower sidebands offer a wideband Brillouin gain and loss to the pump, respectively [15, 16]. As a result, the pump spectrum would be irrelative to the probe since the sum of the wideband Brillouin gain and loss equals zero. Thus, the non-local effect will not occur. TE denotes the duration of each frequency and TP = NTE denotes the period of the SFM probe. In order to ensure the same Brillouin response for each bit ‘1’, TP should be equal to the bit interval (say Tbit) [13].
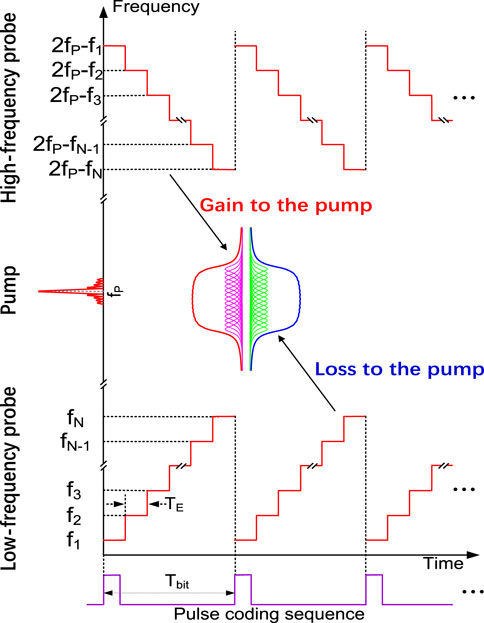
FIGURE 1. Operation principle of the proposed SFM probe method. fP is the frequency of the pump, {f1, f2,…, fN} and {2fP−f1, 2fP−f2,…, 2fP−fN} are the N frequency components in the lower-frequency and higher-frequency sidebands of the probe, TE denotes the duration of each frequency component, and TE denotes bit interval of the pump sequence.
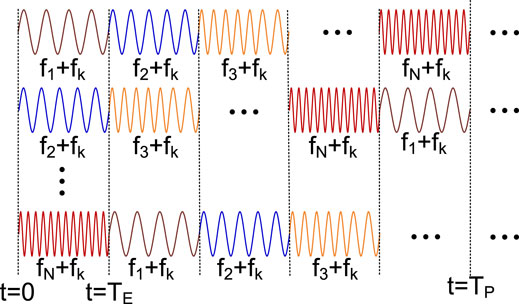
The BGS construction scheme for the SFM probe is schematically shown in Figure 2. The pulsed pump and the SFM probe are time-synchronized during the measurements. The Brillouin gains under different pump-probe frequency differences at any fiber position can be obtained by scanning the time delay between the pump and probe with a step of TE. The BGS at any fiber position can then be constructed by letting the Brillouin gain versus pump-probe frequency difference be in the order fP−fN, fP−fN-1,…, fP−f1. Note that, since the frequency step is fixed at ΔνB/2, the BGS can only be measured roughly. For the purpose of realizing a desired small-enough frequency scanning step, say fd, all the probe frequencies are scanned entirely with a step of fd. The frequency scanning number for each time delay scanning is Nd = ΔνB/(2fd). As a result, the BGS can be measured under pump-probe frequency differences ranging from fP−(fN+ΔνB/2-fd) to fP−f1.
The temporal and spatial evolutions of the pump, probe, and acoustic waves in the sensing fiber can be described by the Brillouin coupled equations [17]:
where AP, As, and Q are the complex amplitudes of the pump, probe, and acoustic waves, respectively; Vg is the group velocity, g1 and g2 are the electro-strictive coupling coefficient and elasto-optic coefficient, respectively; ΓA = ΓB/2 + i (ΩB−Ω) with ΓB/2π is the linewidth of the natural BGS [18], ΩB/2π = fB is the BFS, and Ω/2π is the pump-probe frequency difference. Neglecting the fiber loss, AS (z,t) =
where C0(z) is the initial value of
where the subscript k equals the remainder of (m + i−1)/N and f0 = f15, and u(t) represents the Heaviside unit step function. The sensing fiber from the near to the far fiber end can be treated as a concatenation of N short segments, {[zi zi+1], i = 1…N}. The length of each segment, say Δz, is much shorter than τAVg, where τA is the phonon lifetime. The complex amplitude changes of the probe at the output of the sensing fiber (i.e., z1) can be calculated by [19].
Numerical simulations are performed to analyze the temporal and spatial evolutions of the acoustic and probe waves. The simulation parameters are: (fP−f1)-fB = 112 MHz, fd = 1 MHz, ΔνB = 30 MHz, N = 15, Nd = 15, so that the frequency offset between the pump-probe frequency difference and the BFS changes in the range from -112 to 112 MHz with a step of 1 MHz. Further, Δz = 0.1 m and TE = 60 ns.
In order to observe the acoustic wave evolution under different probe frequencies, a continuous pump is assumed. Under such an assumption, a long enough pump-probe interaction time at each fiber position is guaranteed. Figure 3A shows the distribution of the acoustic wave amplitude versus time profiles along the fiber positions ranging from 0 to 100 m at the 1st time delay scanning and 1st frequency scanning. As an example, the acoustic wave amplitude versus time at z = 0 is shown in Figure 3B. As seen there, when the probe frequency changes suddenly, the acoustic wave amplitude also changes suddenly accompanied with an amplitude oscillation and then reaches a stable value after a time interval of ∼30 ns. The oscillation or transition time is governed by the phonon lifetime (∼6 ns for the standard silica fiber [17]) since τA decides the value of ΓB as ΓB = 1/τA. As an example, in the inset of Figure 3B, we show the magnified view of the acoustic wave amplitude oscillation due to the frequency change from f15 to f1.
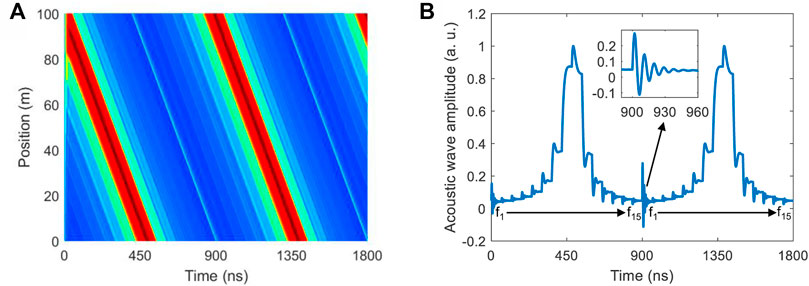
FIGURE 3. (A) Distribution of the acoustic wave amplitude versus time profiles along the sensing fiber in the range 0–100 m at the 1st time delay scanning and 1st frequency scanning. (B) Acoustic wave amplitude versus time at z = 0 m.
A 20 ns single pulse pump with an extinction ratio of 40 dB (i.e., the high and low levels of the pump pulse are set to 1 and 0.01, respectively) is then assumed. The assumed pump duration and extinction ratio equal those in the experiments below. Figure 4 shows the simulated BGS versus distance (A) before and (B) after data arrangement. The acoustic wave transition behavior leads to the Brillouin gain transition behavior between adjacent segmental frequencies as shown in Figure 4A. As a result, Brillouin gain spectra at those gain transition positions cannot be constructed correctly as shown in Figure 4B. The Brillouin gain trace under ΩB−Ω = 0 is shown as the blue curve in Figure 4C. Brillouin gain dips (or transitions) with full widths of ∼ 3 m appear periodically. For the purpose of accurately constructing the Brillouin gains at those gain-dip positions, a second simulation with a 30-ns pump time delay with respect to the first simulation is performed. In this way, the gain transition positions change to gain stable positions since the pump delay time equals the Brillouin gain transition time. The simulated Brillouin gain trace under ΩB−Ω = 0 is shown as the red curve in Figure 4C. The Brillouin gains at those gain-dip positions can now be constructed accurately. For the first measurement, the Brillouin gains at the distances {[0–6]m, [(6k-3)−6k]m, k is an integer and k ≥ 2} can be accurately constructed. For the second measurement, the Brillouin gains at the distances {[0–3]m, [(6k-6)−(6k-3)]m} can be accurately constructed. By combing the accurate Brillouin gain information obtained in the two simulations, accurate Brillouin gain along the sensing fiber can be obtained and is shown as the green curve in Figure 4C. Accordingly, as shown in Figure 4D, by combing the accurate BFS information retrieved in the two simulations (the error is < 0.3 MHz as shown in the inset of Figure 4D), accurate BFS distribution along the sensing fiber can be obtained. Specially note that, the Brillouin gain transition time gives a fundamental limitation on TE, i.e., TE must be two times longer than the Brillouin gain transition time, otherwise Brillouin gain stable duration would be less than the Brillouin gain transition duration. In other words, the gain-transition regions cannot be completely compensated by the second measurement.
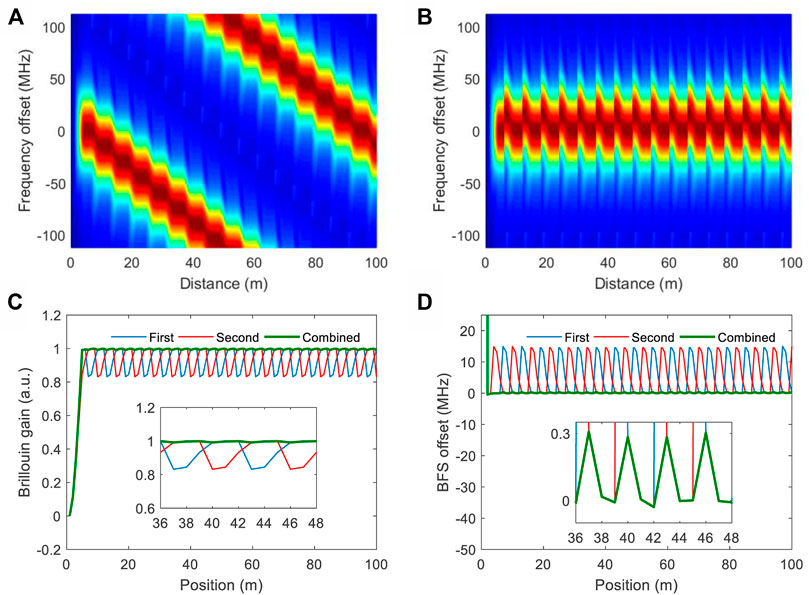
FIGURE 4. Simulated BGS versus distance (A) before and (B) after data arrangement. (C) Brillouin gain traces under ΩB−Ω = 0 and (D) fitted BFS offsets along the sensing fiber.
Experimental Setup
Figure 5 shows the experimental setup of a Golay-coded BOTDA using the proposed SFM probe. The light from a tunable laser source (TLS) at 1,549.6 nm is split by a 50:50 optical fiber coupler. In the upper (probe) branch, an intensity modulator (IM1) biased at Vπ through a bias controller is used to obtain a carrier-suppressed dual-sideband probe. The IM1 is driven by a high-frequency SFM microwave signal, which is generated by the frequency addition of two microwave signals: 1) A continuous microwave signal from a microwave generator (MG) and 2) a low-frequency SFM microwave signal from an arbitrary waveform generator (AWG). The frequency addition is realized by a frequency mixer followed by a bandpass filter (BPF) with a pass band from 10.5 to 11 GHz. The low-frequency SFM microwave signal is composed of 15 frequency components from 300 to 510 MHz with a step of 15 MHz. TE is set to 60 ns and thus TP is 900 ns. The frequency of the continuous microwave signal is swept from 10,663 to 10,677 MHz with a step of 1 MHz. Thus, the BGS at each fiber location can be measured under the pump-probe frequency differences from 10763 to 10,987 MHz with a step of 1 MHz. The −3-dBm dual-sideband SFM probe is launched into a 117.46 km sensing fiber through an optical isolator after passing through an erbium-doped fiber amplifier (EDFA1) and an acoustic-optic modulator (AOM1). The AOM1 introduces the same 200-MHz frequency shift to its input optical signal as the AOM2. The BFS of the sensing fiber at room temperature and loose state is 10.88 GHz.
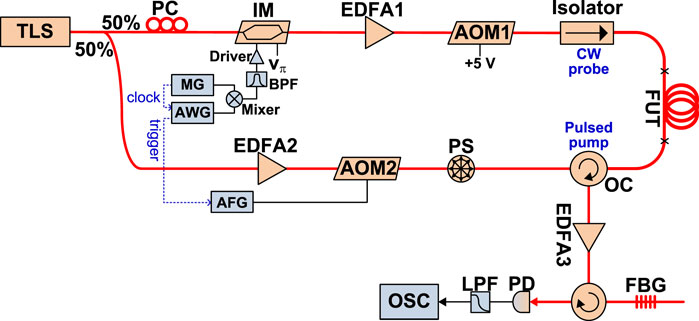
FIGURE 5. Experimental Setup. TLS, tunable laser source; PC, polarization controller; IM: intensity modulator; MG, microwave generator; AWG, arbitrary waveform generator; BPF, bandpass filter, EDFA, erbium-doped fiber amplifier; AOM, acoustic-optic modulator; AFG, arbitrary function generator; PS, polarization scrambler; FUT, fiber under test; OC, optical circulator; FBG, fiber Bragg grating; PD, photo detector; LBF, low pass filter; OSC, oscilloscope.
In the lower branch, optical Golay-coded sequences are generated by using the AOM2 to gate a 29-dBm high-power continuous optical signal from the EDFA2. The AOM2 is driven by the 4-row, 512-bit, unipolar electrical Golay-coded sequences generated by an arbitrary function generator (AFG). The duration of each bit is 20 ns and the bit interval is 900 ns, thus the duration of each row is 460.8 μs. In addition, the period of each row is set to 2 ms. The generated optical Golay sequences with a peak power of 23 dBm are launched into the sensing fiber as the pump through an optical circulator. At the detection stage, the lower-frequency probe sideband is selected (i.e., to measure the Brillouin gain) by a fiber Bragg grating (FBG) after being amplified by the EDFA3. The selected sideband is then sent into a photo-detector (PD) connected to an electrical oscilloscope (OSC) with a sampling rate of 100 MSa/s for data acquisition. A 50-MHz low pass filter (LBF) is inserted between the PD and the OSC for noise removing.
Experimental Results
The amplitudes of the probe under different scanning time delays form 0–840 ns with a step of 60 ns and frequencies from 10663 to 10,677 MHz with a step of 1 MHz are recorded with 256-times averaging for the 4-row Golay-coded sequences, resulting in a 900 × 200,000 raw data matrix, whose 1st row is shown in Figure 6A. Each row of the raw data matrix is then logarithmically normalized [14] to get the cumulated Brillouin gain matrix, whose 1st row is shown in Figure 6B. The magnified views of the results from 0.65 to 0.6518 ms are shown in the insets of the two figures. The standard Golay decoding process is further applied to the cumulated Brillouin gain matrix, resulting in a 225 × 399,999 single-pulse Brillouin gain matrix, whose 1st row in the range 0–1.2 ms is shown in Figure 6C—the beginning of the Brillouin gain trace is aligned to 0 ms. The magnified view of the result from 1 to 2.8 μs is shown in the inset. As seen from the insets in Figures 6A–C, different frequency components of the SFM probe experience different Brillouin gains. Data arrangements for each column of the single-pulse Brillouin gain matrix are further performed to get the BGS at each fiber location. The Brillouin gain trace under the 10.88-GHz pump-probe frequency difference is shown as the blue curve in Figure 6D. The Brillouin gain trace exhibits periodic Brillouin gain dips with full widths of ∼ 3 m (see the inset in Figure 6D), which matches well with the numerical simulation results.

FIGURE 6. (A) 1st row of the acquired raw data matrix. (B) 1st row of the logarithmically normalized cumulated Brillouin gain matrix. (C) 1st row of the decoded single-pulse Brillouin gain matrix before data arrangement. (D) decoded single-pulse Brillouin gain traces under the pump-probe frequency difference of 10.86 GHz after data arrangement.
A second measurement with a pump time delay of 30 ns with respect to the first measurement is implemented to re-measure the Brillouin gains at these gain-dip regions. The decoded single-pulse Brillouin gain trace under the 10.86-GHz pump-probe frequency difference in the second measurement is shown as the red curve in Figure 6D. The combined Brillouin gain trace obtained using the same way in the simulation is shown as the green curve in Figure 6D, the Brillouin gain dips can be perfectly eliminated. The results in Figure 6D indicate that TE can be as short as 60 ns and thus TP can be as short as 900 ns. Accordingly, the duration of the 512-bit Golay-coded sequence can be as short as 460.8 μs. A smaller code sequence duration means a smaller amount of raw data for acquisition and processing.
In order to assess the coding gain offered by the 512-bit Golay coding, a single-pulse BOTDA with the same 23-dBm peak pump power is experimentally performed. The probe power is set to −6 dBm—the maximum allowable value for the conventional dual-sideband probe [8, 11]. The measured SNR of the Brillouin gain versus distance is shown as the blue curve in Figure 7A, which is ∼ −8.3 dB at the far fiber end. For a fair comparison, the power of the SFM probe is reduced to −6 dBm. The measured SNR of the Brillouin gain versus distance for the Golay-coded BOTDA is shown as the green curve in Figure 7A. As seen there, the Golay coding nearly brings no coding gain.

FIGURE 7. (A) SNR of the Brillouin gain versus distance for the Golay-coded BOTDAs based on the SFM probe with data acquisition voltage ranges of 1.5 V (green curve) and 0.15 V (red curve), and for a conventional single-pulse BOTDA with a data acquisition range of 0.15 V (blue curve). (B) Brillouin gain trace after 65 km for the data acquisition voltage ranges of 1.5 V (blue curve) and 0.15 V (black curve). By subtracting the gain depletion caused by the EDFA transient effect (i.e., the value at position (A), the gain depletion at the far fiber end is compensated (red curve).
The data acquisition voltage ranges for the single-pulse BOTDA and the Golay-coded BOTDA are different, i.e., 0.15 V for the former and 1.5 V for the latter. The acquisition resolution of the OSC is only 8 bits, so that much stronger quantization noise is introduced to the Golay-coded BOTDA. We then reduce the data acquisition voltage range to 0.15 V to acquire the signals from the LBF in the range 0.05–0.2 V. Under such a circumstance, only the Brillouin gain after 65 km can be decoded. The resulting Brillouin gain trace after 65 km is shown as the black curve in Figure 7B. For comparison, the Brillouin gain trace obtained under the 1.5-V voltage range is shown as the blue curve in Figure 7B, which has a much worse SNR. Besides, the transient effect of the EDFA3 introduces gain depletion to the Brillouin gain trace. The position-related gain depletion at the far fiber end can be obtained, i.e., the value of the black curve at position A. By subtracting the gain depletion from the black curve, the gain-depletion-compensated Brillouin gain trace is obtained and is shown as the red curve in Figure 7B. Its SNR versus distance is shown as the red curve in Figure 7B, which is ∼ 5.7 dB at the far fiber end. By using the same gain-depletion-compensation strategy, the SNR of the Brillouin gain for the single-pulse BOTDA at the far fiber end is improved to ∼ −5.2 dB. Hence, a coding gain of ∼ 10.9 dB at the far fiber end is realized by pulse coding, matching well with the theoretical 10.5-dB coding gain for a code length of 512 bits. Note that, for the other fiber positions, the SNR is impaired by quantization noise (before 65 km) and gain depletion from the EDFA (the whole sensing fiber). The two issues may be overcome by using an OSC with a higher data acquisition resolution and a pulsed EDFA [20].
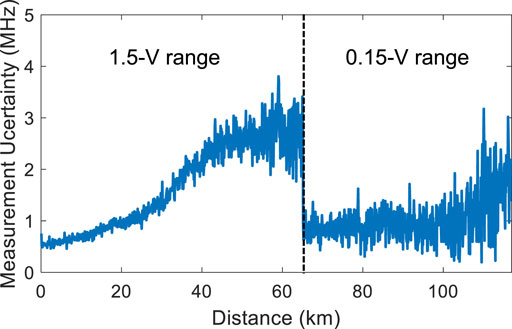
The power of the SFM probe is set back to −3 dBm. Figure 8 shows the estimated BFSs Figure 8A along the whole sensing fiber and Figure 8B at the far fiber end. A hotspot is created near the far fiber end by placing a 28-m fiber segment in a water bath at a temperature of 50°C. The 25-MHz BFS change of this hotspot can be accurately measured with a 2-m spatial resolution, indicating that non-local effect can be effectively alleviated by our proposal. The BFS measurement uncertainty versus distance, calculated form the standard deviation (STD) value of the BFSs at each fiber position in consecutive 5-times measurements, is shown in Figure 9. A BFS measurement uncertainty of < 3 MHz along the whole sensing fiber is realized, which is expected to be reduced to < 2 MHz by using an OSC with a higher acquisition resolution. The calculated FoM of our SFM-based-BOTDA is about 630′000. To our best knowledge, this is the highest FoM realized by a repeaterless BOTDA until now (Table 1).
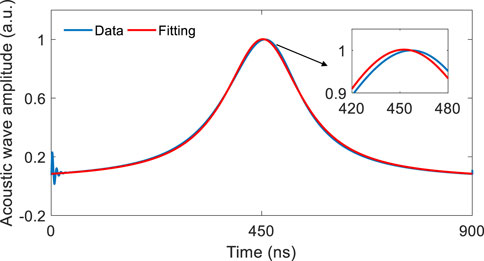
If using the LFM probe to realize the same frequency scanning range over the same time period (TP = 900 ns), the frequency sweep rate would be as high as 225 MHz/900 ns = 0.25 PHz/s. 225-times time delay scanning with a step of 4 ns would be needed to construct the BGS, corresponding to a frequency scanning step of 1 MHz. The simulated acoustic wave amplitude versus time at z = 0 m for the LFM probe under a continuous pump is shown as the blue curve in Figure 10. Unlike the amplitude segmentally changed manner for the SFM probe as shown in Figure 3B, the frequency continuously changed probe generates the amplitude continuously changed acoustic wave. Its Lorentz fitting curve as shown as the red curve in Figure 10 indicates that the acoustic wave amplitude is slightly rightward-tilted.
Figure 11 shows the simulated BGS for the LFM and SFM probe methods under BFS offsets of Figure 11A 0 MHz and Figure 11B 75 MHz. The BGS is obviously rightward-tilted for the LFM probe method while is symmetrical for the SFM probe method. By Lorentz-fitting the simulated BGS, the retrieved BFS offsets for the LFM probe method are 4.34 and 80.05 MHz, respectively, indicating BFS estimation errors of 4.34 and 5.05 MHz, respectively. In contrast, the BFSs can be correctly estimated by using the SFM probe method. In order to experimentally assess the performance of the LFM probe method, a LFM microwave signal changing from 300 to 525 MHz with a duration of 900 ns is generated by the AWG. In addition, the microwave signal from the MG remains fixed at 10,663 MHz meanwhile 225-times time delay scanning with a step of 4 ns is performed for BGS measurement. The hot spot is placed at the near fiber end for high-SNR measurements. Figure 11 further shows the measured BGS under temperatures of Figure 11C 25°C (BFS offset of 0 MHz) and Figure 11D 100°C (BFS offset of 75 MHz) for the LFM and SFM probe methods. The BFS estimation errors at the two temperatures are 3.8 and 4.1 MHz when using the LFM probe method, while they are reduced to 0.5 and 0.8 MHz when using the SFM method. Note that, the LBF used for noise removing in data acquisition smooths the Brillouin gain trace, which leads to the slight mismatch between the results in Figures 11B,D. In addition, the slow response time of the AOM (∼6 ns) narrows the Brillouin linewidth to some extent as shown in Figure 11.
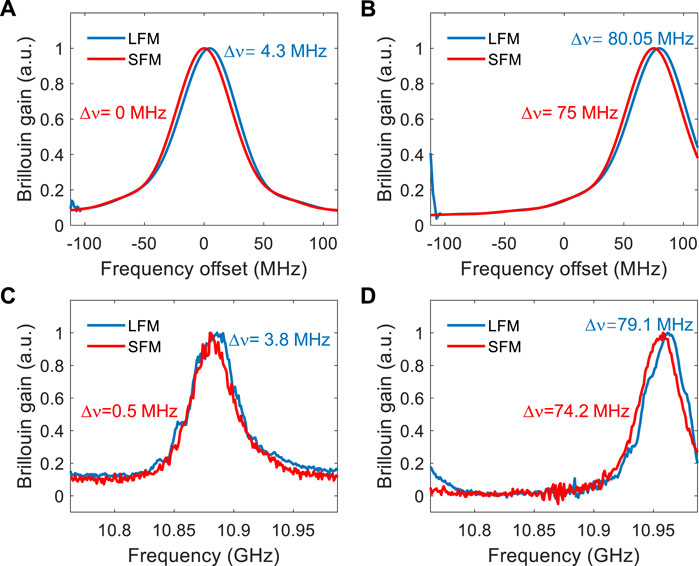
FIGURE 11. Simulated BGS for the LFM and SFM probe methods under BFS offsets of (A) 0 MHz and (B) 75 MHz. Measured BGS for the LFM and SFM probe methods under temperatures of (C) 25°C and (D) 100°C.
The reason of the performance difference for the two methods is fundamentally related to the different temporal and spatial evolution properties of the acoustic waves governed by the different frequency modulation properties of the two types of probes. The Brillouin gain at a fiber position is related to the amplitudes of all the acoustic waves along a fiber segment covered by the pump (Eq. 4). For the LFM probe, the probe frequency varies along this fiber segment, so that it is hard to get the pure Brillouin gain response corresponding to a single probe frequency. What’s worse, the gain pureness would be related to Brillouin linewidth, BFS offset, and frequency sweep rate. This largely increases the measurement uncertainty of the sensor. Clearly, the gain pureness can be improved by reducing the frequency sweep rate. However, a smaller frequency sweep rate results in a longer code sequence duration and thus a larger raw data size.
Conclusion
In this work, the SFM probe for the reduction of non-local effects in Golay-coded BOTDAs has been theoretically proposed, numerically analyzed, and experimentally demonstrated. The corresponding fiber length of each segmental frequency can be as short as 6 m for a 20 ns pump. Even the probe power reaches −3 dBm under a cumulated peak Brillouin gain of 2.674, a hot spot near the far end of the 117.46-km sensing fiber can still be successfully detected, validating the effectiveness of our proposal in non-local effect mitigation. The duration of each segmental frequency is ultimately limited by and must be two-times larger than the Brillouin gain transition time. Otherwise, the measurement blind regions cannot be compensated. Further efforts may be used in overcoming the effect of the Brillouin gain transition. The proposed SFM-based-BOTDA may be employed for the ultra-long distance structure health and environment temperature monitoring of submarine oil pipelines and optic-fiber communication cables.
Data Availability Statement
The original contributions presented in the study are included in the article/Supplementary Material, further inquiries can be directed to the corresponding author.
Author Contributions
All authors contributed to the idea and the conceptual design. ZL built the experiments, performed the measurements, analyzed the data, and wrote the manuscript. YZ and JY helped on the experiments and measurements. ZH and LY supervised the project.
Funding
The work was supported in part by National Natural Science Foundation of China (NSFC) (61735015, 62005220), National Key Research and Development Plan (2020YFB1711902), Sichuan International Science and Technology Innovation Cooperation Project (2021YFH0013).
Conflict of Interest
The authors declare that the research was conducted in the absence of any commercial or financial relationships that could be construed as a potential conflict of interest.
Publisher’s Note
All claims expressed in this article are solely those of the authors and do not necessarily represent those of their affiliated organizations, or those of the publisher, the editors and the reviewers. Any product that may be evaluated in this article, or claim that may be made by its manufacturer, is not guaranteed or endorsed by the publisher.
References
1. Motil A, Bergman A, Tur M. [INVITED] State of the Art of Brillouin Fiber-Optic Distributed Sensing. Opt Laser Tech (2016) 78:81–103. doi:10.1016/j.optlastec.2015.09.013
2. Kwon I, Jin G, Seo D, Kim C, Lee N, Yun C. Feasibility Study for Monitoring of Off-Shore Pipelines Using BOTDA System. Proc SPIE (2009) 7317. doi:10.1117/12.821984
3. Wiederhecker GS, Dainese P, Mayer Alegre TP. Brillouin Optomechanics in Nanophotonic Structures. APL Photon (2019) 4:071101. doi:10.1063/1.5088169
4. Zou W, He Z, Hotate K. Investigation of Strain- and Temperature-Dependences of Brillouin Frequency Shifts in GeO2-Doped Optical Fibers. J Lightwave Technol (2008) 26:1854–61. doi:10.1109/jlt.2007.912052
5. Dong Y, Zhang H, Chen L, Bao X. 2 Cm Spatial-Resolution and 2 Km Range Brillouin Optical Fiber Sensor Using a Transient Differential Pulse Pair. Appl Opt (2012) 51:1229–35. doi:10.1364/ao.51.001229
6. Li Z, Yang Z, Yan L, Soto MA, Thévenaz L. Hybrid Golay-Coded Brillouin Optical Time-Domain Analysis Based on Differential Pulses. Opt Lett (2018) 43:4574–7. doi:10.1364/ol.43.004574
7. Thévenaz L, Mafang SF, Lin J. Effect of Pulse Depletion in a Brillouin Optical Time-Domain Analysis System. Opt Express (2013) 21:14017–35. doi:10.1364/OE.21.014017
8. Dominguez-Lopez A, Yang Z, Soto MA, Angulo-Vinuesa X, Martin-Lopez S, Thevenaz L, et al. Novel Scanning Method for Distortion-Free BOTDA Measurements. Opt Express (2016) 24:10188–204. doi:10.1364/oe.24.010188
9. Urricelqui J, Sagues M, Loayssa A. BOTDA Measurements Tolerant to Non-Local Effects by Using a Phase-Modulated Probe Wave and RF Demodulation. Opt Express (2013) 21:17186–94. doi:10.1364/oe.21.017186
10. Urricelqui J, Sagues M, Loayssa A. Synthesis of Brillouin Frequency Shift Profiles to Compensate Non-Local Effects and Brillouin Induced Noise in BOTDA Sensors. Opt Express (2014) 22:18195–202. doi:10.1364/oe.22.018195
11. Ruiz-Lombera R, Urricelqui J, Sagues M, Mirapeix J, López-Higuera JM, Loayssa A. Overcoming Nonlocal Effects and Brillouin Threshold Limitations in Brillouin Optical Time-Domain Sensors. IEEE Photon J (2015) 7:6803609. doi:10.1109/jphot.2015.2498543
12. Mompó JJ, Iribas H, Urricelqui J, Loayssa A. Second-Order Nonlocal Effects Mitigation in Brillouin Optical Time-Domain Analysis Sensors by Tracking the Brillouin Frequency Shift Profile of the Fiber. IEEE Photon J (2017) 9:1–12. doi:10.1117/12.2265099
13. Iribas H, Loayssa A, Sauser F, Llera M, Le Floch S. Cyclic Coding for Brillouin Optical Time-Domain Analyzers Using Probe Dithering. Opt Express (2017) 25:8787–800. doi:10.1364/oe.25.008787
14. Yang Z, Li Z, Zaslawski S, Thévenaz L, Soto MA. Design Rules for Optimizing Unipolar Coded Brillouin Optical Time-Domain Analyzers. Opt Express (2018) 26:16505–23. doi:10.1364/oe.26.016505
15. Wei W, Yi L, Jaouën Y, Hu W. Bandwidth-Tunable Narrowband Rectangular Optical Filter Based on Stimulated Brillouin Scattering in Optical Fiber. Opt Express (2014) 22:23249–60. doi:10.1364/oe.22.023249
16. Yi L, Wei W, Jaouen Y, Shi M, Han B, Morvan M, et al. Polarization-Independent Rectangular Microwave Photonic Filter Based on Stimulated Brillouin Scattering. J Lightwave Technol (2016) 34:669–75. doi:10.1109/jlt.2015.2475297
17. Beugnot J-C, Tur M, Mafang SF, Thévenaz L. Distributed Brillouin Sensing with Sub-Meter Spatial Resolution: Modeling and Processing. Opt Express (2011) 19:7381–97. doi:10.1364/oe.19.007381
18. Minardo A, Bernini R, Zeni L. Numerical Analysis of Single Pulse and Differential Pulse-Width Pair BOTDA Systems in the High Spatial Resolution Regime. Opt Express (2011) 19:19233–44. doi:10.1364/oe.19.019233
19. Li Z, Zhou Y, Jiang B, Gan X, Yan L, Zhao J. Dynamic Strain Measurement Based on Ultrafast Brillouin Collision in the Correlation Domain. Opt Lett (2021) 46:3488–91. doi:10.1364/ol.426181
20. Iribas H, Mariñelarena J, Feng C, Urricelqui J, Schneider T, Loayssa A. Effects of Pump Pulse Extinction Ratio in Brillouin Optical Time-Domain Analysis Sensors. Opt Express (2017) 25:27896–912. doi:10.1364/oe.25.027896
21. Soto MA, Angulo-Vinuesa X, Martin-Lopez S, Chin S-H, Ania-Castanon JD, Corredera P, et al. Extending the Real Remoteness of Long-Range Brillouin Optical Time-Domain Fiber Analyzers. J Lightwave Technol (2014) 32:152–62. doi:10.1109/jlt.2013.2292329
22. Fu Y, Zhu R, Han B, Wu H, Rao Y-J, Lu C, et al. 175-km Repeaterless BOTDA with Hybrid High-Order Random Fiber Laser Amplification. J Lightwave Technol (2019) 37:4680–6. doi:10.1109/jlt.2019.2916413
Keywords: distributed optical fiber sensor, stimulated brillouin scattering, brillouin optical time domain analyzer, linear frequency modulated probe, segmental frequency modulated probe
Citation: Li Z, Zhou Y, Ye J, Hua Z and Yan L (2022) Segmental Frequency Modulated Probe for Non-Local Effect Reduction in a Pulse-Coded Brillouin Optical Time Domain Analyzer. Front. Phys. 10:928001. doi: 10.3389/fphy.2022.928001
Received: 25 April 2022; Accepted: 23 May 2022;
Published: 22 June 2022.
Edited by:
Rajib Biswas, Tezpur University, IndiaReviewed by:
Yogendra Kumar Prajapati, Motilal Nehru National Institute of Technology Allahabad, IndiaMandeep Singh, National Institute of Technology, Karnataka, India
Copyright © 2022 Li, Zhou, Ye, Hua and Yan. This is an open-access article distributed under the terms of the Creative Commons Attribution License (CC BY). The use, distribution or reproduction in other forums is permitted, provided the original author(s) and the copyright owner(s) are credited and that the original publication in this journal is cited, in accordance with accepted academic practice. No use, distribution or reproduction is permitted which does not comply with these terms.
*Correspondence: Zonglei Li, emxsaUBzd2p0dS5lZHUuY24=
 Zonglei Li
 Yin Zhou
 Jia Ye2
 Lianshan Yan