- National Institute of Mental Health, National Institutes of Health, Bethesda, MD, United States
For the H4 protons of glutamate (Glu), glutamine (Gln), and the glutamyl moiety of glutathione (GSH), the effect of the internal strong scalar coupling between the two nonequivalent H4 protons is far greater than that of the external couplings between the H3 and H4 protons. In this work, the roles of the internal and external scalar coupling terms in the dependence of Glu, Gln, and glutamyl GSH H4 peak amplitudes on the placement of the refocusing pulses of the point resolved spectroscopy sequence were investigated by full density matrix simulations. These strong coupling effects allowed practical and approximately simultaneous maximization of the sensitivity of the spectrally resolved Glu, Gln, and glutamyl GSH H4 pseudo singlets for spatially localized in vivo detection of Glu, Gln, and GSH in the human brain using magnetic resonance spectroscopy at the magnetic field strength of 7 Tesla.
Introduction
Glutamate (Glu) is the main excitatory neurotransmitter in the central nervous system. Astroglial glutamine (Gln) is metabolically connected to neuronal glutamate via the glutamate-glutamine cycle [1]. Abnormal Glu and Gln concentrations have been implicated in many brain disorders such as epilepsy, schizophrenia, Alzheimer’s disease, major depressive disorder, hepatic encephalopathy, and cancer [1–4]. Glutathione (GSH) is an important antioxidant whose levels are a marker of redox state. Altered GSH levels have been found in aging, cancer, Parkinson’s disease, Alzheimer’s disease, multiple sclerosis, schizophrenia, and bipolar disorder [5–14].
In vivo measurement of Glu, Gln, and GSH using magnetic resonance spectroscopy (MRS) is often hampered by overlapping resonance signals including mutual overlapping among the resonances of Glu, Gln, and GSH. It has recently been reported that metabolite quantification at 3 T with short echo time (TE), especially quantification of Glu, is significantly affected by the strong macromolecule baseline [15]. It is therefore imperative to develop and optimize MRS techniques to reliably measure scalarly (J) coupled metabolites such as Glu, Gln, and GSH with minimized interference from overlapping metabolite and macromolecule signals.
At 7 Tesla (T), the Glu, Gln, and glutamyl GSH H4 protons were observed to form intense signals that appear as singlets, referred to as pseudo singlets, in proton MRS spectra acquired in vivo at TE of 100–110 ms [16, 17]. At such TE values, macromolecule signals are dramatically reduced compared to short TEs, which is important for minimizing interference from the macromolecule baseline. A point resolved spectroscopy (PRESS) sequence with a TE of 106−69 ms for the first echo time (TE1) and 37 ms for the second echo time (TE2)−and a J-suppression RF pulse inserted between the two 180° refocusing RF pulses has been developed to generate spectrally resolved Glu, Gln, and glutamyl GSH H4 pseudo singlets at 7 T [17]. Since Glu, Gln, and GSH signals are still strongly coupled at 7 T, their spectral pattern depends on the timing of the 180° refocusing pulses even when the total TE is fixed.
In this work, we investigate how the Glu, Gln, and glutamyl GSH H4 peak amplitudes vary for different values of TE1 while keeping the total TE, which is TE1 + TE2, fixed at ∼106 ms to maintain the formation of intense H4 pseudo singlets by spin evolution. Furthermore, we also investigate the effects of individual J-coupling terms on the TE1 dependence of the H4 pseudo singlet amplitudes. By choosing an optimal TE1 for practical realization of the pulse sequence, higher precision or reduced scan time can be achieved for simultaneously measuring spectrally resolved Glu, Gln, and glutamyl GSH H4 pseudo singlets at 7 T in the human brain in vivo.
Materials and Methods
Density Matrix Simulation
Full density matrix simulations have been shown to reproduce phantom results and widely used to calculate metabolite basis functions for fitting in vivo spectra [17–19]. Here, full density matrix simulations with high spatial digitization [20, 21] were used to numerically compute the basis functions of Glu, Gln, and GSH. Chemical shifts and coupling constants (Supplementary Table S1) were obtained from Ref. [16] for GSH and Ref. [22] for Glu, Gln, and N-acetylaspartate (NAA). For the total TE of 106 ms, TE1 was varied from 10 to 95 ms with 1 ms increment. A total of 86 sets of Glu, Gln, and GSH basis functions were numerically computed. Our density matrix simulations were programmed in C++ based on the GAMMA library [23]. The effects of localization gradients were simulated as frequency shifts of the spin systems [24]. Pre-calculation of propagators [25] and the 1D projection method [20] were used to speed up the computation. For the 86 different TE1 values, the propagators for the excitation pulse and the refocusing pulse were only computed once and reused 85 times. After the basis functions of Glu, Gln, and GSH for the 86 different TE1 values were obtained from the density matrix simulations, they were multiplied by a 9 Hz exponential decay function and Fourier transformed to the frequency domain to generate the corresponding line-broadened spectra. The Glu, Gln, and glutamyl GSH H4 peak amplitudes were extracted from the spectra for each TE1 value. Subsequently, the Glu, Gln, and glutamyl GSH H4 peak amplitude vs. TE1 curves were plotted to visualize their TE1 dependence. The TE1 value that maximized the peak amplitudes was identified.
To investigate the roles of the internal scalar coupling between the two H4 protons and external scalar couplings between the H3 and H4 protons (Figure 1), additional density matrix calculations were performed with selected spin couplings set to zero. Furthermore, two additional TE values of 100 and 110 ms were simulated. For TE = 100 ms, TE1 was varied from 10 to 90 ms with 1 ms increment. For TE = 110 ms, TE1 was varied from 10 to 100 ms with 1 ms increment. A frequency selective J-suppression RF pulse [17] with 113 Hz (0.38 ppm) full width at half maximum (FWHM) bandwidth was applied at 4.38 ppm where the α-H of the aspartyl moiety of NAA resonates. This pulse suppressed the H3 proton signal of the aspartyl moiety of NAA at ∼2.48 ppm but did not affect any of the Glu, Gln, and glutamyl GSH signals which resonate at 2.0–3.8 ppm. The flip angle and timing of the J-suppression pulse were adjusted to minimize the NAA aspartyl H3 resonance signals that overlap with the Glu, Gln, and glutamyl GSH H4 signals.
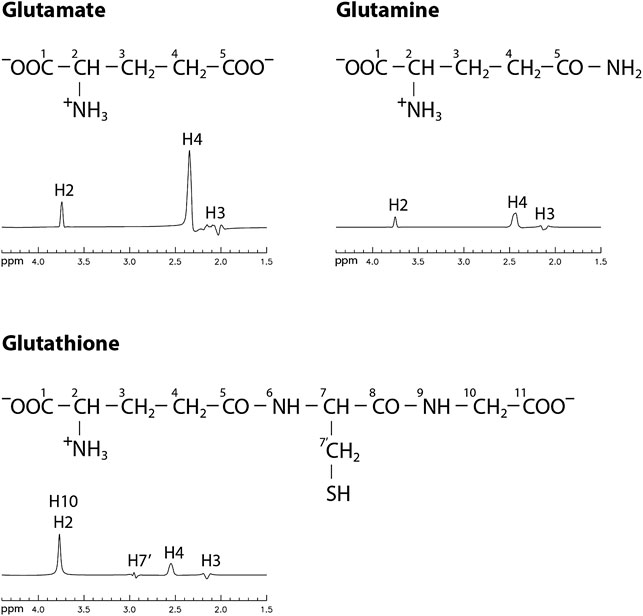
FIGURE 1. Chemical structures and numerically computed spectra of Glu, Gln, and GSH in the range of 1.5–4.4 ppm with TE/TE1 = 106/16 ms. Concentration ratios of [Glu]: [Gln]: [GSH] = 10: 3: 2 were used to scale the spectra.
In Vivo Magnetic Resonance Spectroscopy Experiments
The numerically optimized MRS technique with J-suppression was tested using a Siemens Magnetom 7 T scanner equipped with a 32-channel receiver head coil. In vivo experiments were performed to acquire MRS spectra from three healthy participants (2 female and 1 male; age = 35 ± 5 years) and three unmedicated patients (2 female and 1 male; age = 40 ± 15 years) with major depressive disorder (MDD). Written informed consent was obtained from the participants before the study in accordance with procedures approved by our local institutional review board. A three-dimensional (3D) T1-weighted magnetization prepared rapid gradient echo (MPRAGE) image was acquired with TR = 3 s, TE = 3.9 ms, data matrix = 256 × 256 × 256, and spatial resolution = 1 × 1 × 1 mm3. Based on the 3D image, a 2 × 2 × 2 cm3 MRS voxel was placed in the pregenual anterior cingulate cortex (pACC), which plays an essential role in depression neurocircuitry [26]. The first- and second-order B0 shimming coefficients were adjusted, achieving water linewidths of 11.0 ± 0.5 Hz for the three healthy participants and 13.1 ± 0.2 Hz for the three MDD patients. The main component of the pulse sequence was the numerically optimized double spin echo technique with the addition of a J-suppression pulse. The pulse sequence had TE = 106 ms, TE1 = 16 ms, TR = 2.5 s, number of averages = 116, number of averages for unsuppressed water signals = 2, and total scan time = 5 min. The excitation pulse was an asymmetric amplitude-modulated pulse with duration = 4.5 ms and FWHM bandwidth = 3.1 kHz [27]. The 180° refocusing pulses were also amplitude-modulated with duration = 8.0 ms and FWHM bandwidth = 2.0 kHz [17]. The J-suppression pulse was a truncated Gaussian pulse with a duration of 10 ms [28], an optimized flip angle of 120°, FWHM bandwidth of 113 Hz, and a frequency targeting 4.38 ppm. The time delay between the first refocusing pulse and the J-suppression pulse was 40.3 ms. Water suppression was achieved using seven variable power RF pulses with optimized relaxation delays (VAPOR). Each RF pulse was a 26-ms sinc-Gauss pulse with FWHM bandwidth of ∼105 Hz.
Data Analysis
The 32-channel free induction decay (FID) data were combined into single-channel FIDs using the generalized least square (GLS) method [29], in which coil sensitivities were computed from the unsuppressed water signals acquired with two transients. The unsuppressed water signals were also used to correct for the phase errors in the combined single-channel FIDs caused by zero-order eddy currents [30]. These FIDs were Fourier transformed to the frequency domain to obtain spectra for all 116 transients. Bloch-Siegert phase shift in each individual spectrum due to the use of the frequency-selective J-suppression pulse was corrected by multiplying each individual spectrum with the complex-conjugate of the corresponding Bloch-Siegert phasor function computed using density matrix simulations as described previously [21]. The frequency deviation in each individual spectrum was determined and corrected by fitting the magnitude of the creatine and choline peaks with two Voigt curves. Meanwhile, a histogram of the frequency deviations, which was a distribution of the frequency deviations at 1 Hz intervals for all 116 transients, was generated for subsequent frequency drift correction [21]. The 116 individual spectra were then summed to generate the reconstructed spectrum for post-acquisition correction of the effect of frequency drifts [31]. The reconstructed spectrum was fitted in the range of 1.8–3.4 ppm by linear combination of numerically computed basis spectra of acetate (Ace), NAA, N-acetylaspartylglutamate (NAAG), γ-aminobutyric acid (GABA), Glu, Gln, GSH, aspartate (Asp), creatine (Cr), choline (Cho), taurine (Tau), myo-inositol (mI), and scyllo-inositol (sI), as well as a spline baseline [17]. Chemical shifts and coupling constants were obtained from Ref. [32] for GABA, from Ref. [16] for GSH, and from Ref. [22] for the rest of the metabolites. The fitting program was developed in-house and was based on the Levenberg-Marquardt least square minimization algorithm. Basis spectra for 31 frequency deviation values ranging from -15 to 15 Hz at 1 Hz intervals were computed. The basis spectra used in the fitting were computed as the weighted average of the basis spectra corresponding to 31 frequency deviation values, where the experimentally measured frequency deviation histogram was used as the weighting function [21]. Metabolite concentrations in arbitrary unit were obtained from the fitting program, and subsequently metabolite ratios [/(Cr)] were reported.
To evaluate if the MRS method with TE1 = 16 ms increased Glu, Gln, and GSH peak amplitudes in vivo, the Glu, Gln, and GSH peak amplitude to concentration ratios were computed from the data extracted from the three healthy participants in this study and the eight healthy participants from the previous study with TE1 = 69 ms [17]. The Glu, Gln, and GSH peak amplitudes were measured from the in vivo spectra and normalized by the Cr peak amplitude. The Glu, Gln, and GSH concentrations were obtained from the fitting and normalized by the Cr concentration. This peak amplitude to concentration ratio was used to assess in vivo peak amplitude changes due to strong coupling effects.
Monte Carlo Simulations
Monte Carlo simulations were performed to evaluate the effect of noise on the precision of measuring Glu, Gln, and GSH. To simulate the MRS data, the concentrations, linewidths, and lineshape of metabolite resonance signals obtained in vivo were used to combine the basis functions described above to generate a noise-free FID, which was then Fourier transformed to the frequency domain to obtain the ground-truth spectrum. White Gaussian noise with level similar to in vivo spectra was added to the ground-truth spectrum. The same spectral fitting routine for quantifying the in vivo spectra was used here to quantify the simulated spectra. This whole simulation process was repeated 1000 times with each repetition using a different realization of the random noise with the same noise level. After all the repetitions were finished, coefficients of variation (CV) of the metabolite concentrations were computed. F-tests were performed to evaluate any significant differences in the variance of metabolite concentrations between the TE1 = 69 ms and TE1 = 16 ms methods.
Results
The numerically computed spectra of Glu, Gln, and GSH at TE = 106 ms and six selected TE1s are displayed in Figure 2. A 9 Hz Lorentzian line broadening was applied to all spectra. In the spectra, the Glu, Gln, and glutamyl GSH H4 protons form pseudo singlets at 2.34, 2.44, and 2.54 ppm, respectively. The Glu peak attains its highest amplitude at TE1 = 16 ms and the Gln and GSH peak amplitudes are the highest at TE1 = 10 ms. Figure 3A plots the peak amplitude vs. TE1 curves for Glu, Gln, and glutamyl GSH H4 peaks at TE = 106 ms and TE1 = 10–95 ms with 1 ms increment. The peak amplitudes were normalized relative to the peak amplitude of the NAA singlet. Figure 3A shows that the Glu H4 peak reaches maximum amplitude at TE1 = ∼16 ms and the Gln and GSH peaks keep increasing when TE1 becomes shorter than 16 ms. However, the shortest allowable TE1 for our RF pulses and crusher gradients was 16 ms. Therefore, TE1 = 16 ms was the practical optimum for obtaining the highest Glu, Gln, and GSH peaks at TE = 106 ms. Compared to TE1 = 69 ms [17], the new method increased the peak amplitude by 14% for Glu, 13% for Gln, and 18% for GSH.
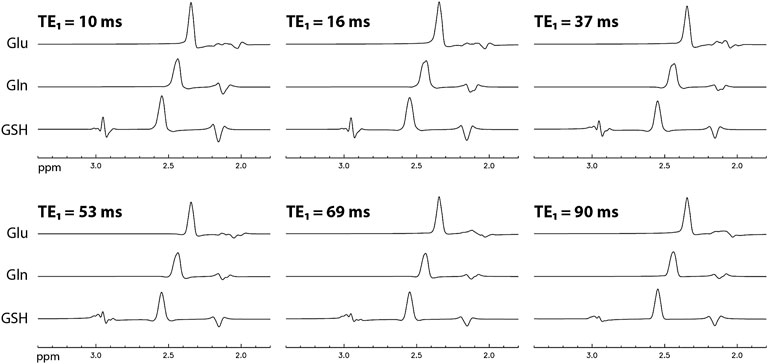
FIGURE 2. Numerically computed spectra of Glu, Gln, and GSH with equal concentration at TE = 106 ms and six selected TE1 values. All spectra were broadened to a Lorentzian linewidth of 9 Hz.
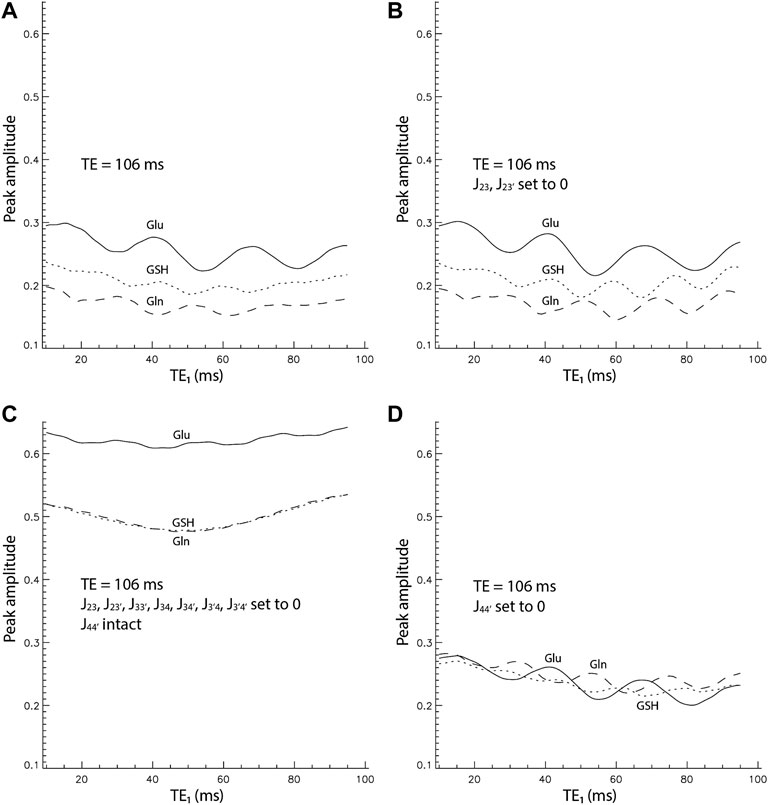
FIGURE 3. Peak amplitude vs. TE1 curves by full density matrix simulations for TE = 106 ms. The peak amplitudes were normalized relative to the NAA singlet. (A). All coupling constants were intact. (B). J23 and J23’ were set to 0. (C). All coupling constants were set to 0 except J44’. (D). Only J44’ was set to 0.
It is well understood that spectral pattern of a weakly coupled spin system is independent of TE1 in a double spin echo sequence such as PRESS. At 7 T, significant strong coupling effects still exist for Glu, Gln, and GSH as shown by the strong dependence of peak amplitude on TE1 in Figure 3A. Noticeably, the Glu pseudo singlet is substantially higher than GSH and Gln for the same concentration. Additionally, each peak amplitude vs. TE1 curve oscillates with a period of 20–25 ms. On top of this oscillatory pattern, each curve is concave upward and the peak amplitude at the lower end of TE1 (TE1 = 10 ms) is higher than at the upper end of TE1 (TE1 = 95 ms).
Figure 3B displays the peak amplitude vs. TE1 curves computed with the coupling constants between the H2 and H3 protons set to 0. The three curves look very similar to those in Figure 3A, which indicates that J-couplings between the H2 and H3 protons have very small effects on the Glu, Gln, and glutamyl GSH H4 signals. In Figure 3C, all J-coupling constants were set to zero except for J44’. The three curves are all concave upward with peak amplitudes at both ends approximately equal. Although the metabolite concentrations in the density matrix simulation here were the same, the Glu curve is conspicuously higher than the closely matched Gln and GSH curves. In Figure 3D, only the coupling constant between the two H4 protons was set to 0 with the rest of the coupling constants intact. The Glu, Gln, and GSH curves have approximately the same peak amplitudes, an oscillatory pattern with a period of 20–25 ms, and a descending trend with increasing TE1.
It has been demonstrated that Glu and Gln H4 peaks are most intense at TE = 100–110 ms with PRESS localization [16]. To ensure that TE = 106 ms was near-optimal for maximizing the Glu, Gln, and GSH peak amplitudes, the peak amplitude vs. TE1 curves for TE = 100 ms and TE = 110 ms were also computed (Figure 4). For all 3 TE values of 100, 106, and 110 ms, Glu, Gln, and GSH peak amplitudes reached their maximum values at the shortest allowable TE1 of 16 ms. The maximum Glu, Gln, and GSH peak amplitudes for the three different TEs with/without considering T2 relaxation are listed in Supplementary Table S2. To compute T2 relaxation effects, the T2 values of Gln and GSH were assumed to be the same as that of Glu, which was determined to be 184 ms [33] as no accurate Gln and GSH T2 values in the frontal region at 7 T have been reported. Supplementary Table S2 shows that the maximum peak amplitudes of Glu, Gln, and GSH are insensitive to TE over the 100–110 ms range and TE = 106 ms produces slightly higher Glu, Gln, and GSH peaks when T2 relaxation is considered. Therefore, the sequence timing of TE = 106 ms and TE1 = 16 ms was near-optimal for simultaneously maximizing Glu, Gln, and GSH H4 pseudo singlet peak amplitudes.
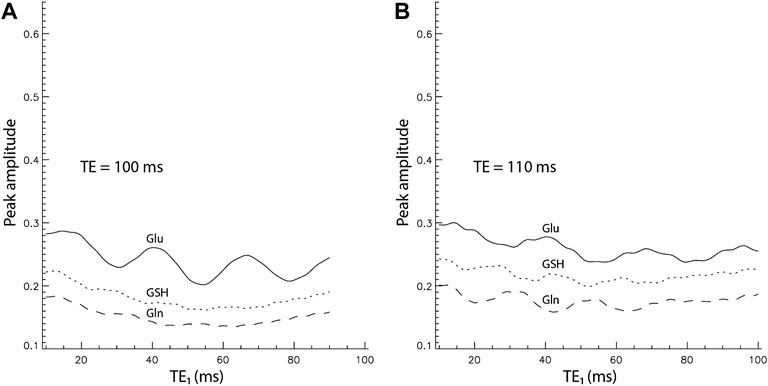
FIGURE 4. Peak amplitude vs. TE1 curves by density matrix simulations for TE = 100 ms (A) and 110 ms (B). The peak amplitudes were normalized relative to the NAA singlet.
After the TE and TE1 values were chosen to be 106 and 16 ms, respectively, density matrix simulations were used to optimize the flip angle and timing of the J-suppression pulse for minimizing the NAA aspartyl signal at ∼ 2.48 ppm. The optimal flip angle of the J-suppression pulse was found to be 120° and the optimal time delay between the first refocusing pulse and the J-suppression pulse was found to be 40.3 ms, which was the longest allowable time delay under the practical constraints of RF pulse and gradient durations. Figure 5 displays the numerically computed NAA spectra with/without the J-suppression pulse. The spectra were broadened to a Lorentzian linewidth of 9 Hz.
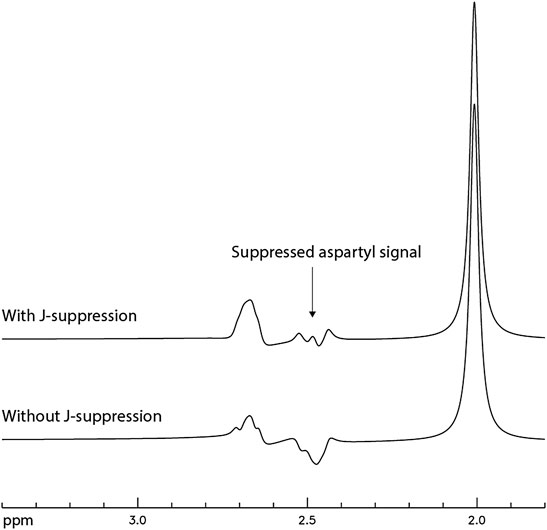
FIGURE 5. Numerically computed NAA spectra with and without the J-suppression pulse. TE = 106 ms; TE1 = 16 ms; J-suppression flip angle = 120°; Time delay between the first refocusing pulse and the J-suppression pulse was 40.3 ms; The spectra were broadened to a Lorentzian linewidth of 9 Hz.
Figure 6 displays the in vivo spectrum acquired from the pACC of a healthy participant using the new technique. Another in vivo spectrum acquired from the pACC of an MDD patient using the same technique is displayed in Figure 7. In both figures, the spectral model fits the in vivo spectrum very well. The Glu, Gln, and GSH peaks are well defined and have high amplitudes. Metabolite ratios [/(Cr)] quantified by fitting the in vivo spectra for the three healthy participants and three MDD patients are listed in Table 1. No attempt was made to compare the healthy participants and MDD patients here due to the small sample size.
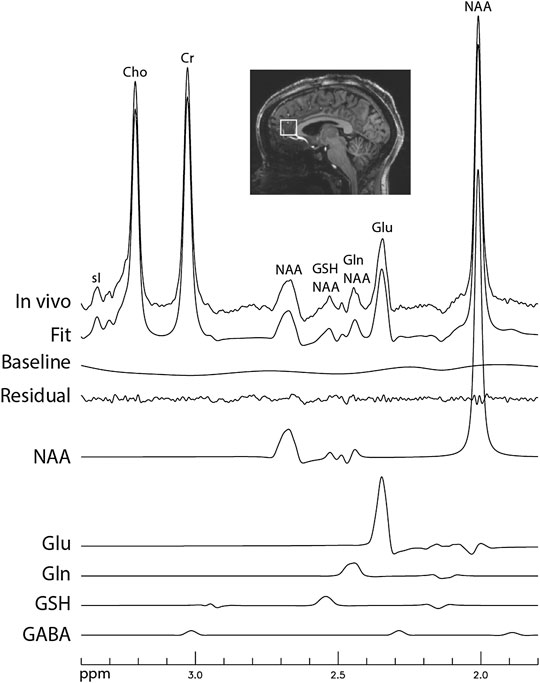
FIGURE 6. In vivo spectrum acquired from the pregenual anterior cingulate cortex of a healthy participant. No linebroadening was applied; voxel size = 2 × 2 × 2 cm3; TR = 2.5 s; TE = 106 ms; TE1 = 16 ms; J-suppression pulse frequency offset = 4.38 ppm; J-suppression flip angle = 120°; Time delay between the first refocusing pulse and the J-suppression pulse was 40.3 ms; number of averages = 116; and total scan time = 5 min.
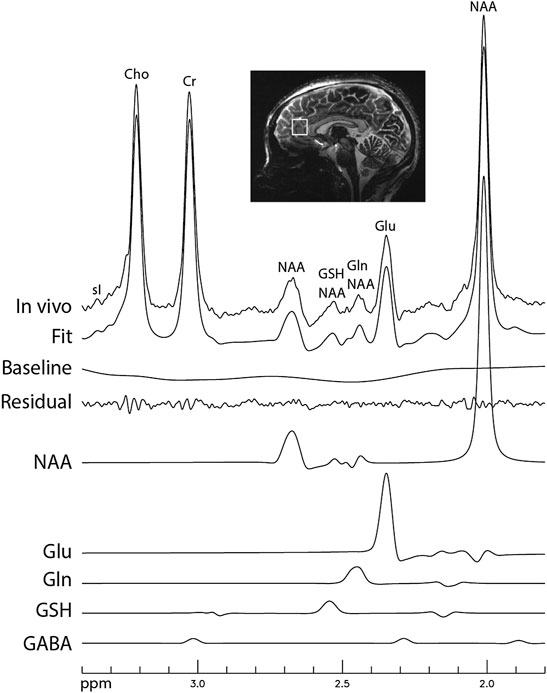
FIGURE 7. In vivo spectrum acquired from the pregenual anterior cingulate cortex of a patient with major depressive disorder (MDD). The data acquisition parameters were the same as in Figure 6.

TABLE 1. Metabolite ratios [/(Cr)] measured from the pACC of three healthy participants (HPs) and three MDD patients with TE = 106 ms and TE1 = 16 ms.
The peak amplitude to concentration ratios for Glu, Gln, and GSH extracted from the three healthy participants for the current study and the eight participants from the previous study [17] were listed in Table 2. Student’s t-test showed that the peak amplitude to concentration ratios for Glu, Gln, and GSH were all significantly higher for TE1 = 16 ms than for TE1 = 69 ms, which confirmed that the newly optimized technique significantly enhanced the peak amplitudes of Glu, Gln, and glutamyl GSH H4 pseudo singlets in vivo.

TABLE 2. Comparison of Glu, Gln, and GSH peak amplitude/concentration values extracted from the previous study (8 healthy participants, TE = 106 ms, TE1 = 69 ms) and the current study (3 healthy participants, TE = 106 ms, TE1 = 16 ms).
The simulated spectra and the corresponding fitted curve from one of the 1000 repetitions in the Monte Carlo simulations for TE1 = 69 ms and TE1 = 16 ms are displayed in Figure 8. Although the same metabolite concentrations were used in simulating the spectra for the two different methods, the Glu, Gln, and GSH peaks at TE1 = 16 ms were significantly higher than at TE1 = 69 ms. Table 3 lists coefficient of variation (CV) values of metabolite concentrations obtained from the Monte Carlo simulations with 1000 repetitions. Compared to TE1 = 69 ms, CV values for TE1 = 16 ms were significantly reduced.
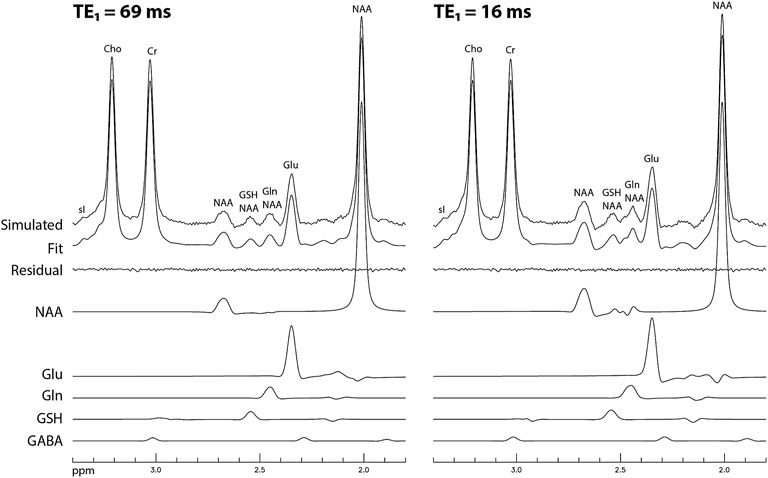
FIGURE 8. Simulated spectra and corresponding fitted curves obtained from a random sample of the 1000 repetitions in the Monte Carlo simulations for TE1 = 69 and 16 ms, respectively. The spectra were simulated based on in vivo metabolite concentrations, noise level, linewidth, and lineshape.

TABLE 3. Coefficient of variation (CV) values of metabolites obtained from Monte Carlo simulations using two different TE1 values of 69 and 16 ms and the same TE of 106 ms. F-tests were performed to evaluate differences in the variance of metabolite concentrations between the two methods.
Discussion
Recent studies have shown that the strong macromolecule baseline at very short TEs can cause large errors in metabolite quantification [15]. Fortunately, Glu, Gln, and glutamyl GSH H4 protons all form relatively sharp and intense pseudo singlets at TE of ∼100 ms, where the interfering spectral baseline becomes very weak due to the much shorter T2 values of macromolecules. In addition, the Glu, Gln, and glutamyl GSH H4 pseudo singlets are well resolved at 7 T, making their quantification robust for clinical studies. This study further shows that the peak amplitudes of Glu, Gln, and glutamyl GSH H4 pseudo singlets can be simultaneously maximized using a very short TE1.
Slice-selective and spectrally nonselective refocusing pulses are used in PRESS to form a double spin echo. For singlets and weakly coupled spins, the timing of the spectrally nonselective refocusing pulses has no effect on their spectral pattern for the same total TE. The timing of spectrally nonselective refocusing pulses, however, affects the outcome of strongly coupled spins because the 180o pulse operators do not commute with strong coupling terms in the nuclear spin Hamiltonian. This TE1 dependence of peak amplitudes forms the basis for maximizing peak amplitudes by optimizing TE1.
The requirement for weak coupling is |J/Δυ| << 1, where J is the scalar coupling constant and Δυ the chemical shift difference. Even at 7 T, strong coupling effects exist for Glu, Gln, GSH, and many other metabolites. For Glu, Gln, and glutamyl GSH H4 protons, the strong coupling effect originating from the internal coupling between the two H4 protons is far greater than the external couplings between the H3 and H4 protons. At 7 T, |J/Δυ| between the two H4 protons of Glu, Gln, and glutamyl GSH is 3.8, 2.4, and 2.4, respectively. In comparison, |J/Δυ| between the H3 and H4 protons falls in the range of 0.05–0.13. This large difference in |J/Δυ| makes it feasible to examine the internal (H4-H4′) and external (H3,3′-H4,4′) coupling effects separately. As shown by Figures 3C,D, the internal scalar interactions between the two H4 protons are responsible for the much higher peak amplitude of Glu as compared to Gln and GSH for the same metabolite concentration. This phenomenon can be explained by the smaller chemical shift difference and stronger coupling between the two H4 protons of Glu, which leads to smaller dephasing of its pseudo singlet at ∼ 100 ms. We have verified this point by density matrix simulation with numerically altered J and Δυ (data not shown). In keeping with this explanation, we also observed that at TE = 56 ms (therefore much reduced dephasing by Δυ), a significant increase in peak amplitude of RF-induced H4 pseudo singlets was achieved for Gln and glutamyl GSH but not for Glu [34].
Figure 3D shows that the overall downward trend and the relatively rapid oscillation in the peak amplitude-TE1 curves are caused by the external coupling between H3 and H4 protons because setting J44’ to zero does little to change the oscillatory pattern of peak amplitudes as a function of TE1. Together with the concave-up shape of the peak amplitude-TE1 curves due to internal H4 couplings (Figure 3C), a practically achievable optimal TE1 for simultaneously maximizing the Glu, Gln, and glutamyl GSH H4 pseudo singlets can be found near the lower end of TE1.
The RF pulses and corresponding crusher gradients used in this study have limited the shortest allowable TE1 to be 16 ms. As shown by Figure 3A, the Glu peak reaches the maximum value at TE1 = ∼16 ms. In comparison, the Gln and GSH peaks keeps rising when TE1 becomes shorter than 16 ms. This suggests that, when Gln and GSH are the primary targets, using very short TE1 can further increase their MRS sensitivity. However, further reduction in RF pulse and gradient durations would increase peak RF amplitude and eddy current effects from stronger gradients.
In this study, we observed via a camera placed inside the scanner that the MDD patients generally had more head movements than the healthy participants. Head movements may cause voxel positioning errors, degraded B0 shimming, frequency drifts, phase errors, and other errors. We also found a significant difference between the water linewidths of the healthy participants (11.0 ± 0.5 Hz) and those of the MDD patients (13.1 ± 0.2 Hz), as well as a significant difference between the NAA linewidths of the healthy participants (10.4 ± 0.7 Hz) and those of the MDD patients (13.1 ± 1.5 Hz). These linewidth differences indicate degraded B0 shimming, and hence confirm that the MDD patients had more head motions than the healthy participants in our study. Because the newly optimized method (TE1 = 16 ms) increases the Glu, Gln, and GSH pseudo singlet signals, it can attain sufficient signal-to-noise ratio (SNR) with a shortened scan time, leading to reduced patient head movements during an MRS scan and thus improve spectral quality and quantification accuracy.
Our previous test-retest assessment has validated the high reliability of measuring the Glu, Gln, and GSH pseudo singlets at TE1 = 69 ms [35]. As shown by Figure 3, the full sensitivity of the spectrally resolved Glu, Gln, and GSH pseudo singlets is achieved at TE1 = 16 ms under the practical constraints of finite RF and gradient durations. Because the further increase in signal amplitude at TE1 = 16 ms can translate into shortened scan time for the same SNR, the new technique can therefore reduce scan time and increase the overall tolerance of MR procedures to further improve the robustness of clinical studies of the glutamatergic system at 7 T [36].
Conclusion
In this work, the roles of different J-coupling terms in the TE1 dependence of Glu, Gln, and glutamyl GSH H4 peak amplitudes were investigated. It was found that the concave-up shape of the peak amplitude-TE1 curves was caused by the internal J-coupling between the two H4 protons. Meanwhile, the higher Glu peak amplitude compared to those of Gln and GSH for the same metabolite concentration was due to the smaller chemical shift difference between the two Glu H4 protons. The oscillatory pattern and descending trend of the peak amplitude-TE1 curves were caused by the J-couplings between the H3 and H4 protons. These strong coupling effects allowed practical and approximately simultaneous maximization of Glu, Gln, and glutamyl GSH H4 pseudo singlets.
Specifically, we have developed an improved proton MRS technique with J-suppression to maximize the SNR for detecting Glu, Gln, and GSH at 7 T while minimizing the aspartyl signal of NAA at ∼2.48 ppm by J-suppression and the macromolecule baseline. Density matrix simulations showed that the newly optimized method (TE1 = 16 ms) increased the peak amplitude by 14% for Glu, 13% for Gln, and 18% for GSH compared to TE1 = 69 ms. This increase represents practical realization of the full sensitivity of spectrally resolved Glu, Gln, and GSH pseudo singlets formed by pulse-interrupted free spin evolution at 7 T. In vivo peak amplitude to concentration ratios for Glu, Gln, and GSH confirmed that the newly optimized technique significantly enhanced the Glu, Gln, and GSH peak amplitudes in vivo.
Data Availability Statement
The raw data supporting the conclusion of this article will be made available by the authors, without undue reservation.
Ethics Statement
The studies involving human participants were reviewed and approved by IRB, National Institutes of Health. The patients/participants provided their written informed consent to participate in this study.
Author Contributions
LA, JE, and JS conceived and designed the experiments. LA developed the pulse sequence and data processing software. JE, CB, LA, and JT performed the experiments. CZ supervised the findings of this work. MF provided medical support. LA and JS prepared the manuscript. All the authors read and approved the final manuscript.
Funding
This study was supported by the Intramural Research Program of the National Institute of Mental Health, National Institutes of Health (IRP-NIMH-NIH). Annual Report numbers: ZIAMH002803, 1ZIAMH002927-12, and 1ZIAMH002857-17. Clinical trial numbers: NCT01266577, NCT04821271, and NCT03973268.
Conflict of Interest
The authors declare that the research was conducted in the absence of any commercial or financial relationships that could be construed as a potential conflict of interest.
Publisher’s Note
All claims expressed in this article are solely those of the authors and do not necessarily represent those of their affiliated organizations, or those of the publisher, the editors and the reviewers. Any product that may be evaluated in this article, or claim that may be made by its manufacturer, is not guaranteed or endorsed by the publisher.
Supplementary Material
The Supplementary Material for this article can be found online at: https://www.frontiersin.org/articles/10.3389/fphy.2022.927162/full#supplementary-material
References
1. Erecinska M, Silver IA. Metabolism and Role of Glutamate in Mammalian Brain. Prog Neurobiol (1990) 35(4):245–96. Epub 1990/01/01. doi:10.1016/0301-0082(90)90013-7
2. Ramadan S, Lin A, Stanwell P. Glutamate and Glutamine: A Review Ofin vivoMRS in the Human Brain. NMR Biomed (2013) 26(12):1630–46. doi:10.1002/nbm.3045
3. Chavarria L, Cordoba J. Magnetic Resonance Imaging and Spectroscopy in Hepatic Encephalopathy. J Clin Exp Hepatol (2015) 5(Suppl. 1):S69–S74. Epub 2015/06/05. doi:10.1016/j.jceh.2013.10.001
4. Natarajan SK, Venneti S. Glutamine Metabolism in Brain Tumors. Cancers (Basel) (2019) 11(11):1628. doi:10.3390/cancers11111628
5. Crisi G. 1H MR Spectroscopy of Meningiomas at 3.0T: The Role of Glutamate-Glutamine Complex and Glutathione. Neuroradiol J (2011) 24(6):846–53. doi:10.1177/197140091102400603
6. Das TK, Javadzadeh A, Dey A, Sabesan P, Théberge J, Radua J, et al. Antioxidant Defense in Schizophrenia and Bipolar Disorder: A Meta-Analysis of Mrs Studies of Anterior Cingulate Glutathione. Prog Neuro-Psychopharmacology Biol Psychiatry (2019) 91:94–102. doi:10.1016/j.pnpbp.2018.08.006
7. Dringen R, Brandmann M, Hohnholt MC, Blumrich E-M. Glutathione-Dependent Detoxification Processes in Astrocytes. Neurochem Res (2015) 40(12):2570–82. doi:10.1007/s11064-014-1481-1
8. Harris JL, Choi IY, Brooks WM. Probing Astrocyte Metabolism In Vivo: Proton Magnetic Resonance Spectroscopy in the Injured and Aging Brain. Front Aging Neurosci (2015) 7:202. doi:10.3389/fnagi.2015.00202
9. Fisher E, Gillam J, Upthegrove R, Aldred S, Wood SJ. Role of Magnetic Resonance Spectroscopy in Cerebral Glutathione Quantification for Youth Mental Health: A Systematic Review. Early Intervention in Psychiatry (2020) 14(2):147–62. Epub 20190531. doi:10.1111/eip.12833
10. Murray AJ, Rogers JC, Katshu MZUH, Liddle PF, Upthegrove R. Oxidative Stress and the Pathophysiology and Symptom Profile of Schizophrenia Spectrum Disorders. Front Psychiatry (2021) 12:703452. Epub 20210722. doi:10.3389/fpsyt.2021.703452
11. Ekici S, Nye JA, Neill SG, Allen JW, Shu H-K, Fleischer CC. Glutamine Imaging: A New Avenue for Glioma Management. AJNR Am J Neuroradiol (2022) 43(1):11–8. Epub 20211104. doi:10.3174/ajnr.A7333
12. Chan KL, Oeltzschner G, Saleh MG, Edden RAE, Barker PB. Simultaneous Editing of GABA and GSH with Hadamard‐encoded MR Spectroscopic Imaging. Magn Reson Med (2019) 82(1):21–32. Epub 20190222. doi:10.1002/mrm.27702
13. Li Y, Jakary A, Gillung E, Eisendrath S, Nelson SJ, Mukherjee P, et al. Evaluating Metabolites in Patients with Major Depressive Disorder Who Received Mindfulness-Based Cognitive Therapy and Healthy Controls Using Short Echo Mrsi at 7 Tesla. Magn Reson Mater Phy (2016) 29(3):523–33. Epub 20160209. doi:10.1007/s10334-016-0526-7
14. Wang Q, Ren H, Li C, Li Z, Li J, Li H, et al. Metabolite Differences in the Medial Prefrontal Cortex in Schizophrenia Patients with and without Persistent Auditory Verbal Hallucinations: A 1H MRS Study. Transl Psychiatry (2022) 12(1):116. Epub 20220323. doi:10.1038/s41398-022-01866-5
15. Zhang Y, Shen J. Effects of Noise and Linewidth on In Vivo Analysis of Glutamate at 3 T. J Magn Reson (2020) 314:106732. doi:10.1016/j.jmr.2020.106732
16. Choi C, Dimitrov IE, Douglas D, Patel A, Kaiser LG, Amezcua CA, et al. Improvement of Resolution for Brain Coupled Metabolites by Optimized 1H MRS at 7 T. NMR Biomed (2010) 23(9):1044–52. doi:10.1002/Nbm.1529
17. An L, Li S, Murdoch JB, Araneta MF, Johnson C, Shen J. Detection of Glutamate, Glutamine, and Glutathione by Radiofrequency Suppression and Echo Time Optimization at 7 Tesla. Magn Reson Med (2015) 73:451–8. Epub 2014/03/04. doi:10.1002/mrm.25150
18. Clarke WT, Stagg CJ, Jbabdi S. FSL‐MRS: An End‐to‐end Spectroscopy Analysis Package. Magn Reson Med (2021) 85(6):2950–64. Epub 20201206. doi:10.1002/mrm.28630
19. Oeltzschner G, Zöllner HJ, Hui SCN, Mikkelsen M, Saleh MG, Tapper S, et al. Osprey: Open-Source Processing, Reconstruction & Estimation of Magnetic Resonance Spectroscopy Data. J Neurosci Methods (2020) 343:108827. Epub 20200627. doi:10.1016/j.jneumeth.2020.108827
20. Zhang Y, An L, Shen J. Fast Computation of Full Density Matrix of Multispin Systems for Spatially Localized In Vivo Magnetic Resonance Spectroscopy. Med Phys (2017) 44(8):4169–78. doi:10.1002/mp.12375
21. An L, Araneta MF, Johnson C, Shen J. Effects of Carrier Frequency Mismatch on Frequency-Selective Spectral Editing. Magn Reson Mater Phy (2019) 32(2):237–46. doi:10.1007/s10334-018-0717-5
22. Govindaraju V, Young K, Maudsley AA. Proton Nmr Chemical Shifts and Coupling Constants for Brain Metabolites. NMR Biomed (2000) 13(3):129–53. doi:10.1002/1099-1492(200005)13:3<129::aid-nbm619>3.0.co;2-v
23. Smith SA, Levante TO, Meier BH, Ernst RR. Computer Simulations in Magnetic Resonance. An Object-Oriented Programming Approach. J Magn Reson Ser A (1994) 106(1):75–105. doi:10.1006/jmra.1994.1008
24. Kaiser LG, Young K, Matson GB. Numerical Simulations of Localized High Field 1H MR Spectroscopy. J Magn Reson (2008) 195(1):67–75. doi:10.1016/j.jmr.2008.08.010
25. An L, Li S, Wood ET, Reich DS, Shen J. N-Acetyl-Aspartyl-Glutamate Detection in the Human Brain at 7 Tesla by Echo Time Optimization and Improved Wiener Filtering. Magn Reson Med (2014) 72(4):903–12. doi:10.1002/mrm.25007
26. Tadayonnejad R, Deshpande R, Ajilore O, Moody T, Morfini F, Ly R, et al. Pregenual Anterior Cingulate Dysfunction Associated with Depression in OCD: An Integrated Multimodal fMRI/1H MRS Study. Neuropsychopharmacol. (2018) 43(5):1146–55. Epub 20171020. doi:10.1038/npp.2017.249
27. Murdoch JB, Lent AH, Kritzer MR. Computer-optimized Narrowband Pulses for Multislice Imaging. J Magn Reson (1969) (1987) 74(2):226–63. doi:10.1016/0022-2364(87)90336-2
28. An L, Araneta MF, Johnson C, Shen J. Simultaneous Measurement of Glutamate, Glutamine, GABA , and Glutathione by Spectral Editing without Subtraction. Magn Reson Med (2018) 80(5):1776–86. doi:10.1002/mrm.27172
29. An L, van der Veen JW, Li S, Thomasson DM, Shen J. Combination of Multichannel Single-Voxel Mrs Signals Using Generalized Least Squares. J Magn Reson Imaging (2013) 37(6):1445–50. doi:10.1002/Jmri.23941
30. Klose U. In Vivo proton Spectroscopy in Presence of Eddy Currents. Magn Reson Med (1990) 14(1):26–30. doi:10.1002/mrm.1910140104
31. van der Veen JW, Marenco S, Berman KF, Shen J. Retrospective Correction of Frequency Drift in Spectral Editing: The Gaba Editing Example. NMR Biomed (2017) 30(8):e3725. doi:10.1002/nbm.3725
32. Kaiser LG, Young K, Meyerhoff DJ, Mueller SG, Matson GB. A Detailed Analysis of Localized J-Difference GABA Editing: Theoretical and Experimental Study at 4 T. NMR Biomed (2008) 21(1):22–32. doi:10.1002/nbm.1150
33. An L, Li S, Shen J. Simultaneous Determination of Metabolite Concentrations, T 1 and T 2 Relaxation Times. Magn Reson Med (2017) 78(6):2072–81. doi:10.1002/mrm.26612
34. An L, Araneta MF, Victorino M, Shen J. Signal Enhancement of Glutamine and Glutathione by Single-step Spectral Editing. J Magn Reson (2020) 316:106756. doi:10.1016/j.jmr.2020.106756
35. Lally N, An L, Banerjee D, Niciu MJ, Luckenbaugh DA, Richards EM, et al. Reliability of 7T1H-MRS Measured Human Prefrontal Cortex Glutamate, Glutamine, and Glutathione Signals Using an Adapted echo Time Optimized PRESS Sequence: A between- and Within-Sessions Investigation. J Magn Reson Imaging (2016) 43(1):88–98. doi:10.1002/jmri.24970
Keywords: glutamate, glutamine, glutathione, strong coupling, 7 Tesla
Citation: An L, Evans JW, Burton C, Tomar JS, Ferraris Araneta M, Zarate CA and Shen J (2022) Roles of Strong Scalar Couplings in Maximizing Glutamate, Glutamine and Glutathione Pseudo Singlets at 7 Tesla. Front. Phys. 10:927162. doi: 10.3389/fphy.2022.927162
Received: 23 April 2022; Accepted: 23 May 2022;
Published: 14 June 2022.
Edited by:
Federico Giove, Centro Fermi—Museo Storico della Fisica e Centro Studi e Ricerche Enrico Fermi, ItalyReviewed by:
Paul Vasos, University of Bucharest, RomaniaSalvatore Mamone, Max Planck Institute for Multidisciplinary Sciences, Germany
Copyright © 2022 An, Evans, Burton, Tomar, Ferraris Araneta, Zarate and Shen. This is an open-access article distributed under the terms of the Creative Commons Attribution License (CC BY). The use, distribution or reproduction in other forums is permitted, provided the original author(s) and the copyright owner(s) are credited and that the original publication in this journal is cited, in accordance with accepted academic practice. No use, distribution or reproduction is permitted which does not comply with these terms.
*Correspondence: Li An, bGkuYW5AbmloLmdvdg==
 Li An
Li An Jennifer W. Evans
 Courtney Burton
 Carlos A. Zarate
  Jun Shen