- 1Medical Ultrasound Imaging Center, Department of Medical Imaging, Radboud University Medical Center, Nijmegen, Netherlands
- 2Department of Oral and Maxillofacial Surgery, Radboud University Medical Center, Nijmegen, Netherlands
- 3Department of Neurology and Clinical Neurophysiology, Donders Institute for Brain, Cognition and Behavior Radboud University Medical Center, Nijmegen, Netherlands
- 4Physics of Fluids Group, University of Twente, Enschede, Netherlands
Free-hand volumetric ultrasound (FVUS) facilitates 3D US imaging of large anatomical areas. However, this method is user-dependent and image quality, especially in the scan direction (elevational direction), depends on the number of US images acquired per distance unit. This might affect clinical decision making for example in quantitative ultrasound muscle imaging. This study addresses three goals. First, to determine quantitatively below which number of acquisitions per cm (acq/cm) image quality is affected: the acquisition limit. Second, to determine the translation speed used naturally by sonographers. Third, to demonstrate in vivo possible benefits of utilizing plane wave imaging for FVUS, so-called fast FVUS in order to boost translation speed while maintaining quantitative image information. Fast FVUS enables imaging at much higher framerates and hence the acquisition limit is easier met which allows for much faster transducer translation. From an analysis of the contrast and elevational resolution in a phantom, the average acquisition limit was determined to be 33 acq/cm. Above this limit, the quantitative ultrasound information remained unchanged. This would imply that when imaging at 30 frames per second, a common frame-rate of current 2D ultrasound devices, suboptimal imaging quality is obtained above transducer translation speeds of 9.1 mm/s. The median and maximum transducer translation speed observed in 10 sonographers were 15.8 mm/s and 30.1 mm/s, thus above this limit. Finally, we presented a design of fast FVUS that enabled acquiring 200 fps, and hence, would allow imaging up to speeds of 60.6 mm/s. We demonstrated in vivo in tibialis anterior muscles that more anatomical details were visible with fast FVUS which were lost at the typical framerate. These observations support our hypothesis that fast FVUS would be an ideal method for 3D quantitative muscle ultrasound.
1 Introduction
Ultrasound (US) technology is firmly established in clinical routine. Low-cost, high usability, and high resolution make US the first-choice tool for image-guided interventions and screening for many applications. In the past years, a variety of new applications have been developed for fast and on site stageing of disease. Quantitative US is one of them and has shown to be a promising tool for diagnosis and follow up in muscle diseases [1-3].
Volumetric Ultrasound (VUS) is being developed actively since the end of the 20th century to extend the possibilities of traditional 2D US. The benefits of VUS were highlighted by several authors [4-7]. VUS improves the performance of 2D US by making the scanning procedure operator-independent and providing a complete overview of the investigated object [4, 6]. Furthermore, VUS facilitates volumetric quantitative and morphological [8] analysis and fusion with other modalities, i.e. CT or MRI, for diagnosis, surgical navigation, and treatment.
Nowadays, VUS is a well-established modality for breast screening [9, 10], cardiac imaging [11], and prenatal scanning [12, 13]. Various implementations for VUS have been developed in various ways ranging from 3D US imaging using 2D matrix arrays to free-hand ultrasound scanning with spatial tracking. Most of them were exhaustively reviewed by Mozaffari et al. [6], Prager et al. [4], and Fenster et al. [7, 14].
This work is focused on free-hand VUS (FVUS). This technology utilizes a linear array transducer which position and orientation are tracked in space. Volumetric images are reconstructed by combining 2D image information acquired for multiple scan planes according to their recorded spatial positions and orientations. Unlike the existing alternatives that utilize a transducer matrix array or a mechanized linear array, FVUS is valuable for imaging large static anatomical areas, such as musculoskeletal structures, i.e., muscles in the leg [15-17], the spine [18], bones [19], tendons [20], and nerves [21].
Notably, any conventional US machine equipped with a linear, phased, or curved transducer array can be extended to a FVUS system by enabling the US transducer’s spatial tracking. For instance, this approach is used in multiple research setups [15-17, 19, 20, 22-25], and in several commercial products, e. g. PIUR tUS and PIUR Infinity (PIUR Imaging GmbH, Vienna, Austria). All the above mentioned implementations use conventional focused imaging with an average acquisition framerate of 30 frames per second (fps). Consequently, moving the transducer too fast across the anatomical area of interest can result in gaps leading to a change in quality of the volumetric image.
In this manuscript, we propose a 3D imaging method for quantitative muscle imaging that allows high-speed free-hand acquisition of ultrasound data without compromising the echographic information in order to perform 3D quantitative muscle US (3D-QMUS). This work has three goals. First, to determine below which number of acquisitions per cm (acq/cm) the quantitative image information is affected. Second, to determine the translation speed used naturally by medical specialists. Third, to demonstrate in vivo possible benefits of utilizing plane wave imaging for FVUS, so-called fast FVUS in order to boost translation speed while maintaining quantitative image information.
The fast FVUS utilizes plane wave transmission enabling a temporal resolution improvement in the order of 100 times [26] without coherent compounding and up to 10 times with coherent compounding. We describe a design of the fast FVUS system and use it to determine at which translational speed the volumetric image quality starts deteriorating: acquisition limit. Next, we analyze how increased framerate can extend the acquisition limit and, finally, use the fast FVUS to conduct in vivo measurements of a tibialis anterior of a healthy volunteer to demonstrate the benefits of fast FVUS for clinical use.
2 Materials and methods
2.1 System design
An overview of the fast FVUS system is presented in Figure 1 and comprises a Verasonics V1 programmable US machine (Figure 1A, Verasonics, Inc., Kirkland, WA, United States) equipped with an ATL L7-4 linear array transducer (Figure 1C, Philips, Eindhoven, the Netherlands) and controlled from the Verasonics V1 control PC (Figure 1B, Intel Xeon CPU(2 × 2.40 GHz), 16 Gb RAM), a PST Base HD optical tracking system (Figure 1E, PS-tech, Amsterdam, the Netherlands), a custom-made synchronization block (Figure 1F), and a processing workstation PC (Figure 1G, Intel Xeon CPU (2 × 2.40 GHz) and 64 GB RAM). The transducer has 128 elements and an elevational focus at ∼20 mm. There were six circular optical markers (Ø 10 mm) stuck on the surface of the transducer as depicted in Figure 1D.
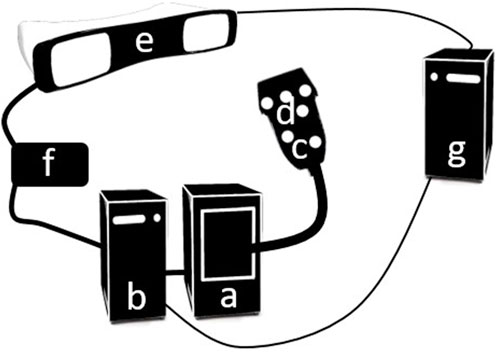
FIGURE 1. An overview of the fast FVUS system. (A) The Verasonics V1 US machine. (B) The Verasonics V1 control PC. (C) US transducer. (D) Optical marker. (E) PST optical tracking system. (F) Synchronization block. (G) Processing workstation PC.
The acquisition is mastered by the tracking system and is initiated manually from the graphical user interface (GUI) of the PST Software Suite (PS-tech, Amsterdam, the Netherlands). The synchronization module is implemented in an Arduino Uno (Arduino, Turin, Italy) and it ensures the acquisitions of the US and position data are initiated simultaneously. Therefore, no temporal calibration was needed. Specifically, the temporal synchronization between the tracking system and Verasonics V1 is described below.
In idle mode, the acquisition framerate of the optical tracking system is 30 fps and the output triggering pulse is emitted at each acquisition. The data acquired during the idle state are not stored. The Verasonics V1 is waiting for the input triggering pulse. To launch the acquisition mode, the user has to initiate data acquisition by switching the acquisition framerate to 120 fps. The switching is made through the graphical user interface (GUI) deployed on the workstation PC. The synchronization block detects the change in acquisition framerate and generates a triggering pulse for Verasonics V1 launching the US data acquisition either for 5 s at the framerate of 1000 fps or for 25 s at the framerate of 200 fps. After the acquisition, both Verasonics V1 and PST return to the idle state. The data acquired with both systems are stored in two different files on the local drive which can be accessed from the processing workstation. The file containing position data contains time stamps enabling accurate identification of the acquisition start time.
The tracking system localizes the US transducer by observing the optical markers. So, the tracking system only provides the spatial transformation of the point cloud represented by the optical markers. The spatial relation between the optical markers and the transducer array surface was deducted using a spatial calibration procedure which is described in the Spatial Calibration section.
The US system was programmed to transmit plane wave US with a central frequency of 5 MHz at a maximum framerate of 1000 fps. For each transmit, raw radiofrequency (RF) US data were stored in receive per US transducer element at a sampling frequency of 20 MHz. The acquisition time with the abovementioned settings was limited to 5 s by the available RAM installed in the Verasonics V1 workstation. The 6 degrees of freedom (DOF) position data were acquired independently with an optical tracking system by capturing the spatial location of the optical markers at 120 positions per second. The data were stored on a local drive to provide access to the acquired data from both workstations.
2.2 Post processing
A delay-and-sum (DAS) beamforming algorithm was applied to reconstruct the B-mode images from the element RF data (F-number = 0.9, apodization = 70% of a Hamming window). Next, the beam formed data were compensated for attenuation by multiplying each RF line on a frequency dependent (5 MHz) exponential attenuation function where the attenuation coefficient was selected according to the imaged material. The compensation was needed for objective performance of quantitative analysis. Finally, the envelope for each RF line was calculated.
The position data of the optical markers were recorded as six-element vectors where the first three elements represented translation, and the last three elements represented rotation. The position data were linearly interpolated on the US acquisition time points and converted into a series of transducer-to-world coordinate transformation matrixes
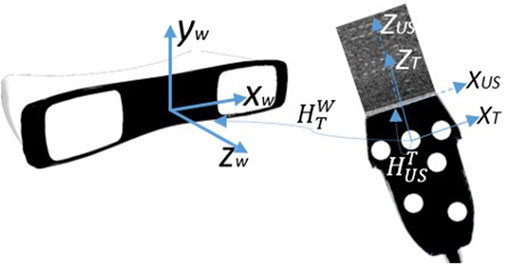
FIGURE 2. The overview of coordinate systems utilized in FVUS. There are three coordinates systems: World coordinate w system originating at the tracking system, transducer tracking system T originating at one of the optical markers, and ultrasound coordinate system US originating at the middle of the transducer array.
2.3 Spatial calibration
Spatial calibration was needed to deduct the relation between the position and orientation of the US transducer and the position of US data points. Mathematically this implies determining an operator called calibration matrix
For the designed system, we define three coordinate systems as depicted in Figure 2: the world coordinate system W, originating at the optical tracking system; the local transducer’s coordinate system T, originating at one of the optical markers; and the US coordinate system, originating at the center of the transducer array’s surface (Figure 2).
The calibration matrix was determined by utilizing measurements of an “N”-wire phantom described by Carbajal et al. [28]. The matrix was calculated to match the segmented wires in the US image with the actual crossing point between the wire and the US imaging plane (Figure 3). For the calibration purpose, we designed a custom three-layer “N”-wire phantom. The phantom consist of the box with nine wires arranged in three layers. Each layer is arranged in a shape of “N” letter. The phantom was printed with PLA material utilizing an Ultimaker 3D printer (Ultimaker, Cambridge, US) with a nozzle size of 0.4 mm. During the design, the printing accuracy was taken into consideration. The phantom has notches for optical markers and sealed holes for the wires. Thus, the positions of the wires in the world coordinate system were known.
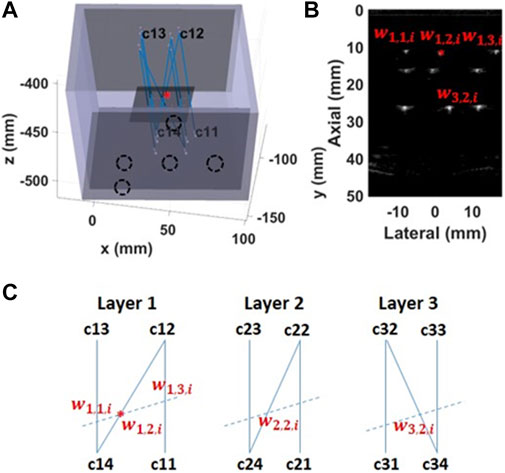
FIGURE 3. Spatial calibration using an “N”-wire phantom (A) The calibration phantom is a 3D printed box with pre-defined positions for the optical markers (black dashed circles) and sealed holes for wires (B) An US image has visible wires’ cross-sections. The middle wire was used for the calibration (red star) (C) The schematic of each wires’ layer viewed from the top of the phantom. The dashed line represents crossing of the US image with the wires’ layer.
The calibration matrix was found by minimizing the following cost-function:
where NI is the total number of acquired images (NI = 134), i is the index of the current image, L is the number of wire layers (L = 3), j is the current layer,
The calibration accuracy was quantified in terms of the root mean squared error (RMSE) where the actual and estimated points’ coordinates are described below:
where
2.4 3D reconstruction
The method for the 3D reconstruction is described in [30] with an isotropic voxel size of 0.25 mm. As described in 2.5, we perform the imaging by translating the US transducer over the region of interest. Consequently, the final volume has rectangular shape. The image pixels were transformed into a point cloud by utilizing the equation below:
where
2.5 Determining the acquisition limit
To quantify the image quality of FVUS for various scanning speeds and determine the acquisition limit, two sweeps of freehand scanning were performed using a multipurpose ATS phantom (Figure 4 top, ATS 550, ATS Laboratories, CT, United States) comprising linear wires acting as point reflectors and six cylindrical inclusions (Ø 10 mm) of different echogenicity (−15 dB, −6 dB, −3 dB, +3 dB, +6 dB, and +15 dB). The phantom data were compensated for attenuation (attenuation is 0.5 dB/MHz cm−1). Image quality was quantified in terms of resolution, and contrast- and signal-to-noise ratio’s (CNR and SNR) according to procedures described further on. Each phantom acquisition last for 5 s and was performed at the framerate of 1000 fps.
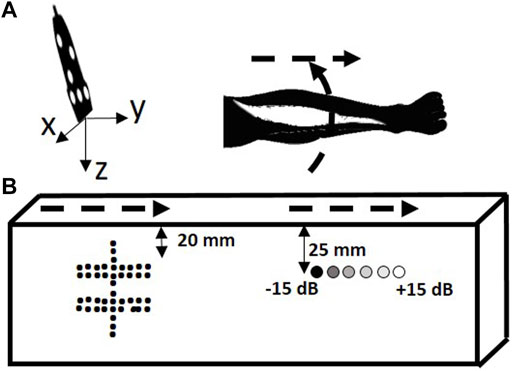
FIGURE 4. Scanning trajectory overview. (A) In the quantitative phantom. (B) In the leg of a volunteer. The scanning trajectories are depicted with dashed arrows.
To analyze the benefits of fast FVUS quantitatively, we scanned the ATS phantom by sweeping the US transducer, as shown in Figure 4. The first sweep was made above the structure composed of the wires and the acquired data were used to evaluate resolution and visibility. The second sweep was made above the cylinders with variable echogenicity and the data were used to quantitatively assess image quality by analysis of CNR and SNR. Each sweep was performed manually resulting in ununiform speed along the trajectory. The sweep speed was calculated as an average speed of all speeds measured within each sliding window (10 mm length) along the sweep trajectory.
The quantitative analysis as described below was performed for the data with mimicked different spatial acquisition rates (SAR), i.e., the number of acquired US B-mode images per cm of scanning trajectory (acq/cm). The SAR was calculated as an average number of frames counted within each sliding window (10 mm length) along the sweep trajectory.
For the data acquired at the first sweep, the various SAR were obtained by decimating the initially recorded data sets by factors of 10, 20, 50, 100, and 200 in time. For the data acquired at the second sweep, the various SAR were obtained by decimating the initially recorded data sets by factors of 10, 20, 50, 100 in time.
2.5.1 Resolution
For the fast FVUS, the resolution was quantified as the width at −6 dB of the parabola fitted in line spread function (LSF) measured in the elevational and axial directions [32]. The measurements were performed for five wires located at 20 mm distance from the phantom’s surface (Figure 4), i.e. at the elevational focus distance of the US transducer. The resolution was measured in each elevational plane (159 planes) of the reconstructed volume resulting in 795 LSFs. Nevertheless, only resolvable LSF’s were considered for measurements, i.e. the LSF is surrounded by the background which is 6 dB less than the peak of LSF. Consequently, 595, 575, 590, 550, 380, and 45 LSFs were utilized for measure resolutions at SARs of 1197 ± 386, 119 ± 38, 59 ± 19, 23 ± 7, 11 ± 3, and 5 ± 1 acq/cm respectively. The sweep speed was measured.
The t-test was applied to determine if there was a statistically significant difference (p < 0.05) in terms of the elevational and axial resolution between data acquired at the highest SAR (reference) and data acquired at other SAR values.
2.5.2 Loss of elevational details
Additionally, we quantified the image quality in terms of the visibility of the linear reflectors. The visibility was defined as the fraction of elevational frames with visible reflectors, i.e. where the LSF could be estimated:
The LSF can be estimated if the level of the reflector’s intensity differs from the background by more than 6 dB. The visibility was calculated for different SAR. To calculate the residual elevational details we used the dataset acquired for the measurement of resolution.
2.5.3 Contrast- and signal-to-noise
The image quality in the elevational plane as a function of SAR was also evaluated in terms of contrast-to-noise ratio (CNR) and signal-to-noise (SNR) ratio [33]. CNR and SNR are defined as:
and
where
Only the top half of the inclusion area was considered for the calculation to circumvent the detrimental effect of attenuation on these parameter values. SNR and CNR were determined for all SAR. The sweep speed was measured. Wilcoxon tests (sample points = 6) were applied to determine if there was a statistically significant difference in SNR and CNR between the reference data (at SAR of) and the data derived from lower SAR values.
2.5.4 Fraction of unfilled space
The fraction of unfilled space shows the percentage of the presented gaps in the acquired volume. In this work, we define the fraction of unfilled space as the ratio between the number of voxels without assigned values before the ‘hole filling’ step to the total amount of voxels within the measured volume:
This quantitative parameter was calculated for various SAR using the data set acquired for the measurement of resolution. The fraction of unfilled space was measured for a volume of 72 cm3.
2.6 Sweep speed measurement
The goal of this measurement was to understand what sweep speed is normally utilized by a clinical professional and, consequently, understand the benefits of fast FVUS in clinical routine. Herein we asked ten medical professionals with experience in muscle US imaging and different levels of expertise (7 neurologists, one radiologist, one student, and one technician) to perform three linear sweeps along the forearm of a male volunteer (29 years old).
The aim of the first sweep was to get an approximation of the intuitive speed the clinical professional uses to translate the US transducer with. Therefore, we had not provide any instructions regarding sweep speed in order not to bias the participant. Each participant had only been instructed to perform the sweep at a convenient speed.
The aim of the second sweep was to measure how accurate the clinical professional can follow the recommended low speed. Before the second sweep, each participant had been instructed to keep the sweep speed at 10 mm/s which was suggested by Weide et al. in [17].
The aim of the third sweep was to understand the speed preference of the clinical professional after he had already performed sweeps at different velocities. Before the third sweep, the participant had been again instructed to translate the transducer at a comfortable speed.
During each sweeps, each participant could observe the B-mode image, and the positions of the US transducer were captured with the PST tracking system.
The median and maximum sweep speed were calculated for each sweep performed by each participant. A Wilcoxon test (sample points = 10) was applied to determine if there was a statistically significant difference in speed between the sweep speeds.
Each participant and the volunteer signed an informed consent.
2.7 In-vivo measurements
The applicability of fast FVUS for muscle applications was tested in a male volunteer (29 years old) by imaging the tibialis anterior 2 times: first, by making a longitudinal sweep along the muscle, second, by making a radial sweep across the muscle, as shown in the bottom panEL OF Figure 4. The speed of each sweep was measured. The acquired dataset was decimated by a factor of six to mimic acquisition at a framerate of 33.3 fps. Each in vivo acquisition last for 25 s and was performed at a framerate of 200 fps. With the in vivo measurement, we also wanted to demonstrate the reliability of the fast FVUS. Therefore, we intentionally performed the sweep at slightly higher than detected comfortable speed. The speed of each sweep was measured.
The measurement protocol was approved by the local ethics committee and in accordance with the World Medical Association Declaration of Helsinki on Ethical Principles for Medical Research Involving Human Subjects.
The volunteer agreed to participate and written informed consent was obtained.
3 Results
3.1 Spatial calibration accuracy
The measured calibration accuracy was 1.1 ± 0.6 mm for 402 acquired calibration points extracted from 134 B-mode images with visible cross-sections of the calibration phantom’s wires.
3.2 Resolution
The impact of SAR on the image resolution is shown in Figure 5. The elevational and axial resolutions at SAR lower than 23 ± 7 acq/cm become significantly different from the reference (at SAR of 1197 ± 386 acq/cm). In effect, the elevational resolution worsens while axial resolution improves. SAR of 23 acq/cm corresponds to 13.0 mm/s sweep speed at 30 fps acquisition framerate. During the acquisition, the probe was translated at a speed of 7.5 ± 1.9 mm/s.
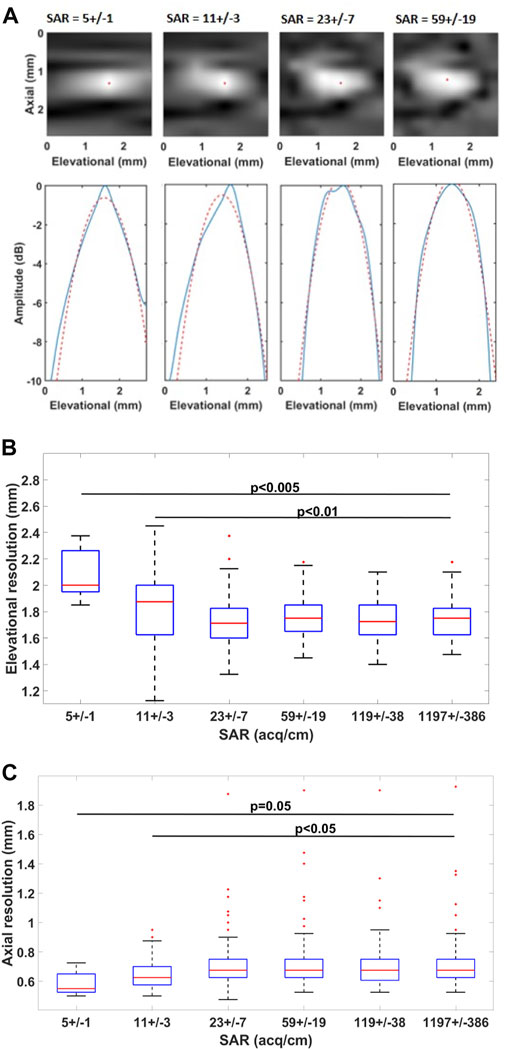
FIGURE 5. Impact of SAR on resolution ((A) top) Visualized LSF for a certain imaging plane and ((A) bottom) LSF in the elevational direction. The blue line shows the elevational LSF profile and the red dashed line shows its parabolic approximation. The red dot indicates the maximum of the LSF (B) Boxplot of the estimated resolutions in the elevational and axial (C) directions.
3.3 Loss of elevational details
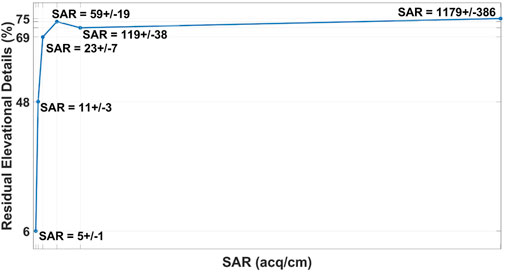
The result of the measurement is shown in Figure 6. The presence of residual elevational details does not change more than 6%, with an average SAR higher than 23 acq/cm.
3.4 Contrast- and signal-to-noise
The impact of SAR on CNR is shown in Figure 7. Compared to the high framerate data acquired for a SAR of 676 ± 227 acq/cm, the SNR and CNR significantly worsen for a SAR lower than 33 ± 11 acq/cm. The SAR of 33 acq/cm corresponds to a 9.1 mm/s sweep speed at 30 fps acquisition framerate. During the acquisition, the probe was translated with a speed of 13.4 ± 6.4 mm/s.
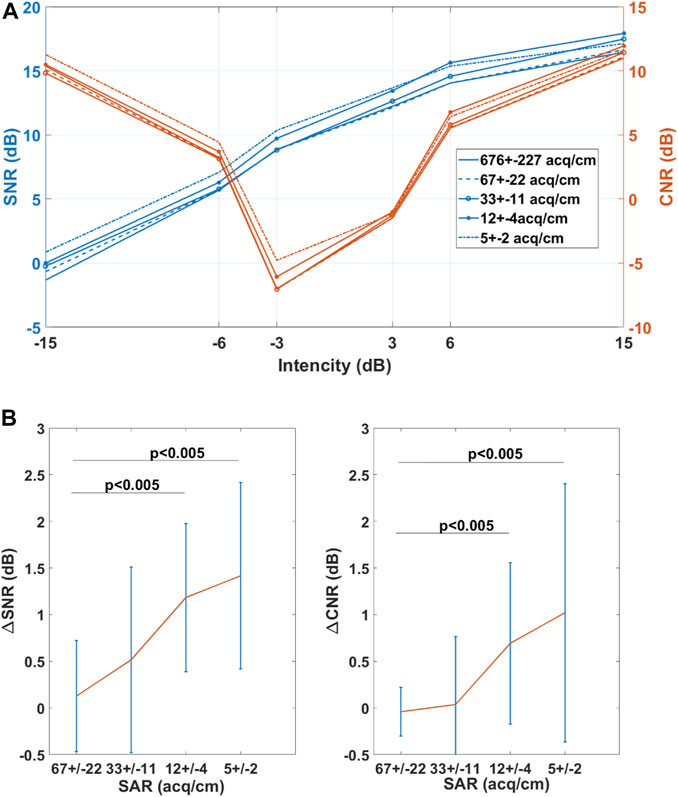
FIGURE 7. Impact of SAR on SNR and CNR (A) SNR and CNR dependency on echogenicity (B) The mean value of paired difference in SNR (∆SNRSAR=SNRSAR = 676 – SNRSAR) and CNR (∆CNRSAR=CNRSAR = 676 – CNRSAR) values. The red line represents the mean difference while the blue line indicates the 95% confidence interval.
3.5 Fraction of unfilled space
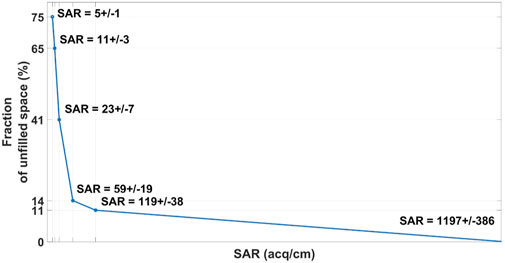
The impact of the SAR on the fraction of unfilled space is depicted in Figure 8. The fraction of unfilled space exceeds 40%, when the SAR is below 23 ± 7 acq/cm.
3.6 Sweep speed measurement
The measured median and maximum sweep speeds are presented in Figure 9. The median values for median speeds are 13.8 mm/s for the first sweep, 6.1 mm/s for the second sweep, and 15.8 mm/s for the third sweep. The median values for maximum speeds are 29.0 mm/s for the first sweep, 15.8 mm/s for the second sweep, and 30.1 mm/s for the third sweep. The median and maximum speeds at the first and third sweeps are significantly different from the second sweep. There is no significant difference between first and third sweeps speeds.
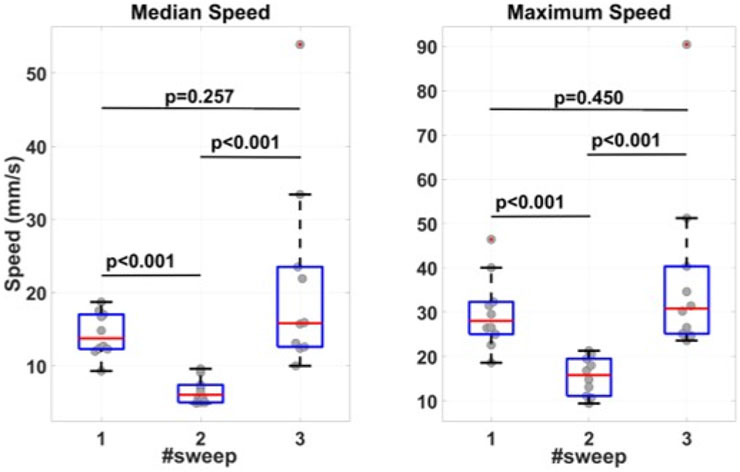
FIGURE 9. Measured median and maximum sweep speeds. Before the first sweep, the participants were told to perform the sweep at a speed convenient for the participant. Before the second sweep, the participants had been suggested to keep the sweep speed at 10 mm/s. Before the third sweep, the participants were again asked to move the transducer at a comfortable speed.
3.7 In-vivo data
The in vivo data are presented in Figures 10, 11. The mean speed of the longitudinal sweep of 38.4 ± 4.8 mm/s which corresponds to SAR of 53 acq/cm at 200 fps and SAR of nine acq/cm at 33 fps. The maximum speed of 47.3 mm/s corresponds to SAR of 42 acq/cm at 200 fps and SAR of seven acq/cm at 33 fps. The mean speed of the radial sweep of 43.4 ± 8.2 mm/s corresponds to SAR of 46 acq/cm at 200 fps, SAR of eight acq/cm at 33 fps. The maximum speed of 58.9 mm/s corresponds to SAR of 34 acq/cm at 200 fps SAR of 6 acq/cm at 33 fps.

FIGURE 10. In-vivo 3D US data of a tibialis anterior acquired with longitudinal sweep. (A) Cross-sectional image in coronal plane of the data acquired at (top) 200 fps and (bottom) 33.3 fps. (B) Cross-sectional image in sagital plane of the data acquired at (top) 200 fps and (bottom) 33.3 fps. The examples of differences between the images are indicated with white arrows.
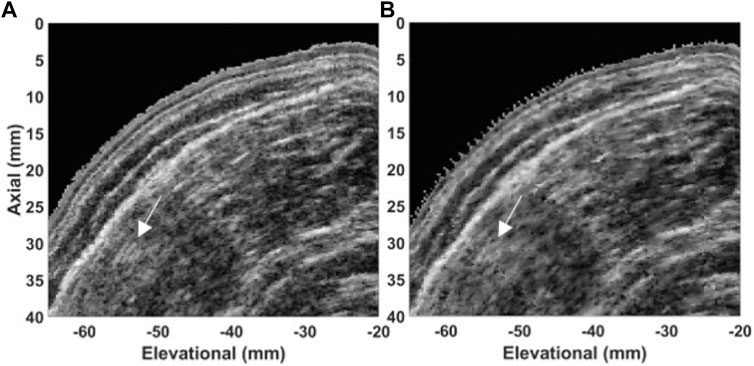
FIGURE 11. In-vivo 3D US data of a tibialis anterior acquired with a radial sweep. Cross-sectional image in transversal plane of the data acquired at (A) 200 fps and (B) 33.3 fps. The examples of differences between the images are indicated with white arrows.
We can observe the speckle pattern is better preserved in the images acquired at high framerate (200 fps). Consequently, those images retained more morphological details in comparison to the images acquired at a low framerate (33 fps). Examples of observed differences are indicated with white arrows in Figures 10, 11.
4 Discussion
In this work, we have demonstrated quantitatively the benefits of fast free-hand volumetric US imaging (FVUS). For conventional free-hand volumetric US imaging, the varying transducers speed, controlled by a sonographer can impact the image quality. With fast FVUS, we demonstrated the increased framerate can improve the performance of FVUS by increasing its usability and image quality in the elevational plane.
We found that above the acquisition limit of 33 ± 11 acq/cm, the image quality values do not change. Below this detected limit, the image quality starts significantly degrading due to insufficient spatial sampling.
The developed fast FVUS system can acquire data at 200 fps, which enables transducer translation with up to 60.6 mm/s without impact on the image quality. This speed exceeds the maximum speed used by clinical operators, and, thus, fast FVUS will enable comfortable and fast scanning of optimal quality in clinical routine.
Finally, we also demonstrated in vivo that fast FVUS can provide better image quality in the elevational plane compared to freehand imaging at the conventional framerate and retains more morphological details Figures 10, 11).
The resolution, SNR, and CNR depend on the fraction of unfilled space. For instance,from Figures 5, 8 it can be derived that the resolution worsens at a SAR less than 23 ± 7 acq/cm, which corresponds to 40.8% of unfilled space, and is significantly worse at a SAR equal to 11 ± 3 acq/cm, which corresponds to 64.6% of unfilled space. However, from Figure 5B it can be noticed that the axial resolution slightly improves at SAR lower than 23 ± 11 acq/cm. This improvement is a result of the linear interpolation used for the 3D reconstruction.
In this study, we used an US transducer with 5 MHz central frequency. The hallmarks of such a low-frequency transducer are relatively high penetration depth and a low number of transducer array elements, which enables covering sufficient area at a single plane wave transmission with moderate memory consumption. Nevertheless, the image quality within the elevational plane and resolution in the elevational direction does not substantially depend on the transducer’s frequency. However, we expect the presented approach can also be directly applied on a higher frequency transducer.
In the presented application all acquisitions were performed for zero degree transmit angle only. This implies the image quality of the current approach was worse than that for conventional imaging. However, it has been demonstrated that coherently compounded plane-wave data acquired at 11 transmission angles can deliver image quality similar to focused transmission [34, 35] at framerates which are at least 10 times higher than for conventional focused image Figure 7 shows that the CNR and SNR are significantly different from their reference values (at a SAR of 676 ± 227 acq/cm) when the SAR is less than 33 ± 11 acq/cm. Besides, in some cases, the CNR/SNR values are lower for higher SAR. The change in SNR and CNR is a result of image reconstruction and manifests the loss of morphological details. For instance, speckle pattern and morphological details such as muscle fascicles are preserved in images acquired at 200 fps framerate Figures 10, 11). This result indicates the change of the image quality at low values of SAR, which is undesirable for the quantitative image analysis.
Sweep speed measurement revealed the medical specialists translate the US transducer at a speed which is close to the detected acquisition limits. When imaging at 30 fps, translation sweep speeds of 9.1 mm/s and 13.0 mm/s are required for retaining optimal SNR, CNR, and resolution. Meantime, the measured maximum sweep speeds were more than 40% higher than the detected average limits which can result in inhomogeneously distributed image quality degradation. Finally, the speeds measured at the first and the third sweep are significantly higher that the speed at the second sweep. This result suggests the low sweep speed is not comfortable for medical professionals and, therefore, impractical in clinical routine.
By maintaining a low translating speed, it would be possible to keep the SAR above the acquisition limit. However, it was admitted by all participants that translating the transducer at a low speed over a large anatomical surface is impractical, and enabling higher speed would be beneficial for clinical routine.
At 200 fps the translation speed limit is extended to 60.6 mm/s (taking into account optimal CNR and SNR) or even 87.0 mm/s (taking into account optimal resolution) which is far beyond the measured maximum translation speed by the clinical users which was 30.1 mm/s.
Fast FVUS might be suitable for quantitative muscle US (QMUS) which has been demonstrated to be a promising diagnostic and follow-up tool. In QMUS, the main measured parameter is echo intensity (EI) which depends on the image quality [1-3]. Acquisition with the fast FVUS can guarantee the image quality values are not impacted by the insufficient acquired data and might lead to more accurate and robust quantitative analysis.
The fast FVUS system presented in our work is based on a research US system. However, the basic concepts for clinical US scanners are similar and consequently the main findings will also apply these scanners. The next step will be to apply it on clinical scanners.
5 Conclusion
In this work we demonstrated an acquisition limit in terms of acquisitions per cm exists for free-hand volumetric US. Below this limit, which average was 33 acq/cm, both the image quality in plane as well as in the elevational direction start degrading which we demonstrated in a multipurpose phantom and in vivo. Furthermore, we found that sonographers often translate the US transducer at speeds which cause the number of acquisitions per cm to be less than above the detected acquisition limit when considering a typical framerate of ∼30 Hz of current focused ultrasound scanners. Consequently, with conventional freehand ultrasound scanning suboptimal image quality is obtained which can be highly undesirable especially for applications such as 3D quantitative muscle ultrasound as it might affect clinical diagnosis. This issue can be overcome by introducing plane wave-based free-hand scanning which, as we demonstrated, facilitates scanning at much higher transducer translation speeds without loss of image quality.
Data availability statement
The raw data supporting the conclusions of this article will be made available by the authors, without undue reservation.
Ethics statement
The studies involving human participants were reviewed and approved by Board of Directors of Radboudumc. The patients/participants provided their written informed consent to participate in this study.
Author contributions
Study design, experimental work, data processing, interpretation of data, and writing, AN; study design, interpretation of data, manuscript writing and review, RH; Equipment support, TM; study support and manuscript review, NA; study design, interpretation of data, and manuscript writing and review, CK. All Authors have read the manuscript and agreed to the published version of the manuscript.
Funding
The conducted study was funded by European Union’s Horizon 2020 Research and Innovation Program (Ultrasound Robotic Assisted Biopsy (MURAB) Project, Grant Number: 688188).
Acknowledgments
The authors would like to acknowledge dr. MD. Mariolina Bruno for her assistance during in vivo measurements.
Conflict of interest
The authors declare that the research was conducted in the absence of any commercial or financial relationships that could be construed as a potential conflict of interest.
Publisher’s note
All claims expressed in this article are solely those of the authors and do not necessarily represent those of their affiliated organizations, or those of the publisher, the editors and the reviewers. Any product that may be evaluated in this article, or claim that may be made by its manufacturer, is not guaranteed or endorsed by the publisher.
References
1. Alfen NV, Gilhuis HJ, Keijzers JP, Pillen S, Van Dijk JP. Quantitative facial muscle ultrasound: Feasibility and reproducibility. Muscle Nerve (2013) 48(3):375–80. doi:10.1002/mus.23769
2. Jansen M, van Alfen N, Nijhuis van der Sanden MWG, van Dijk JP, Pillen S, de Groot IJM. Quantitative muscle ultrasound is a promising longitudinal follow-up tool in Duchenne muscular dystrophy. Neuroscular orders (2012) 22(4):306–17. doi:10.1016/j.nmd.2011.10.020
3. de Jong L, Nikolaev A, Greco A, Weijers G, de Korte CL, Fütterer JJ. Three-dimensional quantitative muscle ultrasound in a healthy population. Muscle & nerve (2021) 64(2):199–205. doi:10.1002/mus.27330
4. Prager RW, Ijaz UZ, Gee AH, Treece GM. Three-dimensional ultrasound imaging. Proc Inst Mech Eng H (2010) 224(2):193–223. doi:10.1243/09544119jeim586
5. Fenster A, Downey DB. 3-D ultrasound imaging: a review. IEEE Eng Med Biol Mag (1996) 15(6):41–51. doi:10.1109/51.544511
6. Mozaffari MH, Lee WS. Freehand 3-D ultrasound imaging: A systematic review. Ultrasound Me Biol. (2017) 43:2099–124. doi:10.1016/j.ultrasmedbio.2017.06.009
7. Fenster A, Parraga G, Bax J. Three-dimensional ultrasound scanning. erface Focus (2011) 1(4):503–19. doi:10.1098/rsfs.2011.0019
8. Singh S, Pan C, Wood R, Yeh C-R, Yeh S, Sha K, et al. Quantitative volumetric imaging of normal, neoplastic and hyperplastic mouse prostate using ultrasound. BMC Urol (2015) 15:97. doi:10.1186/s12894-015-0091-9
9. Farrokh A, Erdönmez H, Schäfer F, Maass N. Sofia: A novel automated breast ultrasound system used on patients in the prone position: A pilot study on lesion detection in comparison to handheld grayscale ultrasound. Geburtshilfe Frauenheilkd (2018) 78(5):499–505. doi:10.1055/a-0600-2279
10. Wojcinski S, Farrokh A, Hille U, Wiskirchen J, Gyapong S, Soliman AA, et al. The automated breast volume scanner (ABVS): Initial experiences in lesion detection compared with conventional handheld B-mode ultrasound: a pilot study of 50 cases. Int J Womens Health (2011) 3:337–46. doi:10.2147/ijwh.s23918
11. Lang RM, Addetia K, Narang A, Mor-Avi V. 3-Dimensional echocardiography: Latest developments and future directions. JACC: Cardscular Imaging (2018) 11(12):1854–78. doi:10.1016/j.jcmg.2018.06.024
12. Huang Q, Zeng Z. A review on real-time 3D ultrasound imaging technologmedBioMseartional (2017) 2017:1–20. doi:10.1155/2017/6027029
13. Bonilla-Musoles F, Raga F, Osborne NG, Bonilla F, Caballero O, Climent MT, et al. Multimodality 3-dimensional volumetric ultrasound in obstetrics and gynecology with an emphasis in HDlive technique. Ultrasrterly (2013) 29(3):189–201. doi:10.1097/ruq.0b013e31829a582b
14. Fenster A, Downey DB, Cardinal HN. Three-dimensional ultrasound imaging. Phys Med Biol (2001) 46(5):R67–R99. doi:10.1088/0031-9155/46/5/201
15. MacGillivray TJ, Ross E, Simpson HA, Greig CA. 3D freehand ultrasound for in vivo determination of human skeletal muscle volume. Ultrasound Med Biol (2009) 35(6):928–35. doi:10.1016/j.ultrasmedbio.2008.11.013
16. Barber L, BarrettFau - Lichtwark RG, Lichtwark G. Validation of a freehand 3D ultrasound system for morphological measures of the medial gastrocnemius muscle. J Bomech. (2009) 42:1313–9. doi:10.1016/j.jbiomech.2009.03.005
17. Weide G, van der Zwaard S, Huijing PA, Jaspers RT, Harlaar J. 3D ultrasound imaging: Fast and cost-effective morphometry of musculoskeletal tissue. J Vis Exp (2017) 129:55943. doi:10.3791/55943
18. Purnama KE, Wilkinson MHF, Veldhuizen AG, van Ooijen PMA, Lubbers J, Burgerhof JGM, et al. A framework for human spine imaging using a freehand 3D ultrasound system. Technol Health Care (2010) 18:1–17. doi:10.3233/thc-2010-0565
19. Passmore E, Pandy MG, Graham HK, Sangeux M. Measuring femoral torsion in vivo using freehand 3-D ultrasound imaging. Ultrasound Me Biol. (2016) 42(2):619–23. doi:10.1016/j.ultrasmedbio.2015.10.014
20. Obst SJ, Newsham-West R, Barrett RS. In vivo measurement of human achilles tendon morphology using freehand 3-D ultrasound. Ultrasound Me Biol. (2014) 40(1):62–70. doi:10.1016/j.ultrasmedbio.2013.08.009
21. Pelz JO, Busch M, Weinreich A, Saur D, Weise D. Evaluation of freehand high-resolution 3-dimensional ultrasound of the median nerve. Muscle Nerve (2017) 55(2):206–12. doi:10.1002/mus.25241
22. Prager RW, Gee A, Berman L. Stradx: real-time acquisition and visualization of freehand three-dimensional ultrasound. Med Image Anal (1999) 3(2):129–40. doi:10.1016/s1361-8415(99)80003-6
23. Cash C, Treece G, Berman L, Gee AH, Prager R. 3D reconstruction of the skeletal anatomy of the normal neonatal foot using 3D ultrasound. Br J Radiol (2005) 78:587–95. doi:10.1259/bjr/29830482
24. Chung S-W, Shih C-C, Huang C-C. Freehand three-dimensional ultrasound imaging of carotid artery using motion tracking technology. Ultrasonics (2017) 74:11–20. doi:10.1016/j.ultras.2016.09.020
25. Yu H, Pattichis MS, Agurto C, Beth Goens M. A 3D freehand ultrasound system for multi-view reconstructions from sparse 2D scanning planes. Biomed Eng Online (2011) 10:7. doi:10.1186/1475-925x-10-7
26. Demi L. Practical guide to ultrasound beam forming: Beam pattern and image reconstruction analysis. Appl Sci (Basel) (2018) 8(9):1544. doi:10.3390/app8091544
27. Mercier L, Lango T, Lindseth F, Collins LD. A review of calibration techniques for freehand 3-D ultrasound systems. Ultrasound Med Biol (2005) 31(2):449–71. doi:10.1016/j.ultrasmedbio.2004.11.015
28. Carbajal G, Lasso A, Gómez Á, Fichtinger G. Improving N-wire phantom-based freehand ultrasound calibration. Int J Comput Assist Radiol Surg (2013) 8(6):1063–72. doi:10.1007/s11548-013-0904-9
29. Prager RW, Rohling RN, Gee AH, Berman L. Rapid calibration for 3-D freehand ultrasound. Ultrand dine iology (1998) 24(6):855–69. doi:10.1016/s0301-5629(98)00044-1
30. Nikolaev AV, Jong Ld, Weijers G, Groenhuis V, Mann RM, Siepel FJ, et al. Quantitative evaluation of an automated cone-based breast ultrasound scanner for MRI–3D US image fusion. IEEE Trans Med Imaging (2021) 40(4):1229–39. doi:10.1109/tmi.2021.3050525
31. Solberg OV, Lindseth F, Torp H, Blake RE, Nagelhus Hernes TA. Freehand 3D ultrasound reconstruction algorithms--a review. Ultrasound Med Biol (2007) 33(7):991–1009. doi:10.1016/j.ultrasmedbio.2007.02.015
32. Thijssen JM, Weijers G, de Korte CL. Objective performance testing and quality assurance of medical ultrasound equipment. Ultrasound Med Biol (2007) 33(3):460–71. doi:10.1016/j.ultrasmedbio.2006.09.006
33. van Wijk MC, Thijssen JM. Performance testing of medical ultrasound equipment: fundamental vs. harmonic mode. Ultrasonics (2002) 40(1-8):585–91. doi:10.1016/s0041-624x(02)00177-4
34. Hendriks G, Weijers G, Chen C, Hertel M, Lee C-Y, Dueppenbecker P, et al. Ultrasound coherent plane-wave compound imaging: Image quality evaluation in phantoms and breast lesions.of the sticoty of America (2021) 150(4):A88–A. doi:10.1121/10.0007719
Keywords: 3D US, quantitative US, muscle imaging, free-hand ultrasound, plane-wave imaging
Citation: Nikolaev AV, Hansen HHG, Maal TJJ, van Alfen N and de Korte CL (2022) Quantitative evaluation of fast free-hand volumetric ultrasound. Front. Phys. 10:926006. doi: 10.3389/fphy.2022.926006
Received: 22 April 2022; Accepted: 20 July 2022;
Published: 23 August 2022.
Edited by:
Hideyuki Hasegawa, University of Toyama, JapanCopyright © 2022 Nikolaev, Hansen, Maal, van Alfen and de Korte. This is an open-access article distributed under the terms of the Creative Commons Attribution License (CC BY). The use, distribution or reproduction in other forums is permitted, provided the original author(s) and the copyright owner(s) are credited and that the original publication in this journal is cited, in accordance with accepted academic practice. No use, distribution or reproduction is permitted which does not comply with these terms.
*Correspondence: Anton V. Nikolaev, YW50b24ubmlrb2xhZXZAcmFkYm91ZHVtYy5ubA==
 Anton V. Nikolaev
 Hendrik H. G. Hansen1
 Nens van Alfen
 Chris L. de Korte