 Wei Gong
 Lijun You1
95% of researchers rate our articles as excellent or good
Learn more about the work of our research integrity team to safeguard the quality of each article we publish.
Find out more
ORIGINAL RESEARCH article
Front. Phys. , 10 August 2022
Sec. Interdisciplinary Physics
Volume 10 - 2022 | https://doi.org/10.3389/fphy.2022.923762
This article is part of the Research Topic Multiphase Flow Behavior in the Deep-Stratum and Deep-Water Wellbores View all 13 articles
The permeability jail refers to a specific water saturation range in a tight gas reservoir, where almost no gas or water phase can flow effectively. In the process of drilling and fracturing, water saturation rises and falls into the permeability jail. To reduce or avoid falling into the permeability jail in the recovery process, a method for measuring gas–water relative permeability of tight sandstone is established here that considers salt sensitivity, gas slippage effect, stress sensitivity, and high bound water saturation. Then, the permeability jail range was determined to provide guidance and suggestions for field application. Considering a typical tight sandstone as an example, the proposed method was used to expand the measurement range of gas–water relative permeability and observe the permeability jail range, laying an experimental foundation for accurately determining the permeability jail range in a given formation. The Byrnes model can preliminarily predict the permeability jail range with accurate bound water saturation and residual gas saturation. When the permeability jail phenomenon occurs in the core, the larger the permeability is, the smaller the permeability jail range will be; and the larger the porosity is, the smaller the permeability jail range will be. When the permeability jail phenomenon occurs in the tight sandstone reservoir, the damage to the reservoir due to external fluid and solid phased particles should be strictly controlled. The damage is stronger, the permeability and porosity decline, and the permeability jail range is wider. Other gases or solvents can be used as fracturing fluids to minimize formation damage.
The permeability jail refers to the condition when gas and water phases almost cannot flow in some water saturation region, and the region is named as the permeability jail range [1, 2]. Tight gas reservoirs are characterized by low permeability and ultra-low water saturation [3]. During drilling and fracturing, water-based fluids enter the reservoir, resulting in a rise in water saturation into the permeability jail due to high water injection and low flow back rate near the wellbore [2, 4, 5]. To reduce or avoid encountering the permeability jail during development, it is necessary to accurately locate the permeability jail range in the gas–water relative permeability.
In 1992, the permeability jail was first described in the Mesaverde tight sandstone of the Eastern Green River Basin, United States [2, 6]. Cluff and Byrnes summarized the characteristics of phase permeability curves of 43 tight cores and suggested that when the permeability is below 0.05 mD, a permeability jail exists in tight cores [2]. Aguilera et al. reported that the gas and water relative permeability in the permeability jail range was less than 0.02 [2, 6, 7]. Fu et al., Silin et al., and Jeannin et al. also observed the permeability jail in the phase permeability experiments of tight sandstone gas reservoirs [8–10]. If fluids are trapped in a permeability jail, it reduces the fracturing effectiveness and production capacity [1]. Thus, the basic and essential aspects indicate that gas well production should be investigated, considering the permeability jail characteristics to reduce economic losses. However, fundamental investigation of the determination of the range of permeability jail involves the relative permeability measurement.
However, numerous influencing factors in relative permeability measurement, such as stress sensitivity, salt sensitivity, gas slippage effect, and low water saturation, are involved in the experiment [1, 11, 12]. High stress reduces the gas–water flow channels (Figure 1A). Measurements of relative permeability are usually made at lower confining pressures. Due to stress sensitivity, the relative permeability at constant confining pressure may differ from that at native stress [13–15]. Li reported that as the effective stress increased, the relative permeability of the gas decreased significantly. When the confining pressure was increased to 34 MPa (5, 511 psi), the porosity of the tight sandstone formation decreased by 5%, resulting in a decrease in permeability [11]. Hao Zhang found that core permeability decreased with increased confining pressure until the critical pressure was reached. Beyond the critical pressure, the core permeability changed only slightly with the increase in confining pressure. In order to attain almost similar formation pressure conditions, it is necessary to conduct gas–water relative permeability experiments under the in situ stress conditions [8, 11].
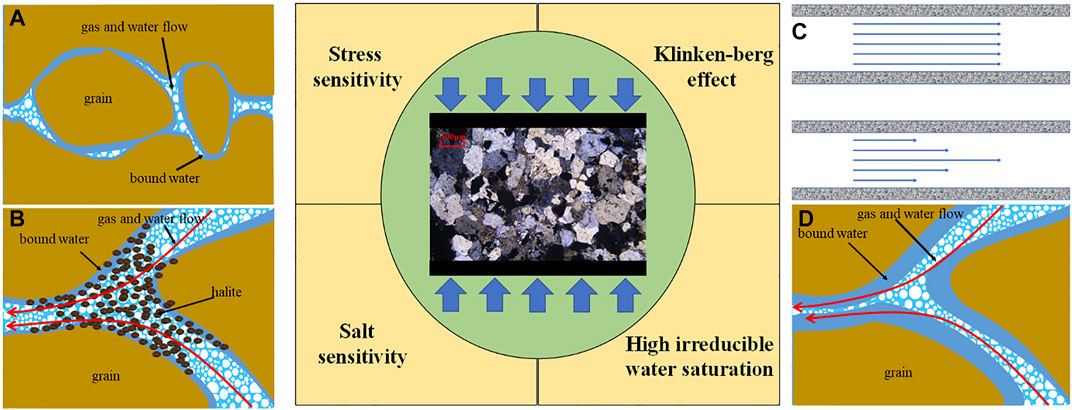
FIGURE 1. Four factors affecting the gas–water relative permeability. (A) High stress reduces the gas-water flow channels. (B) Salt minerals dissolve and migrate so that salt crystals clog the pores. (C) Gas slippage effect results in poor accuracy of the gas relative permeability. (D) Difficulty in establishing low bound water saturation.
Salt minerals dissolve and migrate, and as a result, salt crystals clog the pores (Figure 1B). The permeability of tight sandstone is affected by the salinity of liquid in the pores [12]. As the burial depth of tight sandstone increases, the salinity of formation water increases; moreover, the salt sensitivity of tight sandstone also increases [8]. When a low-salinity fluid enters the reservoir, it leads to hydration, expansion, dispersion, and migration of clay minerals, thus blocking the pores and throats [3, 12]. The high-salinity fluid that enters the reservoir also reduces the formation permeability because of the crystallization of the salinity fluid in the pore throats [16, 17]. Irrespective of the fluid salinity (high-salinity or low-salinity) that enters the sandstone, permeability decreases, and the influence of the salt content of the displacement fluid on the permeability becomes obvious [16, 18]. During the process of gas–water relative permeability experiments, if the formation water or any fluid other than the simulated formation water is used in the experiments, the gas–water relative permeability gets affected by salt sensitivity, resulting in deviations from the actual gas–water relative permeability [17]. Therefore, residual salt in dry rock samples must be removed in advance to prevent it from dissolving during the experiments, which leads to an increase in the salinity of the displacement fluid, thus leading to a reduction in the reliability of the relative permeability data. The method described in the Chinese Petroleum Industry Standard (SY/T 5336-2006, Practices for core analysis) [19] is suitable for a conventional core to wash off the salt. However, tight sandstone has narrow pores and high capillary pressure, making it difficult for fluid to enter the pore throats of a tight sandstone. Therefore, residual salts need to be washed away without damaging the internal structure of the core, and formation water is used in subsequent experiments to establish water saturation. Notably, only when the simulated formation water displaces the core, its properties do not undergo any change.
The gas slippage effect results in poor accuracy of gas relative permeability (Figure 1C). Water saturation affects the gas slippage, which in turn affects the relative permeability of gas [11, 20]. The conventional measurement methods for gas–water relative permeability do not consider the gas slippage effect; therefore, the reliability of the relative permeability measurement method decreases [2, 6]. Klinkenberg discovered that the effect of gas flow occurred through capillary channels. To avoid the gas slippage effect, gas permeability is usually measured at different flooding pressures to obtain Klinkenberg permeability [21]. However, using this method for different water saturation conditions is time-consuming. During the gas drive experiment for a prolonged time, water evaporation leads to a change in the salinity of pore water, which further affects the measurement of permeability. Undeniably, more systematic explorations are required to eliminate the gas slippage effect without affecting the experiments and speed up the experimental process.
Difficulty is encountered in establishing the low bound water saturation, as presented in Figure 1D. Most of the gas reservoirs in western Canada and the United States have a low initial water saturation, high irreducible water saturation, and low permeability [20]. It is difficult to reduce the water saturation in the gas drive experiments for a tight core saturated with water. Moreover, relative permeability measurement is not ideal [15]. With the increase in displacement pressure and time, the gas drive process fails to keep the water saturation lower than the bound water saturation, and therefore, it becomes difficult to measure the relative permeability of the gas phase at the stage of low water saturation [21]. Prediction of water saturation through centrifugation or drying destroys the pore structure of sandstone and affects the accuracy of the measurement of gas–water relative permeability [1, 3]. Traditional gas drive experiments cannot reduce the water saturation of tight cores below the bound water saturation [3]. Therefore, under the condition of low water saturation, it is essential to select an appropriate method to measure the relative permeability of gas.
According to previous research findings noted earlier, it is difficult for researchers to measure the gas–water relative permeability when the water saturation is lower than the bound water saturation [15]. The effects of various factors such as salt sensitivity [12, 16], stress sensitivity [13, 15], and gas slippage effect were ignored [11, 20, 21]. Based on this, a gas–water phase seepage model was established to calculate the theoretical range of the permeability jail, which aided in the determination of the prediction range of the permeability jail. However, experimental methods to determine the range of gas–water phase permeability are still lacking. Progress in the measurement range of gas–water phase permeability and more accurate experimental data has been significantly impeded.
Therefore, in this study, the influence of stress sensitivity (Figure 1A) and salt sensitivity (Figure 1B) on the permeability of rock samples, gas slippage effect in the process of measuring gas-phase relative permeability (Figure 1C), and the narrow measurement range of gas-water relative permeability (Figure 1D) was considered to establish a complete set of methods for determining the permeability jail range. A measurement method for gas-water relative permeability of tight gas reservoirs is established. First, the residual salt in the core was washed away using saturated ethanol. Simulating spontaneous imbibition of formation water was used to gradually improve the water saturation of a tight sandstone core. Appropriate confining pressure was selected, and applying back pressure weakened the influence of gas slippage on permeability. This study compared the measurement range of gas–water relative permeability corresponding to different water saturation establishment methods, the difference in gas-phase relative permeability under different back pressures, and the range of gas–water relative permeability under different back pressures. The study provides an experimental basis for determining the permeability jail range and has important guiding significance for the rational and practical development of tight sandstone gas reservoirs.
The experimental samples were selected from the Permian He 8 section and Shan 1 section tight sandstone gas reservoir from the Ordos Basin, China. The gas reservoir lithology is mainly coarse quartz sandstone, lithic quartz sandstone, and lithic sandstone. The average porosity and permeability of the samples were 7.81% and 0.37 mD, respectively. Ultra-low water saturation existed, with some reservoirs having initial water saturation below 20% (Figure 2). Moreover, the bound water saturation was within the range of 32.6–66.98%. The native stress was 25 MPa. The quartz content was generally 60–90%, whereas the feldspar content was very little. The content of cuttings was mainly within the range of 10–40% and consisted mainly of quartz cuttings. The main diagenetic minerals were quartz and clay minerals, including needle-like filamentous illite, chlorite, and interbedded minerals. Furthermore, a part of the reservoir contained Shumen kaolinite.
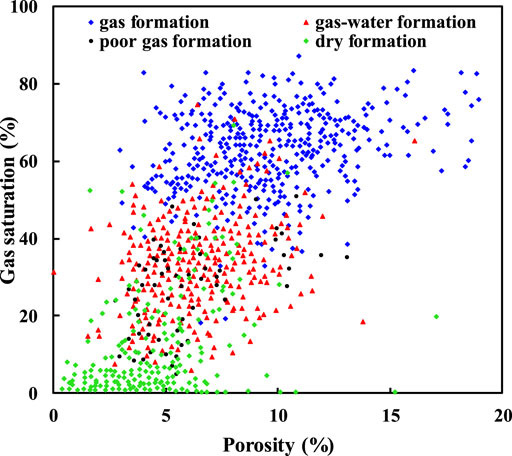
FIGURE 2. Relationship between the gas saturation and porosity in the study area. Initial gas saturation of gas formation ranges from 15% to 85%. Initial gas saturation of gas–water formation ranges from 28% to 45%. Initial gas saturation of poor formation ranges from 7% to 75%. Initial gas saturation of dry formation ranges from 0% to 70%.
This tight sandstone from the Ordos Basin in central and western China was selected for the following reasons: (1) it is characterized by deep burial, low permeability, and low porosity; (2) it has a large initial water saturation span, whereas the bound water saturation is larger than the initial water saturation; and (3) the measurement of gas–water relative permeability is difficult for the tight sandstone.
The composition of the formation water in the study area has a total salinity of 66,166.01 mg L−1 (as shown in Table 1). Table 2 presents the rock properties (length, diameter, initial permeability, and porosity) of the tight sandstone cores from the Ordos Basin.

TABLE 1. Composition of the formation water.
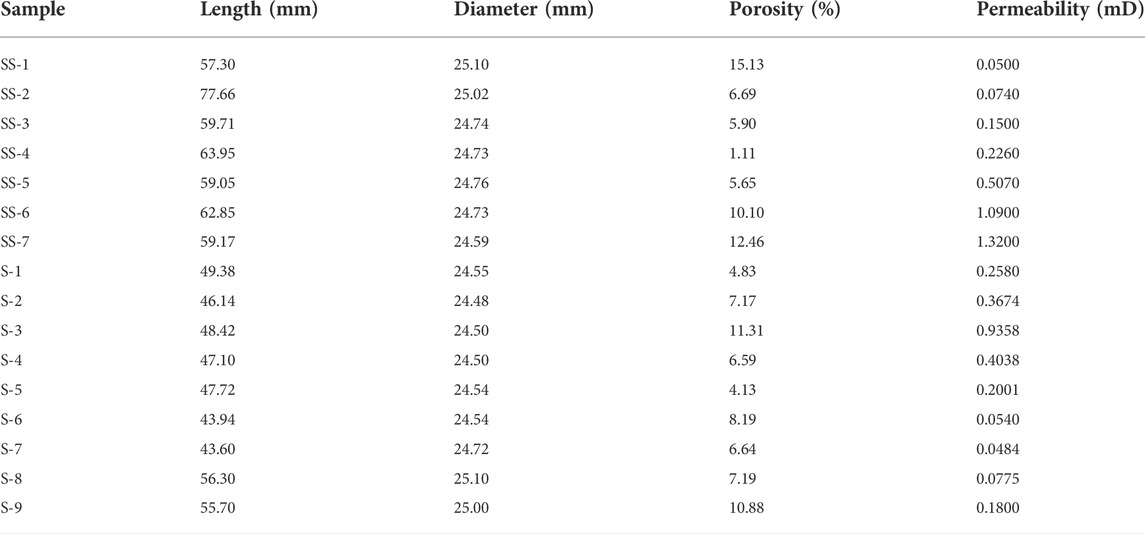
TABLE 2. Core basic parameters.
Before the test for relative permeability measurements, initial water saturation was set up by the spontaneous imbibition method. After every relative permeability measurement, the water saturation by the spontaneous imbibition method was improved, and the next relative permeability was measured.
At the beginning of the experiments, it was required to clean the fresh samples to reduce the sensitivity toward salinity. A common method for cleaning fresh samples is the Soxhlet extraction method [19]. However, cleaning tight samples using continuous immersion Soxhlets (Soxhlet extraction) is not feasible because the fluid cannot enter the pores. In this study, the salt and oil in the core were washed away entirely by conducting repeated pressurization to 25 MPa (pore pressure) with methyl alcohol and decompression to thoroughly wash off the salt and oil in the cores. This process was carried out to reduce the influence of residual salts on the experimental evaluation.
The water saturation of the tight sandstone reservoir was established by the spontaneous imbibition method. The method can set the water saturation at a specific value to realize the measurement of gas-water relative permeability. The experimental procedure is as follows.
(1) First, pre-treated cores were dried at 60°C for 2–4 h. Then, the core was taken out and cooled down to room temperature. An accurate measurement of rock pore volume was conducted. Porosity φ and dry weight Mo of the sample were then determined.
(2) Initial water saturation of core Sw was determined according to reservoir data.
(3) The fiber or paper towel was soaked with simulated formation water in advance. The experimental core was rolled back and forth on the fiber or paper towel to ensure that the end face of the core was not soaked. The simulated formation water was allowed to self-imbibe in the core under the capillary force of the experimental core itself (the simulated formation water was configured to stand for 24 h before filtration).
(4) The core weight Moˊ was monitored. Step 3 was repeated until the difference between the two weighing times met the conditions given by Eq. 1 as follows:
where Mo and Moˊ are the weight of dry and saturated rock samples (g), respectively, ρw is the formation water density (g cm−3), Sw is the corresponding water saturation (%), and φ denotes the porosity of the core (%).
(5) The core with the initial water saturation was sealed and stored in a cool place for 24 h, for the uniform distribution of the established water saturation under the action of capillary force.
(6) If it was required to improve water saturation, steps (2–5) were repeated.
The outlet pressure was set at a fixed back pressure up to the limit pressure to eliminate the effect of gas slippage. The limit pressure test was carried out on the sample to obtain its value [22]. The equipment to measure liquid flow rate was designed and assembled (Figure 3). Gas–water relative permeability measurement steps are as follows.
(1) Initial water saturation was established by the spontaneous imbibition method according to porosity.
(2) The sample was installed in the core support. The confining pressure was the formation pressure Pf. The back pressure was the limit pressure Pl, whereas the gas flow rate Qg and liquid flow rate Qw were measured after the flow stabilized. According to Eqs.2–5, the effective permeability of the gas phase Kg and liquid phase Kw and relative permeability were calculated.
(3) The next level of water saturation Swi of the test sample was established by the spontaneous imbibition method.
(4) Steps (2–3) were repeated until the water saturation (core wet weight) could not be increased any further.
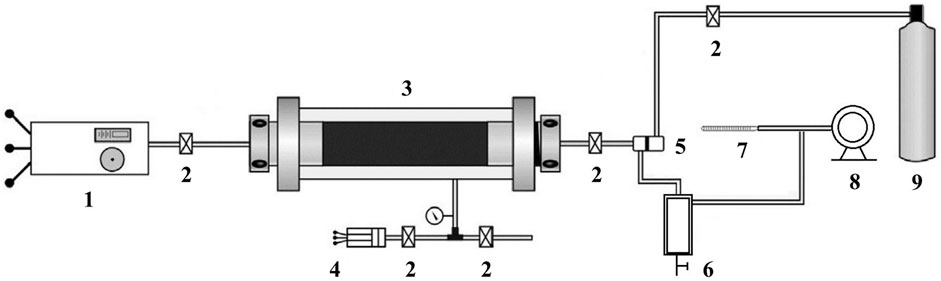
FIGURE 3. Schematic representation of the experimental apparatus. 1-pump, 2-valve, 3-core holder, 4-confining pressure system, 5-back pressure valve, 6-glass gas-water separator, 7-glass tube flow meter,8- wet gas flow meter, and 9-gas cylinder.
The effective permeability of water is given by Eq. 2.
The effective permeability of the gas is given by Eq. 3.
The relative permeabilities of gas and water phases are given by Eqs 4 and 5, respectively.
where Po is the atmospheric pressure (0.1 MPa), μw and μg are the viscosities of the formation water and nitrogen (mPa∙s), respectively, ρ is the formation water density (g cm−3), L is the core length (cm), A is the cross-sectional area of the core (cm2), Qg and Qw denote the volumetric flow rates of gas and water (cm3 s−1), respectively, and P1 and P2 are the upstream and downstream pressures of core (MPa), respectively. In contrast, the displacement pressure difference is given by ∆P=P1-P2. Moreover, Kg and Kw are the effective permeabilities of gas and formation water (mD), respectively, K is the absolute permeability of rock sample (mD), and Krg and Krw are the gas phase and water phase relative permeabilities, respectively.
There are two types of methods to establish water saturation. One is to displace the wetting phase with the non-wetting phase, which generates a conventional/drainage relative permeability curve, such as the drying method [1] (reduce water saturation by drying at 60°C in an oven) and centrifugation method [3] (reduce water saturation by centrifuging at different rotation speeds in a centrifugal machine). Another is to displace the non-wetting with the wetting phase, such as the gas drive method [3] (establish water saturation by replacing core water with gas) and the spontaneous imbibition method, which generates an imbibition relative permeability curve.
In order to prove the uniqueness and novelty of the proposed method in this study, three groups of experiments were carried out to evaluate water saturation. These tests include the relative permeability test (S-1) for the continuous decrease in initial water saturation determined by the gas drive method, the relative permeability test (S-2) for the continuous increase in water saturation measured by the spontaneous imbibition method, and the relative permeability test (S-3) for the continuous decrease in water saturation determined by the centrifugation method.
Figure 4 shows that the gas–water relative permeability curve range given by Mo et al. was small (65% < Sw (water saturation) < 80%) [1], whereas the gas–water relative permeability curve range corresponding to the gas drive method was medium (49% < Sw < 90%). Furthermore, the gas–water relative permeability curve range corresponding to the spontaneous imbibition method was large (15.26% < Sw < 79%) and that corresponding to the centrifugation method also exhibited a large range (17.17% < Sw < 85%).
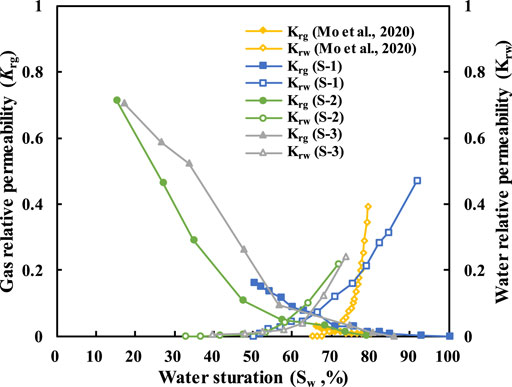
FIGURE 4. Four sets of relative permeability curves (the gas–water relative permeability curve range of S-1 sample and that provided by Mo et al. were lower than the gas–water relative permeability curve range of S-2 and S-3).
The gas–water relative permeability curves of water saturation established by different methods are compared. The shape of the gas–water relative permeability curve established by the spontaneous imbibition method was similar to that of the traditional gas–water relative permeability curve; however, the relationship between the gas–phase relative permeability curve and the water saturation in the measurement process of the centrifugation method was closer to a linear relationship (Figure 4). Only the gas–water relative permeability above the bound water saturation could be measured in the gas drive experiment. The spontaneous imbibition method used in this study showed a wide measurement range; therefore, a relatively complete gas–water phase permeability curve was obtained (Figure 4).
In order to measure the relative permeability of the gas phase in the actual production process, it is necessary to measure the relative permeability of the gas phase in the case of a continuous increase in water saturation. At the same time, the drying and centrifugation methods are used to measure the relative permeability of the gas phase in the continuous decrease of water saturation. Moreover, the establishment of initial water saturation by the drying method results in some residual salt in the pore throat, thus reducing the flow pore volume. The establishment of initial water saturation by the centrifugation method damages the integrity of rock samples. In this study, it was proposed to wash the residual salt in the rock sample with saturated ethanol under high pressure. Moreover, the simulated formation water was evenly distributed in the core through strong spontaneous imbibition and hydrophilic characteristics of tight sandstone. The measurement range of water saturation was up to 67.83% by the spontaneous imbibition method, which provides the basis for determining the permeability jail range, and therefore, subsequent measurements are based on using the spontaneous imbibition method to establish water saturation.
Figure 5 shows the relationship between the permeability and the limit pressure of the sample. The gas slippage effect increased with the decrease in the impact force of gas molecules in the rock pores on the unit tube wall area. This is because the gas slippage effect becomes more severe with lower permeability, and a higher upper limit pressure is required. Previous studies indicate that the limit pressure in this study area should be greater than 0.9 MPa [24]. In order to investigate the influence of slippage on gas-phase relative permeability at different back pressures, experiments were carried out to measure the gas-phase permeability at 0, 1, and 3 MPa, respectively.
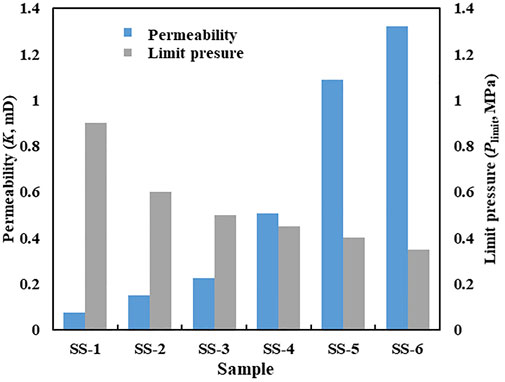
FIGURE 5. Relationship between the permeability and the limit pressure.
Figure 6 illustrates that the residual gas saturation of S-8 and S-9 in compact samples was about 32.88 and 52.9%, respectively. The relative permeability of water increased with the increase of water saturation and reached the maximum when the water saturation was about 90%. Figure 6A exhibits that ΔS0 was 21.56% for the back pressure of 0 MPa, while ΔS1 and ΔS2 were 25.18 and 27.20% for the back pressures of 1 and 3 MPa, respectively. The core sample with the permeability jail showed a smaller range without the back pressure. The gas slippage effect reduced the permeability jail range. However, when the back pressure was greater than the limit pressure (0.9 MPa), the difference between the two was only 2.02%, whereas the relative permeability of the gas phase showed no noticeable change. Therefore, it can be inferred that the gas slippage effect was weakened.

FIGURE 6. Relative permeability curves of S-8 and S-9 at different back pressures (ΔS0: range of the permeability jail when the back pressure is 0 MPa; ΔS1: range of the permeability jail when the back pressure is 1 MPa; and ΔS3: range of the permeability jail when the back pressure is 3 MPa). (A) Relative permeability curves of S-8 and (B) relative permeability curves of S-9.
Figure 6B demonstrates that the measured relative gas permeability of the core sample without permeability jail was relatively large without any increase in the back pressure, and the isotonic point moved to the right. When the back pressure was greater than the limit pressure of 0.9 MPa, the relative permeability of the gas phase did not significantly change. Therefore, it can be inferred that the gas slippage effect was weakened.
In order to predict the gas relative permeability in tight gas sandstones, Bynres (1979) modified Corey’s relative permeability model (1954) [13]. In this study, the theoretical relative gas permeability models of S-8 and S-9 are calculated using Eq. 6.
where Krg is the gas relative permeability, Sw is the water saturation, Swc,g is the water saturation when Krg = 1, Sgc is residual gas saturation, and p and q are the exponents.
For tight sandstone, where water permeability is less than the Klinkenberg permeability, Eq. 7 is used to estimate the water permeability (Kw) from Klinkenberg permeability (Kl < 1 mD) [23].
where Kl is the Klinkenberg permeability of the sample, and Kw is the water permeability of the sample.
Based on the estimation of Kw of water relative permeability, the wetting phase correlation can be used to calculate the relative permeability of liquid [24]. In this study, the theoretical relative liquid permeability of S-8 and S-9 is calculated using Eq. 8.
where Krw is the relative water permeability, and Swc is the water saturation when Krw = 0.
The permeability of S8 was 0.0775 mD, less than 0.1 mD. Moreover, the bound water saturation was 65%, greater than the initial water saturation. When the water saturation was about 60%, the gas–water two-phase permeability was less than 0.02, and there was a permeability jail. The liquid phase permeability gradually increased when the water saturation was close to 70%. The permeability of S-9 was 0.1800 mD, which was greater than 0.1 mD, whereas the bound water saturation was 28%, less than the initial water saturation. The water saturation at the isotonic point was 58.38%, while the relative permeability of gas–liquid phase was greater than 0.02, indicating no permeability jail.
The predicted and experimental results are shown in Figure 7. Among them, the relative permeability curves of two different permeability grades at different back pressures were drawn, including those calculated using the Byrnes model. With an accurate bound water saturation and residual gas saturation, the curves of low permeability and high permeability cores were in good agreement with the relative permeability calculated by using the Byrnes model; if not, the Byrnes model could not predict the relative permeability curve. In fact, it is hard to accurately obtain bound water saturation and residual gas saturation.
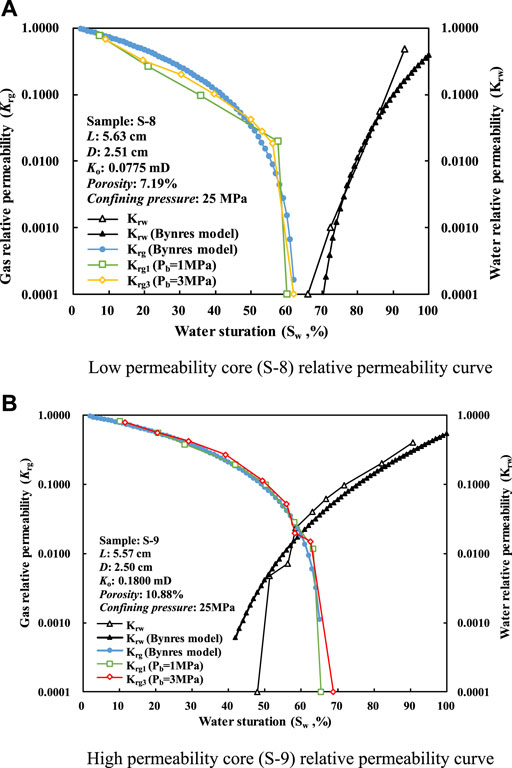
FIGURE 7. Gas–water relative permeability characteristics and model comparison of two sandstone samples. The modified Corey’s model [10], represented by Eqs. 6–8, is used to generate the relative permeability curves for low- and high-permeability sandstones with the permeability of Kl = 0.0775 mD and Kl = 0.1800 mD, respectively. For Kl = 0.0775 mD sandstone, the following parametric values are used: Swc,g = 0, Sgc =38%, Swc = 65%, p = 2, and q = 2, while for Kl = 0.1800 mD sandstone, the following parametric values are used: Swc,g = 0, Sgc = 35%, Swc = 28%, p = 1.5, and q = 2. (A) Low permeability core(S-8) relative permeability curve and (B) high permeability core(S-9) relative permeability curve.
Mo et al. considered the gas–water flow resistance characteristics and created a permeability jail model, which could satisfactorily predict the permeability jail range [15]. However, the experimental data range was narrow, and the model could not measure the gas–water relative permeability below the irreducible water saturation in the experimental process (Figure 8, S-5 gas–water phase permeability curve). If the method proposed herein can be used to obtain a broader gas–water phase permeability curve, it can be more conducive to establishing a permeability jail model.
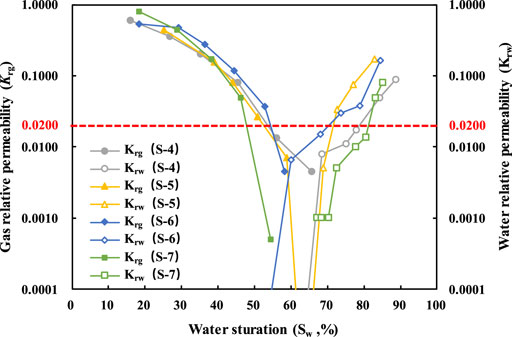
FIGURE 8. Four sets of relative permeability curves (all the four samples showed had a certain range of permeability jail).
The permeability jail refers to the situation when water saturation is within a range, and the relative permeability of the gas and liquid is below 0.02. Moreover, the fluid flow through the core is small. Therefore, it can be considered that the fluid under this flow pressure cannot flow in the rock. Low permeability reservoirs are commonly characterized by high capillary pressure, resulting in the immobility of both the water and gas phases [12, 25]. In tight gas reservoirs, it is common to have a water saturation range where water and gas cannot flow. The proposed method can thus prove the existence of a permeability jail (Figure 8).
In the four experimental groups mentioned earlier, different core samples showed different permeability jail ranges; however, the gas–water relative permeability curves exhibited similar variation trends. With the increase in water saturation, the gas-phase permeability decreased, while the liquid-phase permeability kept increasing. When the water saturation was in the permeability jail range, the gas–water relative permeability in the core was below 0.02 [11–13], which could be regarded as the gas–water two-phase system that could not flow. This indicates that when a reservoir falls into the permeability jail, it produces neither water nor gas.
This study found four groups of low permeability cores to have the permeability jail phenomenon. The results show the permeability confinement range of each sample. The maximum could reach 47.9–81.2% (Figure 8; Table 3, S-7), whereas the minimum could reach 54.2–70.3% (Figure 8; Table 3, S-6). The porosity difference between S-4 and S-7 was small. However, the permeability difference was as high as one order of magnitude, indicating that the smaller the throat radius of S-7, the greater was the Jamin effect. Therefore, the smaller the permeability, the more extensive will be the permeability jail range. The permeability difference between S-6 and S-7 was small. However, the porosity of S-6 was large, indicating that when the permeability difference was small, the larger the porosity, the smaller is the permeability jail range. Moreover, porosity, permeability, and permeability jail range of S-4 were larger than those of S-5, indicating that the larger the permeability, the smaller is the permeability jail range, and the larger the porosity, the smaller is the permeability jail range. The main influencing factors of permeability jail range are permeability and porosity.
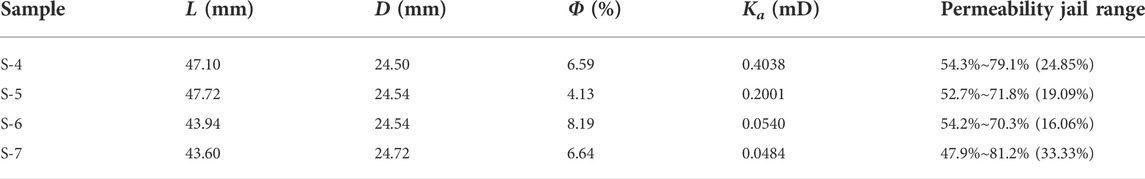
TABLE 3. Four sets of the permeability jail range.
Some gas–water formations are possibly defined as dry formations; for example, the core from the dry formation is proven to have a high gas saturation by core analysis. The result of good logs should consider how to avoid defining the gas-water formation as a dry formation.
During the processes of drilling, completion, and exploitation, external fluids should have a good formation protection ability because the main influencing factors are permeability and porosity [26, 27]. External fluids possibly cause the blocking of the fluid channels, which enlarges the permeability jail range, such as velocity sensitivity, water sensitivity, salt sensitivity, acid sensitivity, alkali sensitivity, and water phase trapping [28]. Before drilling, completion, and exploitation, the formation protection ability of the working fluids should be evaluated to reduce the damage to the formation [29].
During drilling, completion, and exploitation, the initial water saturation of the reservoir is usually outside the left boundary of the permeability jail. However, in the early stage of production, various reservoir modification measures, such as hydraulic fracturing, are often used [9]. Nevertheless, the intrusion of working fluid in the reservoir leads to increased water saturation near the borehole, and it is likely to be trapped in the permeability jail [2, 30]. Second, water causes the clay to expand and migrate, resulting in water phase trapping. Due to the effects of fracturing fluid residue and other factors, the water saturation near the good zone increases to the permeability jail, and the gas well production is affected by the permeability jail [25]. Therefore, experiments must be used to determine the range of permeability jail. If the water saturation can be safely developed outside the permeability jail range or reduced to the left boundary of the permeability jail, the influence of the permeability jail can be effectively avoided. Currently, other gases or solvents such as CO2, N2, C3H8, and liquefied natural gas can be used as fracturing fluids to avoid formation damage. However, fracturing fluids with less formation damage (such as LNG) still need to be studied [31].
The result of the gas–water relative permeability experiment shows that the water saturation influences the gas-phase permeability, which is the critical parameter of gas-phase permeability. The water saturation and the thickness of the water film decrease (equivalent to increasing the effective pore radius) by decreasing the abandonment pressure, increasing the formation pressure, heating and evaporation, and changing the rock wettability, which helps recover the gas permeability.
In this study, four aspects, namely, pressure, salt content, gas slippage effect, and determination of initial water saturation, were considered to establish the gas–water phase permeability measurement process. Considering a typical tight sandstone as an example, the proposed method was used to expand the measurement range of gas–water relative permeability and observe the permeability jail range, laying an experimental foundation for accurately determining the permeability jail range. Moreover, this method is highly consistent with the gas–water relative permeability curve calculated using the Byrnes model.
(1) Simulating formation pressure conditions and the gradual increase of water saturation is a more accurate and reliable method to obtain the range of the permeability jail.
(2) Under the condition of native stress, the gas–water relative permeability of a tight core was measured with the limit pressure, and the actual waste pressure as the back pressure. The experimental result proves that the gas slip effect can be effectively reduced when the pressure is higher than the limit pressure.
(3) The measurement process established in this study agrees with the calculated results of the Byrnes model and the general law of the gas–water relative permeability curve. The Byrnes model can be used when accurate irreducible water saturation and residual gas saturation can be obtained, and the method used herein can be considered to obtain broader data when establishing the model.
(4) The permeability jail phenomenon is found in the tight sandstone of Ordos Basin by the proposed method, indicating that the larger the permeability, the smaller the permeability area, whereas the larger the porosity, the smaller is the permeability area.
(5) During drilling, completion, and exploitation, the focus should be on the formation protection ability of the working fluids. When the formation falls into permeability jail, the water saturation and the thickness of the water film can be decreased to recover the gas's relative permeability.
The original contributions presented in the study are included in the article/supplementary materials; further inquiries can be directed to the corresponding author.
WG, LY, and YK contributed to the conception and design of the study. JX contributed to the analysis and/or interpretation of data. YZ contributed to the drafting of the manuscript.
The authors greatly acknowledge the financial support from the Natural Science Foundation of China (Grant No. 51674209) and the Sichuan Province Youth Science and technology innovation team project (Grant No. 2021JDTD0017).
We would like to thank MogoEdit (https://www.mogoedit.com) for its English editing during the preparation of this manuscript.
Author JX was employed by Sinopec Chongqing Shale Gas Co., Ltd.
The remaining authors declare that the research was conducted in the absence of any commercial or financial relationships that could be construed as a potential conflict of interest.
All claims expressed in this article are solely those of the authors and do not necessarily represent those of their affiliated organizations, or those of the publisher, the editors, and the reviewers. Any product that may be evaluated in this article, or claim that may be made by its manufacturer, is not guaranteed or endorsed by the publisher.
1. Mo F, Peng X, Devegowda D, Du Z, Qi Z, Tang Y, et al. Permeability jail for two-phase flow in tight sandstones: Formulation, application and sensitivity studies. J Pet Sci Eng (2020) 184:106583. doi:10.1016/j.petrol.2019.106583
2. Cluff RM, Byrnes AP. Relative permeability in tight gas sandstone reservoirs-the permeability jail model. In: Paper presented at the SPWLA 51st annual logging symposium. Perth, Australia (2010). SPWLA-2010-58470.
3. Yin X, Shu J, Li YL, Gao W, Ma L, Peng W, et al. Impact of pore structure and clay content on the water-gas relative permeability curve within tight sandstones: A case study from the LS block, eastern Ordos Basin, China. J Nat Gas Sci Eng (2020) 81:103418. doi:10.1016/j.jngse.2020.103418
4. Tian J, Kang YL, You LJ, Jia N, Xi Z, Luo P, et al. Investigation on water phase trapping mechanisms in tight gas reservoirs: Pore-scale visualization observation and core-scale flooding analysis. J Pet Sci Eng (2021) 198:108185. doi:10.1016/j.petrol.2020.108185
5. Zhang D, Kang Y, Selvadurai APS, You L, Tian J. The role of phase trapping on permeability reduction in an ultra-deep tight sandstone gas reservoirs. J Pet Sci Eng (2019) 178:311–23. doi:10.1016/j.petrol.2019.03.045
6. Bahrami N, Dousi N, Lashari A. Evaluation of damage mechanisms in tight gas reservoirs: Integration of laboratory experiments and field data with numerical simulation. In: Paper presented at the SPE offshore europe conference and exhibition. Scotland, UK: Aberdeen (2015). SPE-175433-MS. doi:10.2118/175433-MS
7. Shaoul J, van Zelm L, De Pater CJ. Damage mechanisms in unconventional-gas-well stimulation—a new look at an old problem. SPE Prod Oper (2011) 26(4):388–400. doi:10.2118/142479-PA
8. Li Z, Zuo J, Shi Y, Xu F, Yu M, Mi C, et al. An experimental study on the slippage effects of sandstone under confining pressure and low pore pressure conditions. Geofluids (2020) 1–17. doi:10.1155/2020/9296243
9. Shanley KW, Cluff RM, Robinson JW. Factors controlling prolific gas production from low-permeability sandstone reservoirs: Implications for resource assessment, prospect development, and risk analysis. Am Assoc Pet Geol Bull (2004) 88(8):1083–121. doi:10.1306/03250403051
10. Fu X, Agostini F, Skoczylas F, Jeannin L. Experimental study of the stress dependence of the absolute and relative permeabilities of some tight gas sandstones. Int J Rock Mech Min Sci (1997) (2015) 77:36–43. doi:10.1016/j.ijrmms.2015.03.005
11. Farahani M, Aghaei H, Asadolahpour SR. Sensitivity of unsteady-state gas-water relative permeability to experimental artefacts and interpretation techniques; case study from a gas reservoir in south Iran. J Nat Gas Sci Eng (2019) 71:102998. doi:10.1016/j.jngse.2019.102998
12. Khlaifat A, Qutob H. Formation damage in tight gas reservoirs - prevention, control and remediation. Nurs Inq (2011) 21(1):30–8. doi:10.1111/nin.12015
13. Buchsteiner H, Warpinski NR, Economides MJ. Stress-induced permeability reduction in fissured reservoirs. In: Paper presented at the SPE annual technical conference and exhibition. Houston, Texas (1993). SPE-26513-MS. doi:10.2118/26513-MS
14. Li Z, Zuo J, Shi Y, Xu F, Yu M, Mi C. An experimental study on the slippage effects of sandstone under confining pressure and low pore pressure conditions. Geofluids (2020) 1–17. doi:10.1155/2020/9296243
15. Davies JP, Davies DK. Stress-dependent permeability: Characterization and modeling. SPE J (2001) 6(02):224–35. doi:10.2118/71750-PA
16. Putnis CV, Ruiz-Agudo E. Nanoparticles formed during mineral-fluid interactions. Chem Geol (2021) 586:120614. doi:10.1016/j.chemgeo.2021.120614
17. Da Silva DC, da Hora LF, de Araujo JDC, Arruda GM, da Costa FMF, Rodrigues MAF, et al. Evaluation of nonylphenol surfactant in enhanced oil recovery by SAG and WAG method. Fuel (2022) 314:122717. doi:10.1016/j.fuel.2021.122717
18. Yuan B, Moghanloo RG. Nanofluid pre-treatment, an effective strategy to improve the performance of low-salinity waterflooding. J Pet Sci Eng (2018) 165:978–91. doi:10.1016/j.petrol.2017.11.032
19.General Administration of Quality Supervision. Inspection and quarantine of the people's Republic of China, standardization administration of the people's Republic of China. Beijing, China: Standards Press of ChinaPetroleum Industry Press (2012). p. 31–5. SY/T 29172-2012.
20. Li J, Chen Z, Wu K, Li R, Xu J, Liu Q, et al. Effect of water saturation on gas slippage in tight rocks. Fuel (2018) 225:519–32. doi:10.1016/j.fuel.2018.03.186
21. Da Silva DC, da Hora LF, de Araujo JDC, Arruda GM, da Costa FMF, Rodrigues MAF, et al. Evaluation of nonylphenol surfactant in enhanced oil recovery by SAG and WAG method. Fuel (2022) 314:122717. doi:10.1016/j.fuel.2021.122717
22. Jeannin L, Davy CA, Skoczylas F, Portier E, Fu X, Agostini F. Hydraulic cut-off and gas recovery potential of sandstones from tight gas reservoirs: A laboratory investigation. In: Paper presented at the 45th U.S. Rock mechanics/geomechanics symposium. San Francisco, California (2011). ARMA-11-348.
23. Silin D, Kneafsey TJ, Ajo-Franklin JB, Nico P. Pore-scale mechanisms of gas flow in tight sand reservoirs. San Fransokyo: Lawrence Berkeley National Laboratory (2010).
24. Wu XH, Pu H, Zhu K, Lu S. Formation damage mechanisms and protection technology for Nanpu nearshore tight gas reservoir. J Pet Sci Eng (2017) 158:509–15. doi:10.1016/j.petrol.2017.07.033
25. Jones FO, Owens WW. A laboratory study of low-permeability gas sands. J Petrol Tech (1980) 32(9):1631–40. doi:10.2118/7551-PA
26. Ward JS, Morrow NR. Capillary pressures and gas relative permeabilities of low-permeability sandstone. SPE Formation Eval (1987) 2(3):345–56. doi:10.2118/13882-PA
27. Jing G, Chen Z, Hu X, Hui G. Influence of different shut-in periods after fracturing on productivity of MFHW in Duvernay shale gas formation with high montmorillonite content. Fuel (2022) 314:122719. doi:10.1016/j.fuel.2021.122719
28. Cheng B, Li J, Li J, Su H, Tang L, Yu F, et al. Pore-scale formation damage caused by fracturing fluids in low-permeability sandy conglomerate reservoirs. J Pet Sci Eng (2022) 208:109301. doi:10.1016/j.petrol.2021.109301
29. Mehdizad A, Pourafshary P, Sedaee B. Visual investigation of simultaneous clay swelling and migration mechanisms and formation damage consequences using micromodels. J Petrol Sci Eng.J Petrol Sci Eng (20222017) 158:110561509–15.
30. Jeannin L, Davy CA, Skoczylas F, Portier E, Fu X, Agostini F. Hydraulic cut-off and gas recovery potential of sandstones from tight gas reservoirs: A laboratory investigation. In: Paper presented at the 45th U.S. Rock mechanics/geomechanics symposium. San Francisco, California (2011). ARMA-11-348.
Keywords: boundary, two-phase flow, spontaneous imbibition, water saturation, Byrnes model
Citation: Gong W, You L, Xu J, Kang Y and Zhou Y (2022) Experimental study on the permeability jail range of tight gas reservoirs through the gas–water relative permeability curve. Front. Phys. 10:923762. doi: 10.3389/fphy.2022.923762
Received: 19 April 2022; Accepted: 04 July 2022;
Published: 10 August 2022.
Edited by:
Huazhou Li, University of Alberta, CanadaReviewed by:
Cuiying Jian, York University, CanadaCopyright © 2022 Gong, You, Xu, Kang and Zhou. This is an open-access article distributed under the terms of the Creative Commons Attribution License (CC BY). The use, distribution or reproduction in other forums is permitted, provided the original author(s) and the copyright owner(s) are credited and that the original publication in this journal is cited, in accordance with accepted academic practice. No use, distribution or reproduction is permitted which does not comply with these terms.
*Correspondence: Wei Gong, Z3cwOTA1QDEyNi5jb20=
Disclaimer: All claims expressed in this article are solely those of the authors and do not necessarily represent those of their affiliated organizations, or those of the publisher, the editors and the reviewers. Any product that may be evaluated in this article or claim that may be made by its manufacturer is not guaranteed or endorsed by the publisher.
Research integrity at Frontiers
Learn more about the work of our research integrity team to safeguard the quality of each article we publish.