- 1School of Electrical Engineering, Technological University of Panama, Panama City, Panama
- 2Sistema Nacional de Investigación (SNI), SENACYT, Panama City, Panama
- 3Centro de Estudios Multidisciplinarios en Ciencias, Ingeniería y Tecnología AIP (CEMCIT-AIP), Panama City, Panama
- 4Dept. of Mechanical and Aerospace Engineering, University of Florida, Gainesville, Fl, United States
Surface Dielectric Barrier Discharge (SDBD) is a well-known technology for active aerodynamic flow control with low power consumption. It is a type of plasma actuation for flow control with no moving parts and very fast response times. Research on SDBD flow control over the years has shown great potential for flow separation, boundary layer transition, drag reductions and suppression of local heating. A major area of research on SDBD flow control lies in increasing the effectiveness of SDBD actuators with new electrode configurations, surface materials, and plasma array designs. This review aims to provide a comprehensive report of research performed on SDBD flow control over the last 2 decades with a focus on SDBD reactor designs. Aspects of SDBD flow control including discharge morphology and actuation mechanism through momentum and energy transfer have been discussed in depth. Additionally, the future of research in SDBD actuated flow control has been explored. This review can serve as the baseline to develop new SDBD reactor designs for specific applications with improved effectiveness and advanced systems.
1 Introduction
This paper examines the current literature available on Surface Dielectric Barrier Discharge (SDBD) as a medium of active airflow control. It dissects relevant publications in the last 20 years and compares them with the most recent discoveries. A detailed discussion is presented on relevant research findings on 1) discharge morphology of SDBD and 2) the key mechanisms of momentum and energy transfer responsible for SDBD flow actuation. Although there are relevant publications with a similar framework [1, 2], the reader will find this review uniquely useful in the development, implementation, and integration of new reactor designs for improved performance. Furthermore, this review presents the knowledge base that can help readers choose the reactor design better fitted for the requirements of the research or the field of application.
There are two variants of dielectric barrier discharges found in the literature, namely, volume DBD (VDBD) or surface DBD (SDBD). Independently of this classification, the basic structure of the apparatus used to produce the discharges is comprised of a pair of electrodes and a dielectric barrier. In SDBD, there is no gap between any of the electrodes and the dielectric barrier. As a consequence, discharges acquire a near two-dimensional distribution over the surface of the barrier and along the border of the electrode that is left exposed to the surrounding gas, as depicted in Figure 1A. The bottom electrode is usually grounded and buried in an additional layer of dielectric material, such as Kapton film, to avoid any possible plasma formation on that side of the SDBD generator. This is better appreciated through its cross-sectional view in Figure 1B. Another possible configuration for an SDBD reactor is that of Figure 1C, where both electrodes are placed side by side and covered with a layer of dielectric material, which yields cold plasma over the barrier without direct contact between the electrodes and the surrounding gas. For VDBD, on the other hand, microdischarges ignite inside a volumetric region delimited by the gap between the electrodes, as shown in Figure 1D. Either one or both electrodes can be covered by a layer of dielectric material. Figure 1E illustrates a especial type of configuration called floating-electrode DBD (FE-DBD). As the name implies, the ground or buried electrode is eliminated and the high voltage electrode is left floating. In this condition, the applied voltage is insufficient to cause breakdown; however, when an object with a high dielectric constant, like skin tissue, is sufficiently close to the electrode, it will form a large capacitance where most of the voltage would concentrate, resulting in a strong electric field in the gap that can lead to breakdown and discharge formation [3]. The last configuration in Figure 1F, corresponds to an example of a plasma jet, which is a type of electrode arrangement requires the injection of an additional gas, that will be ejected in the form of a low temperature plasma jet into the surrounding air. Since temperatures remain below 40 °C, they can come in touch with soft matter, including biological tissues, without causing thermal damage [4].
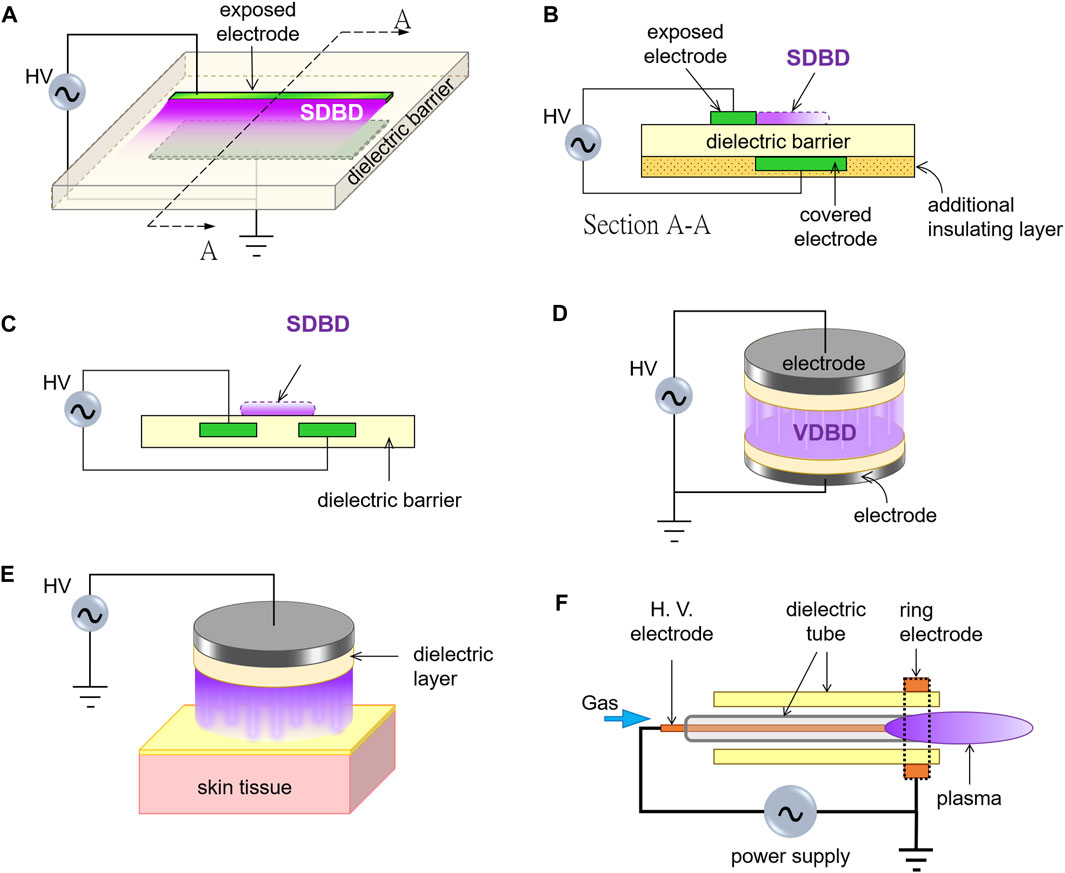
FIGURE 1. Types of DBD Plasma Reactors. (A) Basic linear SDBD configuration with plasma along the border of the exposed electrode. (B) Cross-sectional view of the linear SDBD configuration. (C) SDBD with both electrodes buried in the dielectric. (D) VDBD with both electrodes covered with a dielectric layer. (E) Floating-electrode DBD (FE-DBD). (F) An example of plasma jet.
The difference of the electrode’s arrangement in SDBD and VDBD have more than visual implications. In particular, at or near atmospheric pressure, volume microdischarges manifest as a large number of thin plasma channels that die down after a few ns [5–7], since charges pileup on the barrier’s surface, weakening the electric field at the location of the discharge; although this do not prevent microdischarges to appear at other locations as long as the voltage continues rising [8]. Contrastingly, surface microdischarges manifest either as corona spots or streamers that expand over or through the dielectric surface, as it is discussed with more detail in following sections.
Both DBD variants have a broad range of applications in industry and medicine, including the decontamination of pathogens such as fungi and bacteria [9–14] and disintegration or abatement of undesirable chemical compounds [15–17] by exploiting the formation ions and free radicals including reactive oxygen species (ROS) and reactive nitrogen species (RNS). Especially in recent years, there has been an outburst of possibilities for DBD technology in the emerging field of Plasma Medicine, where five sub-fields of interest can be identified: plasma-based biomedical materials, plasma decontamination, plasma biology, plasma wound healing and plasma oncotherapy [18]. In this regard, FE-DBD shows great promises in the sterilization of tissue [19], blood coagulation [3] and skin regeneration [20]. But, perhaps, the most impressive results have been the reduction of tumors and the melanoma cancer treatment, causing apoptosis or progressive death of malignant cells after the treatment without the destruction and necrosis of the healthy tissue [21, 22]. Plasma jets are other type of reactors used in Plasma Medicine for the treatment of non-healing wounds and ulcers of the human skin [23]. Lately, researchers have investigated the use of plasma jet arrays to increase the jet intensity and electric efficiency [24–27], as well as the flow characteristics of the jet and how it influences the action on the skin tissue [28–32].
A Global interest in weakly ionized gases reemerged in the 1994 with the disclosure of the Soviet AJAX which incorporated plasma technology to improve flight aerodynamic performance. Since then, considerable research has been performed exploring flow control applications of plasma actuators [33, 34]. Research findings along with inflight-demonstrations have shown the potential of SDBD plasma actuators as an active aerodynamic flow control device for control of flow separation, boundary layer transition, drag reductions and suppression of local heating. Various studies have also shown increased effectiveness of SDBD actuators with new electrode configurations, optimized dielectrics, surface materials, and plasma array designs in the last decade.
In this paper, we aim to present a comprehensive examination discharge morphology of SDBD, and its actuation mechanism through momentum and energy transfer. The focus will be on the effect of reactors designs on these aspects of SDBD flow control and vice versa. Section 2, section 3, section 4 talk about the discharge morphology, SDBD actuation through momentum transfer, and SDBD actuation through energy transfer, respectively. Section 5 presents authors investigative notes on the future of SDBD flow actuation. This review can serve as the baseline to develop new SDBD reactor designs for specific applications with improved effectiveness and advanced systems.
2 Morphology of surface dielectric barrier discharges
This section examines more closely the physical phenomenon of surface microdischarges, which occur when the local electric field between the exposed electrode and the nearby surface of the dielectric barrier surpasses the breakdown voltage of the surrounding gas. Those same microdischarges serve as bridges for electrical charges that accumulate on the surface of the barrier (or move from it, depending on the polarity of the voltage applied to the exposed electrode) [35–37]. Any individual microdischarge has a short duration because the charge accumulation (depletion) on the barrier’s surface gradually reduces the local electric potential to levels below the breakdown threshold.
At a distance, SDBD gives the impression of a steady glow, but intensified charge-coupled device (ICCD) imagery revealed very different discharge characteristics for positive and negative voltage derivatives. Independently of the voltage waveform, a negative voltage slope would induce a diffuse or glow regime in which discharges are comprised by a great number of negative corona spots that originate at the edge of the exposed electrode and extend over the dielectric surface with a plume shape, whereas a positive slope would induce streamers whose branches propagate stochastically in continuous contact with the surface of the dielectric. According to [38], the applied voltage waveform does have an impact in the density and extension of discharges in both regimes. It was demonstrated that the density and extension of discharges in the glow regime increases with the slew-rate of the voltage descent, whereas the number of streamers would increase with the derivative of the voltage rise, although the extension of their branches would tend to bend slightly due to the interactions with neighboring streamers.
Figure 2 shows the SDBD morphology corresponding to an AC voltage. Here, microdischarges composing the plasma envelope only exist during certain portions of each cycle of the voltage-wave; specifically, the voltage rises in the positive half-cycle and the voltage descent in the negative half-cycle, which is in agreement with what was mentioned in the previous paragraph. During the positive half-cycle, the barrier is the source of the electrons as shown in the schematic of Figure 2A. The current in this region is characterized by large spikes that stand out from the capacitive component—see Figure 2B. ICCD photographs of the discharges in Figure 2C [38, 39] reveal the streamers characteristic of this regime. These filamentary discharges form and extinguish on time scales of a few to hundreds of nanoseconds [40, 41], with subsequent streamers extending further as time progresses as illustrated in Figure 2D [35]. For the negative half-cycle, on the other hand, Figure 2E illustrates the exposed electrode as the source of electrons. The current corresponding to the glow regime appears in Figure 2F, showing densely populated spikes which barely stand out from the capacitive current. In Figure 2G, it can be seen that the diffuse plasma glow in the negative cycle is in fact comprised by a great number of corona spots. Furthermore [35], deduced that corona discharges in the glow regime evolve with time by leaping over each other as the overall plasma envelope expands over the dielectric—this is illustrated in Figure 2H. By comparing Figures 2B,F, one can notice that the largest current spikes appear in the positive half-cycle; nonetheless, those in the negative half-cycle or glow regime are more densely populated. According to experimental and numerical studies, the surface density and charge transfer are not symmetric because they are higher in the negative cycle or glow regime [35, 42]. The reason for this disparity is not entirely clear, but authors point to different factors such as the difference in the time duration of discharges in both regimes, ionization reactions and electron emission in the glow phase [41], discontinuous charge transfer during streamer propagation [42], and long-lived charge accumulation on the dielectric barrier that increases with distance from the exposed electrode [35, 39, 43, 44]. In addition, the work in [41] indicates that most of the active power is dissipated in the plasma as heat during the glow regime, although the authors admit that more studies are necessary for a definitive conclusion.
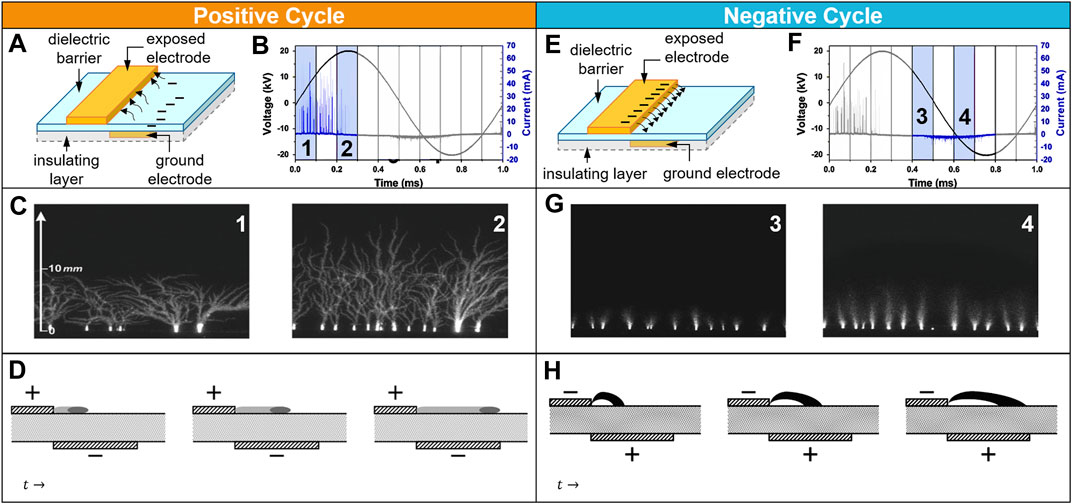
FIGURE 2. (A) Schematic of discharge exchange during the negative-going cycle; concept taken from [45]. (B) SDBD’s characteristic voltage and current in the positive half-cycle [39]. (C) Fast-imaging of the developing plasma [38, 39]. (D) Schematic showing the expansion of the discharges with time [35]. (E) Schematic of discharge exchange during the positive-going cycle; concept taken from [45]. (F) SDBD’s characteristic voltage and current in the negative half-cycle [39]. (G) Fast-imaging of the developing plasma [38, 39]. (H) Schematic showing the expansion of the streamers with time [35].
For the nanosecond pulse SDBD, the input power signal consists of a series of pulses with duration in nanosecond range. The current waveform for an individual pulse presents only two current peaks: one during the voltage rise (positive slope) and one during the voltage fall (negative slope), as it is shown in Figure 3A. ICCD views of discharges igniting at the same time of the current peaks reveal similar characteristics to discharges in the AC case. i.e., streamers with large extension during the voltage rise (positive discharge) and corona spots expanding with a plume shape during the voltage fall (negative discharge). This is an expected result, since the morphology of the discharges is dependent on the voltage derivative, as it was previously discussed.
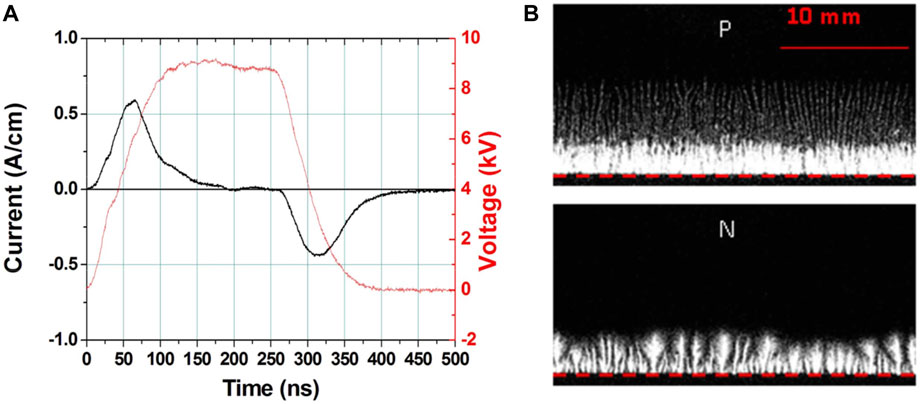
FIGURE 3. (A) Waveform of the applied high voltage and the associated discharge current. (B) Top ICCD views of the positive (p) and negative (N) discharge. Red dotted line: active electrode edge. Figures taken from [46].
3 SDBD actuation through momentum transfer (EHD force)
A characteristic of SDBD is the ability to induce an electric or ionic wind by means of an electrohydrodynamic (EHD) force. This force is the result of momentum transferred from charged particles accelerated by the electric field to neutral air particles [47]. In a linear electrode arrangement like the one in Figure 1D and Figure 4A, the EHD force produces a wall jet flow in the downstream direction—i.e., from the exposed to the ground electrode—as shown in Figure 4B, where gray shades indicate the velocity magnitude

FIGURE 4. Illustration of the EHD force effect in SDBD. (A) Cross-sectional view of an SDBD reactor inducing air flow in the x direction. (B) PIV photograph of the air flow induced by a linear SDBD reactor in the x direction.
Although there seems to be a consensus of what causes the EHD force in SDBD, its spatial-temporal behavior and the mechanisms involved are yet to be fully understood. However, the most important conclusions obtained from experimental research can be summarized as follows:
• In a linear electrode arrangement (Figure 4), there is a net EHD force per AC cycle with a dominant component parallel to the surface of the dielectric barrier in the direction of the buried electrode that creates a laminar wall jet flow in the same direction.
• A negative vertical component of the EHD force near the edge of the expose electrode pushes the air flow downwards—towards the dielectric barrier—with a fluid suction effect [39, 48, 51, 52].
• The maximum downstream velocity—
• Highest velocities are developed during the negative half-cycle (negative slope) that correspond to the glow regime [52, 55, 56], with some authors suggesting that more than 95% of the momentum transfer to the neutral fluid occurs in this regime [35, 57].
Although it is known that the EHD force is primarily a function of the electric field and the number of ions [58, 59], the spatial and temporal behavior of the EHD force in both modes of SDBD plasma and the contributions of certain ion species are not established with certainty. On this subject [56], proposed a push-push scenario where both negative and positive half-cycles produce a force in the positive
3.1 Influence of physical parameters of SDBD actuators
It is possible to enhance the momentum transfer from ions to neutral gas particles and achieve the highest possible velocities by altering physical parameters of the SDBD apparatus, as well as adjusting values of voltage and/or frequency.
3.1.1 Optimal horizontal gap between exposed and buried electrode
By positioning the covered electrode asymmetrically with respect to the exposed electrode, the electric field lines extend over a larger area and the plasma region expands. However, this type of asymmetric arrangement also gives rise to questions; including how the horizontal separation or gap, shown in Figure 5A, would affect the maximum induced velocity [62]. Investigated this topic using four different Teflon® PTFE actuators with electrodes 3.2 mm wide and horizontal gaps ‘
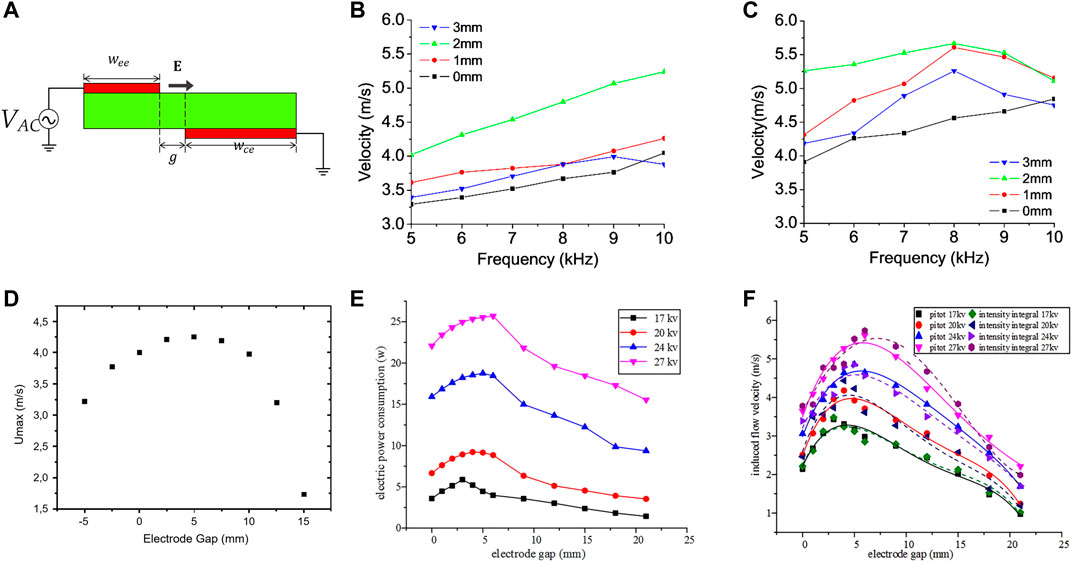
FIGURE 5. (A) Diagram of the horizontal gap between electrodes. (B) Induced flow velocity as a function of frequency and electrode gap, RMS voltage = 7 kV (∼19.8 kVpp). (C) RMS voltage = 9 kV (∼25.5 kVpp). Electrode gaps of g = 0, 1, 2, and 3 mm for both cases [62]. (D) Evolution of the maximum induced velocity with the electrode gap, AC voltage amplitude of 20 kVpp and frequency of 700 Hz [52]. (E), (F) Power consumption and induced flow velocity vs. electrode gap, frequency of 9.1 kHz [64].
Another study [64, 65], provided similar results for linear electrodes
In summary, leaving a horizontal gap
3.1.2 Influence of electrical parameters on the induced velocity
The power consumption of SDBD reactors is a function of the applied voltage and the operating frequency. Normally, the power consumed by a dielectric is proportional to
However, when plasma is formed, the power follows the relationship
In terms of frequency, experimental observations performed by numerous authors have demonstrated that, in general and for any SDBD arrangement, power and frequency share a linear relationship
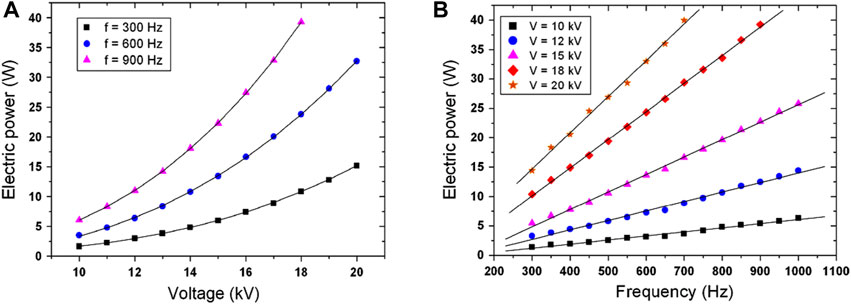
FIGURE 6. Electric power as a function of voltage and frequency. (A) Cubic evolution of the electric power consumption versus voltage amplitude for different frequencies. (B) Linear evolution of the electric power versus frequency for different voltage amplitudes. Figure taken from [52].
The induced velocity, on the other hand, evolves asymptotically with voltage and frequency, initiating with a rapid growth and then reaching a saturation point or plateau, as the example in Figure 7A. This saturation phenomenon is also shared with the relationship between velocity and power consumption, meaning that after a certain threshold, increasing the electrical power has little to no effect on the maximum velocity achieved—see Figure 7B. It is important to notice that saturation is achieved more rapidly with frequency than with voltage, which coincides with the extension of the discharge area for these two parameters, as shown in Figures 7C,D. [71] Explained this behavior as a result of the increment in collisions and attachment processes. Another effect to consider is that the power dissipation through the dielectric would increase more rapidly with frequency according to the loss tangent of the material.
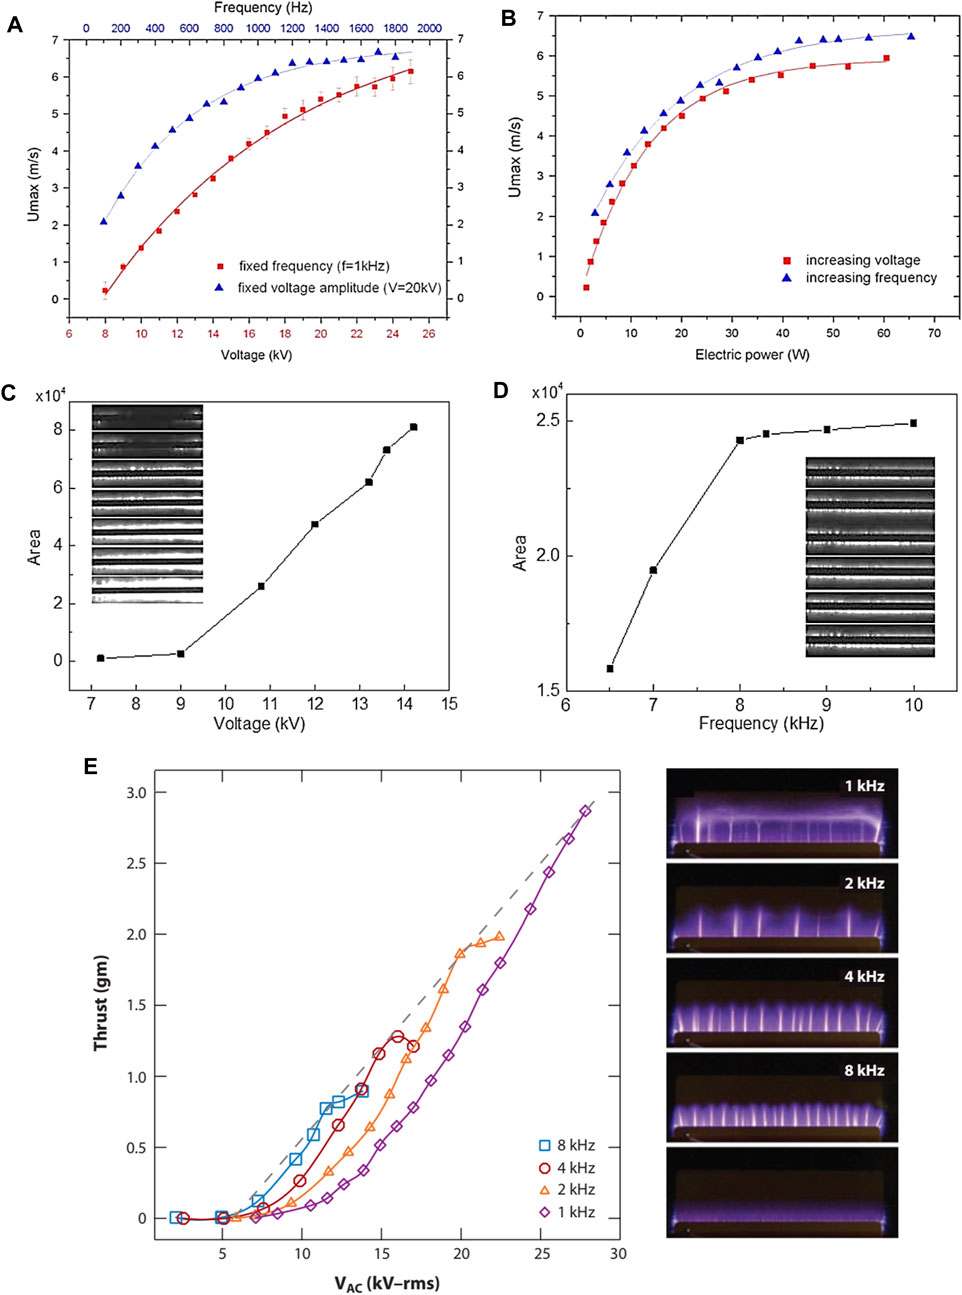
FIGURE 7. (A) Velocity as a function of voltage and frequency. (B) Velocity as a function of electrical power [52]. (C) Discharge area as a function of applied voltage for a fixed driving frequency of 8.4 kHz, including discharge photographs from 7.2 to 14.2 kVmax (top to bottom). (D) Discharge area as a function of applied frequency for a fixed driving voltage of 12 kVmax voltage, including discharge photographs from 6.5 to 10 kHz (top to bottom) [71]. (E) Induced trust for different AC frequencies. SDBD reactor with a glass dielectric barrier 6.35-mm-thick [68].
An important phenomenon is observed in Figure 7E [68], which depicts the relationship between thrust and the operating frequency. Here, thrust if the reactive force pointing in the opposite direction of the mass flow acceleration induced by DBD. The authors measured this force directly through a highly sensitive balance able to detect an apparent mass increase (measured in grams, gm) that actually corresponds to the push of the thrust. The figure shows that if the power is increased beyond saturation by raising the frequency, the maximum thrust drops. This is the direct result of the formation of leaders, which are prominent discharges with a higher temperature and degree of ionization than normal streamers. Leaders consume power and reduce the maximum thrust because their channel temperature promote fast heating reactions that would consume electrons and quench other excited molecules and ions. Since both thrust and velocity are directly proportional to the momentum transfer between particles in the plasma, the same behavior applies if the velocity, instead of thrust, is used as the dependent variable.
3.1.3 Geometry of the exposed electrode
Besides linear electrodes, other electrode geometries of SDBD, like those in Figure 8, have been proposed to create three-dimensional structures and exert specific effects in the surrounding flow. Except for Figure 8B, all configurations exhibit a periodicity of the plasma envelope that [72] characterized through the parametric function:
where
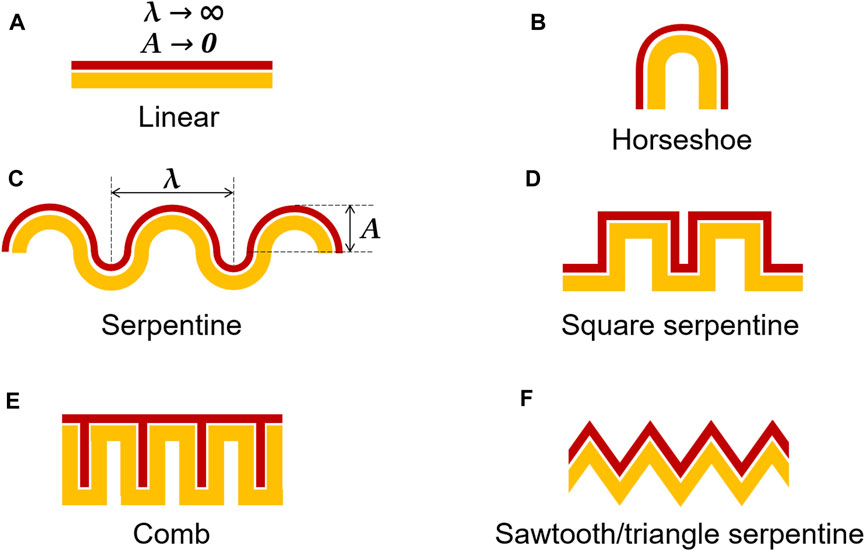
FIGURE 8. Different SDBD reactor configurations. (A) Linear reactor. (B) Horseshoe. (C) Serpentine. (D) Square serpentine. (E) Comb. (F) Sawtooth.
It is evident that the linear reactor geometry in Figure 8A corresponds to the special case where
The geometry in Figure 8B is called horseshoe. In such configuration the electrodes consist of a half circle with two extended ends resembling the shape of a horseshoe, hence its name. The semicircles of the exposed and ground electrode are concentric with different radii. In the example shown in Figure 9A, the radius of the expose electrode ‘
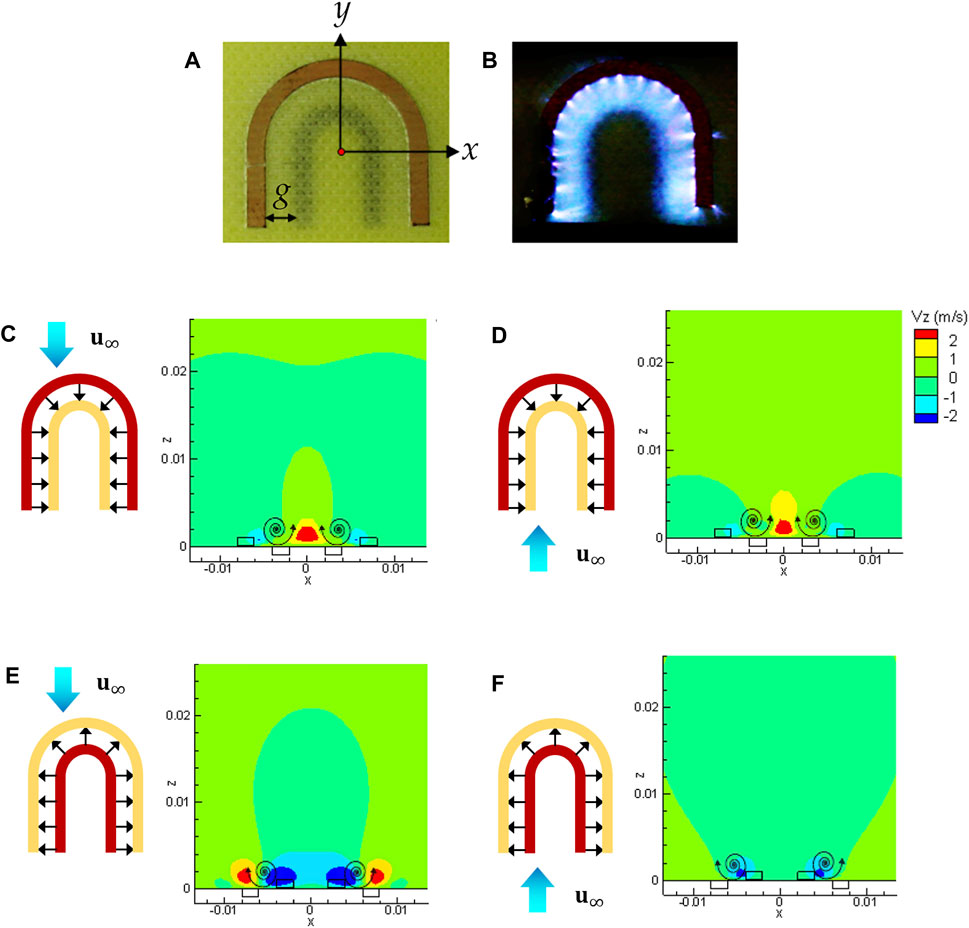
FIGURE 9. Horseshoe SDBD reactor (actuator). (A) Real-life example. (B) Plasma envelope. (C,D) Vortical structures depending on the direction of the freestream velocity when plasma forms inwards. (E,F) Vortical structures depending on the direction of the freestream velocity when plasma forms outwards. Concept and data taken from (73).
The horseshoe reactor later evolved into the serpentine reactor geometry, which is illustrated in Figure 8C and Figure 10A. The design consists of an arrangement of alternating half circles, with two different radii so each half cycle of the plasma envelope has the same linear length. The grounded electrode usually follows the windings of the exposed electrode. Every period of this configuration can be analyzed by dividing it in two regions: pinching and spreading. The spreading region corresponds to the crest and is characterized by the spreading of the force vectors as presented in Figure 10D. Whereas, the pinching region corresponds to the valleys, where force vectors point inward and interact with each other through superposition. Figures 10C,D, show the characteristic flow effects induced by the serpentine geometry [75]. At the spreading region, the induced flow corresponds to a typical SDBD wall jet as shown in Figure 10C. But at the pinching region, the electric field concentrates and superposition gives way to EHD force components not only parallel to the dielectric barrier but also out of plane, resulting in streamwise counter-rotating vortex pairs at each side of the spreading region that generate streamwise twisted jets that propagate pushing the fluid upwards with an impingement angle as shown in Figure 10D.
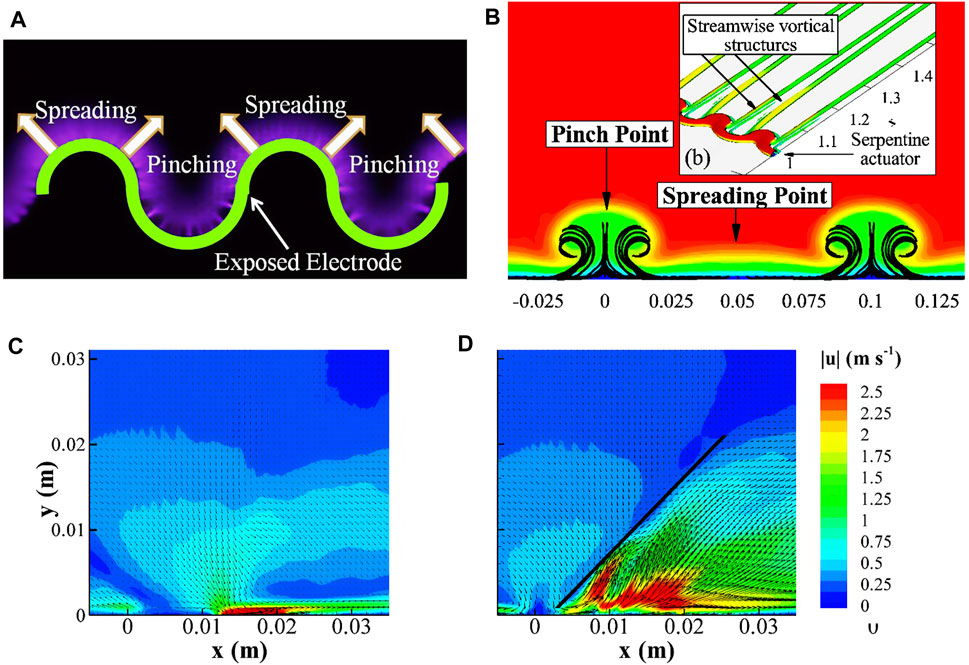
FIGURE 10. (A) Circular serpentine SDBD plasma reactor. (B) Numerical simulation showing the counter-rotating vortex pairs at the pinching region on the
Other versions of the serpentine geometries have been also developed; namely square [75] and sawtooth or triangle serpentine [76]. The flow pattern of these geometries also presents a straight wall jet in the spreading region and opposite vortex pairs in the pinching region but with some noticeable differences. In the square serpentine the vortices propagating in the streamwise direction have the same impeachment angle than in the circular serpentine, but a larger velocity magnitude because the straight lines of the square serpentine produce straight jets directed in the opposite
Another simple and efficient way to introduce three-dimensional effects in the airflow is to positioning linear reactors with respect to each other or to an incoming flow. Such is the case of the comb/finger geometry, which in fact is an arrangement of parallel linear reactors, although they could also be considered a special type of square serpentine, where the spreading region has been decreased to a minimum. There are various flow patterns that can be induced and controlled through the design of the ground electrode. In the configuration of Figure 11A, the design of the ground electrode restricts the plasma formation to only parallel edges of the fingers. Therefore, adjacent fingers produce opposite wall jets that push the fluid upwards at half distance between them. This effect combined with the suction mechanism over the edges of the finger creates counter-rotating vortices like those in like the ones in Figure 11B. If, of the other hand, the ground electrode is positioned only on one side—the same for each finger—the resulting vortices are co-rotating.
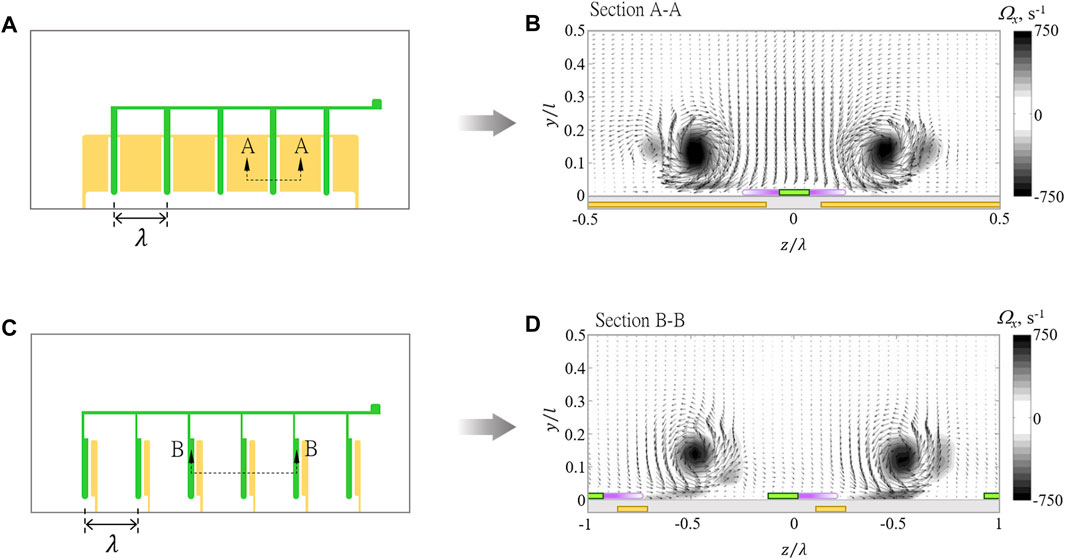
FIGURE 11. Flow of comb/finger reactor with plasma only around the parallel fingers. (A) Ground electrode on both sides of the fingers. (B) Counter-rotating vortices. (C) Ground electrode only on one side of the parallel fingers. (D) Co-rotating vortices [77].
If a linear SDBD electrode is oriented with an angle with respect to an oncoming flow, it can generate a vortex that propagates in the direction of the flow or stream-wise. These types of arrangements are often called SDBD Vortex Generators [48, 50]. The key parameters that affect the formation of the vortex are: the ratio (
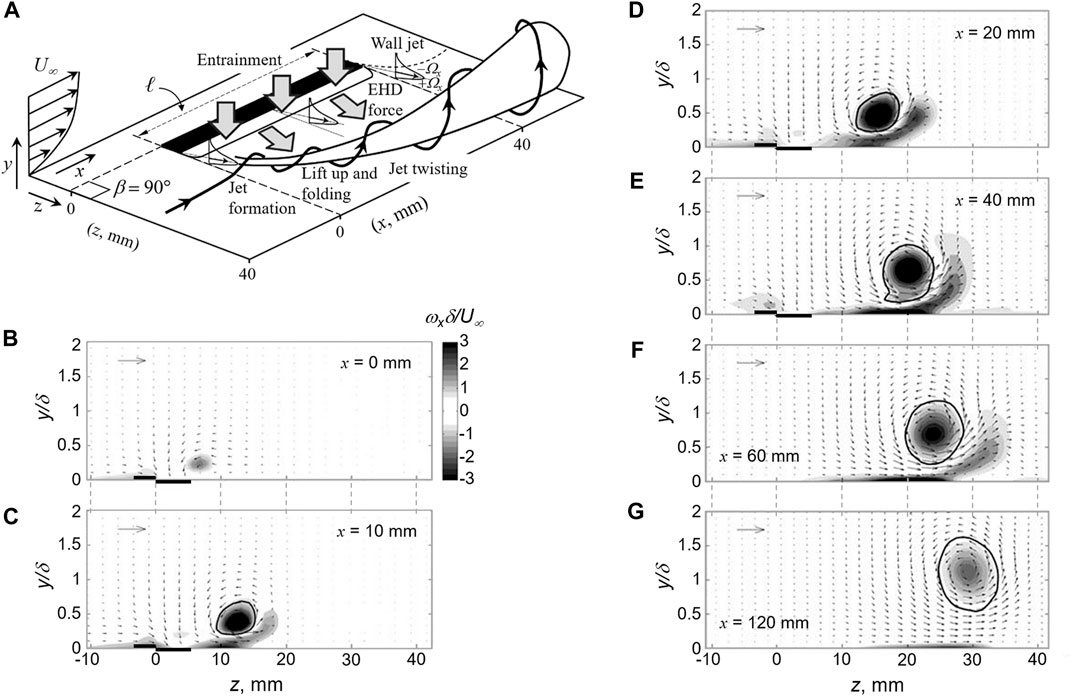
FIGURE 12. SDBD vortex generation mechanism. (A) Illustration Diagram. (B–G) Cross-sectional view of the stream-wise propagation of the vortex. Concept and data taken from (48).
In addition to vortex generators, a type of SDBD synthetic jet could also be achieved through the proper arrangement of the electrodes. Originally, synthetic jets, also known as Zero-net mass-flux (ZNMF) jets, have been generated through mechanical actuators since the 1990s and have found room in applications related to drag reduction, active flow control and heat transfer enhancement, among others [78, 79]. These actuators (see Figure 13A) employ an oscillating membrane or diaphragm to eject fluid across an orifice during one half of the oscillation cycle and entrains or suctions fluid back through the same orifice during the opposite half of the cycle. Thus, transferring a finite amount of momentum to ambient fluid, but with no net mass flow rate across the orifice over an integer number of cycles [80, 81]. In SDBD synthetic jets, on the other hand, the same objective is achieved but the momentum is added to fluid through the EHD force mechanism and no mechanical oscillation of a membrane is required. This concept was initially developed by [82] using electrodes with the shape of two concentric rings, a configuration that the authors call annular synthetic jet. The ground electrode must have a smaller radius than the exposed electrode, so that the plasma forms around the internal perimeter of the exposed electrode and the direction of the EHD force points towards de center of the ring, as shown in Figures 13B,C. An example of the instantaneous flow pattern of the annular synthetic jet, captured through Schlieren flow visualization, is presented in Figure 13D. The temporal evolution of the jet was studied through particle image velocimetry (PIV) as shown in Figures 13E–H. For the specific experiment shown in the pictures, the diameters of the exposed and buried electrodes were 5.8 cm and 3.8 cm, respectively, while the AC signal applied had an amplitude of 5 kV and frequency of 4.2 kHz. Figure 13E contains the first capture at
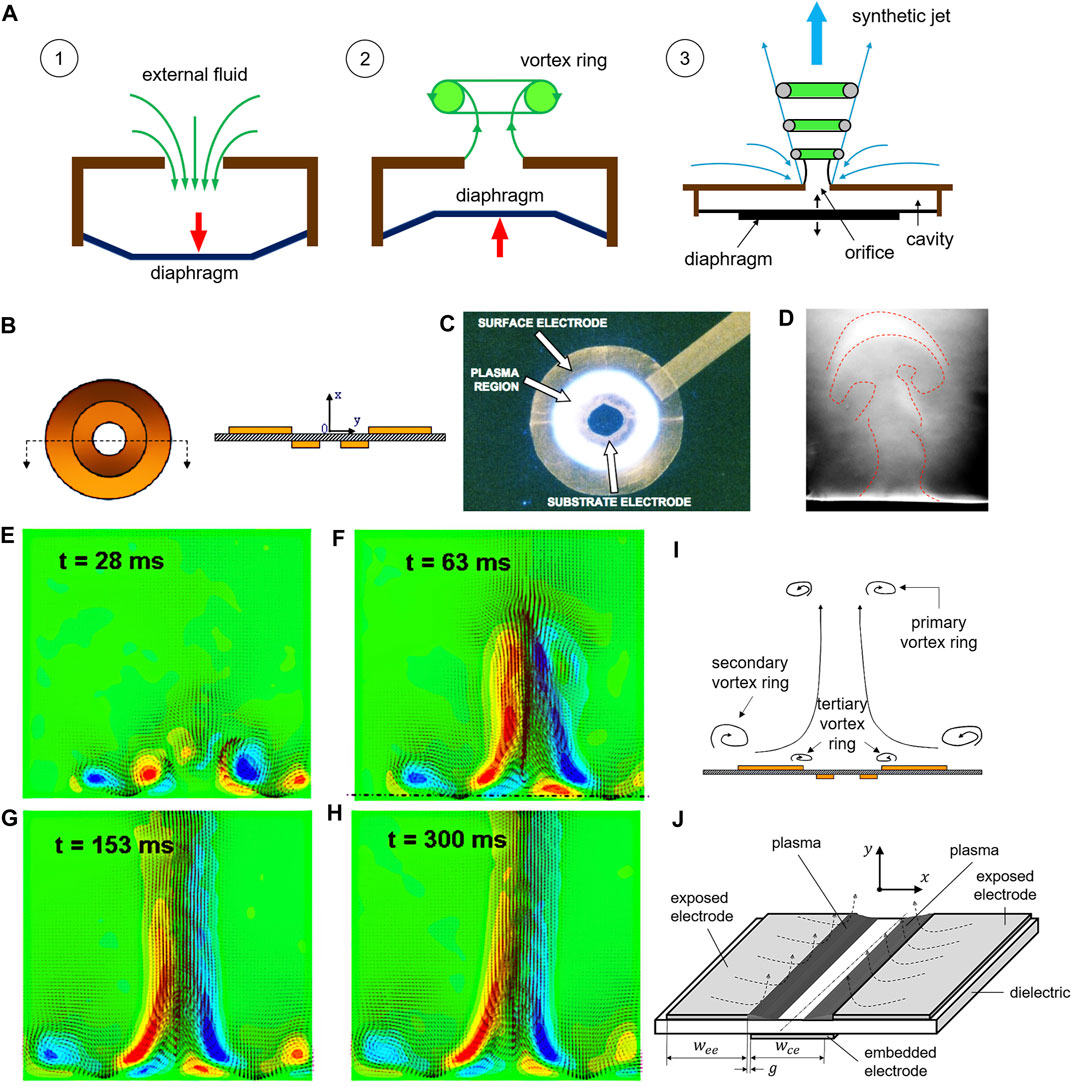
FIGURE 13. SDBD synthetic jet actuation. (A) Diagrams explaining the original mechanical synthetic jet actuators [80]. (B) Illustration of an annular SDBD synthetic jet actuator using concentric rings as electrodes. (C) Plasma region of the annular synthetic jet actuator. (D). Schlieren flow visualization. (E) (F) (G) (H) Temporal evolution of the synthetic jet at
SDBD synthetic jet actuation can also be performed through an arrangement of linear electrodes, as was demonstrated experimentally and numerically by [83], yielding similar results to the concentric rings configuration, but with lower velocities of fluid ejection, likely due the vortical structures only forming in the
4 SDBD actuation through energy transfer (shock wave)
Although AC-driven SDBD has been studied extensively as a mean of achieving active flow control, its practical use remains relegated to applications involving low flow velocities. The reason for this is that the low velocities of the ionic wind (less than 10 m/s) have proven ineffective in tackling aerodynamic problems, such as boundary layer separation, at high speeds environments like a flying aircraft [84, 85]. However, it seems that SDBD actuators driven by nanosecond (ns) pulses can have a more significant impact on high speed (even transonic) flows [86, 87]. The basic physical structure of AC-SDBD and ns-SDBD actuators is basically the same, but the principles and mechanisms of interaction with the flow are very different. While AC-SDBD actuators crate flow by adding momentum to the surrounding fluid, ns-SDBD actuators generate pressure or shockwaves that emerge from the surface into the flow. The basic working principles of both technologies are illustrated side by side in Figures 14A,B to facilitate the comparison [88].
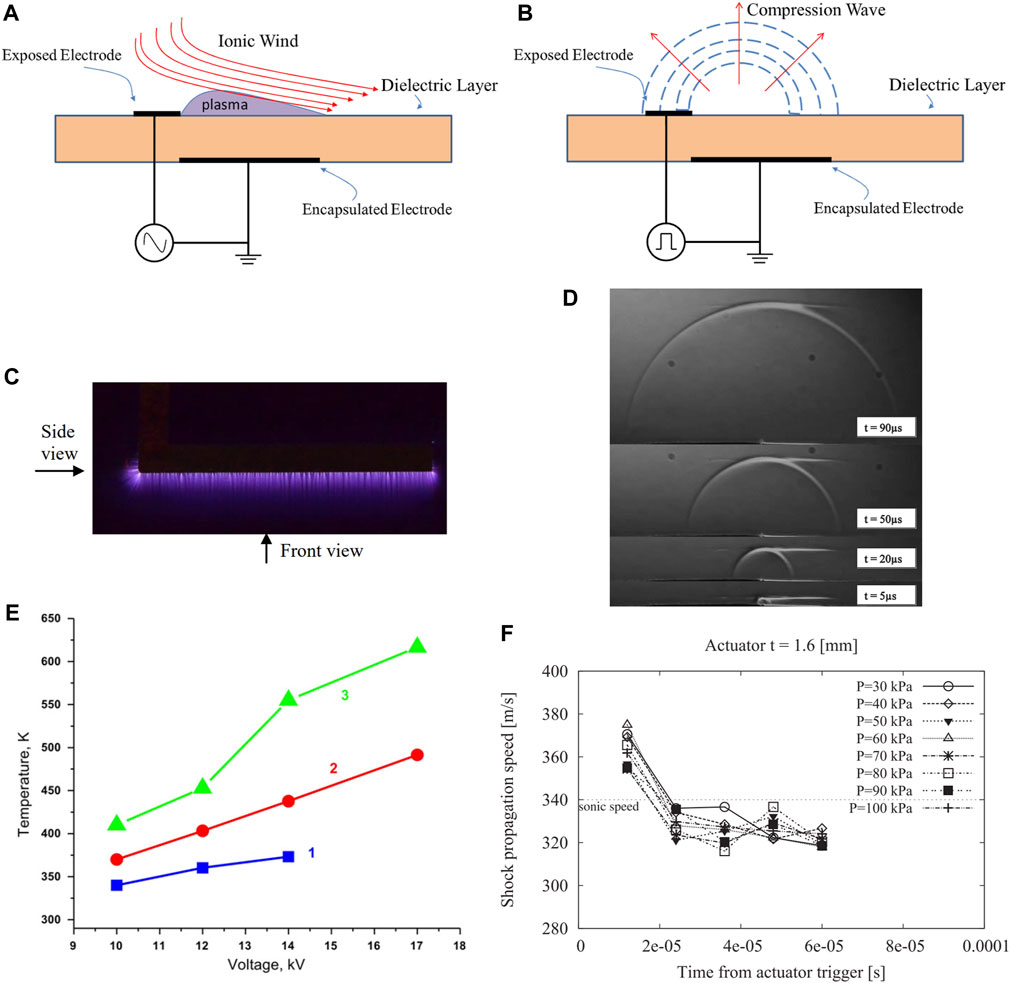
FIGURE 14. (A,B) SDBD actuators with AC power source; ns-SDBD actuator [88]. (C,D) Top view of the plasma formed along the edge of a linear ns-SDBD actuator and phase-locked Schlieren images of the shock waves generated by the same reactor (side view) [91]. (E) Gas temperature in the plasma layer as a function of the applied voltage [1]; immediately after the discharge [2]; 1µs later [3]; calculation under the assumption that the deposited energy was totally transferred into heat [89]. (F) Shock propagation speed based on the shock front location for a pressure range of 30–100 kPa; actuator thickness: 1.6 (mm) [90].
As the name implies, ns-SDBD operation requires very high voltage nanosecond pulses. The resulting discharges exhibit the same morphology discussed in section two [86, 88], with the difference that streamers in ns-SDBD generate shockwaves due to both the amount and the rate of the energy that is transferred into the plasma as heat. An example of ns-SDBD and Schlieren images of the shock waves for the same linear actuator are presented in Figures 14C,D, respectively [67]. The duration of ns-SDBD pulses could be in the order of a streamer’s lifespan; therefore, ns-SDBD streamers carry a large amount of energy that is injected into the gas as heat, while also promoting dissociation and excitation reactions. During the pulse, the temperature of the discharge zone rises by tens to hundreds of degrees Kelvin, but most of the ultrafast gas heating actually occurs after the pulse through exothermic recombination and self-quenching reactions that release more thermal energy and further increase the temperature by hundreds of degrees Kelvin [2, 89]. The gas heating region develops very fast (
Shock waves in ns-SDBD can be considered, more specifically, as blasts waves since they are formed by increasing the pressure of a very localized small gas volume through the deposition of large amounts of energy that depend on the duration and amplitude of the applied voltage. In theory, this could be achieved with any type of voltage wave form that could induce this type of localized extreme pressure difference before the adiabatic expansion of the gas, but according to numerical and experimental studies, in SDBD the total development of the hot zone takes hundreds of nanoseconds [90, 92, 93], requiring voltage pulses with duration also in the nanosecond range.
Based on the discussion above, it is natural to consider that the strength and speed of ns-SDBD shock waves is directly proportional to the energy of the pulse, typically controlled through the voltage amplitude, and inversely proportional to the rising time [94]. Other factors that seem to affect the intensity of the shockwaves are the ambient pressure and the thickness of the dielectric barrier [2]. Several studies agree that the strength or intensity of ns-SDBD shockwaves increase with ambient pressure and are inversely proportional to the dielectric barrier’s thickness [89, 90, 94].
5 On the future of SDBD technology
Technology Readiness Level (TRL) is a measurement system used to assess the maturity level of a particular technology [95]. Although it was established originally by NASA to track the progress of new technologies used in space programs, it has been expanded to analyze the evolution of other technologies in industry [96–99]. Currently there are nine technology readiness levels, the lowest being TRL 1, which refers to basic principles observed and reported, and the highest being TRL 9, which corresponds to technology already proven in operational environments and in stages of competitive manufacturing. Despite 2 decades of enthusiastic and fruitful research, the Technology Readiness Level (TRL) remains relatively low [100, 101] for SDBD actuated flow control in the aerospace industry, despite 2 decades of enthusiastic and fruitful research. The challenge is three-fold. First, there are chief concerns for employing plasma actuators in flight applications including power requirements, integration issues, weather effects, electromagnetic interference, durability and maintenance. In addition, AC-DBD that was research extensively, ultimately has proven unsuccessful for scenarios where the surrounding air moves at high velocities (>100 m/s) [102]. Second, there is the difficulty of numerically simulating SDBD actuated flow due to the disparity in the involved time and length scales ranging from molecular processes to global flight process. This calls for the development and validation of multi-scale models that can accurately predict SDBD actuated flow control with reasonable resource requirements. The third challenge lies in the development of non-intrusive measurement techniques that can accurately capture the plasma actuated aerodynamic environment which includes the electric field, gas particles, electron density and electron temperature. The third challenge lies in the development of non-intrusive measurement techniques that can accurately capture the plasma actuated aerodynamic environment which includes the electric field, gas particles, electron density and electron temperature. In terms of the electric field, there have been considerable advances in the development of non-invasive techniques to map and characterize it. For example, Stark spectroscopy, which uses the shifting and splitting of spectral lines of atoms and molecules due to the presence of an external electric field, also known as Stark effect [103] have already proven successful in helium [104, 105]. Authors have also assessed electro-optic sensors, based on Pockels effect, as tools to measure the real-time evolution of the electric field in non-equilibrium plasma formed in air and other gasses [25, 106–108], accurately obtaining even two electric field components simultaneously. The presence of the probe does not seem alter the electric field under study due to the small size and fully dielectric structure composed of a cylindrical isotropic birefringent crystal and a laser beam guided through an optic fiber. A disadvantage of this method is that it is not suitable for the measurement of a static electric field [107, 108]. Most recently, the technique known as electric-field-induced second harmonic generation or E-FISH [109, 110], was developed at Princeton University for remote optical measurements of electric fields in gases and plasmas [111, 112]. The E-FISH method allows for local measurements of electric field strength and orientation in virtually any gas or gas mixture by measuring the amount of second harmonic generated in the presence of the electric field.
Future research efforts in SDBD plasma actuators are expected to be directed towards overcoming the above-mentioned challenges with a balanced focus on application-based and fundamental research. Application-based research focuses on optimization and evaluation that can yield power-efficient, lightweight, integrable and durable actuators with collaborative efforts from the field experts in aerodynamics, plasma physics, manufacturing, electrical engineering, and material science. With regards to supersonic actuation, efforts are being concentrated on nanosecond pulse SDBD. However, EHD-based actuation still has broad room of applications in industry and biomedicine, where these characteristics could be used for cooling [41] and to improve and control the elimination of pathogens and reduction of chemical compounds, among others. A good example is the dynamic decontamination that considers SDBD actuation capabilities, and enhance decontamination through manipulation and utilization of the induced flow. Relevant work in this area includes [113], who used SDBD reactors specifically designed for the enhancement of the spatial and temporal distribution of oxygen and nitrogen species [115] to test local decontamination levels and developed integrated numerical simulation methods to predict localized or targeted decontamination. It was concluded that SDBD could be applied for decontamination of desired surface areas, thus reducing exposure times, dosage requirements of species like ozone, and energy consumption. Figures 15A–E show the distribution of decontamination of Escherichia coli across two planes of a chamber using a comb-type and a fan-type reactor. The figures show that the decontamination can be biased or uniformly distributed, just by adjusting the design of the electrodes. Other authors [114] studied the effect of using different number of linear electrodes on the internal walls of a cylindrical actuator where the decontamination takes place, as shown in Figures 15F,G. The total power was kept constant in order to isolate the influence of the number and position of the linear electrodes on the average log reduction (CFU ml−1) of Salmonella cells. Based on the results, it was determined that the flow pattern inside the cylinder resulting from the interaction of individual electrodes indeed influence decontamination, as shown in the graph of Figure 15H. Furthermore, it was noticed that a perpendicular orientation of the contaminated substrate to the plasma-induced airflow would maximize cell-damaging effects. Finally, these studies indicate that this dynamic type of decontamination could be made fully smart or intelligent by including electronic and control technology to detect the location of the decontamination target, selectively power electrodes or position the decontamination target at a proper angle or location.
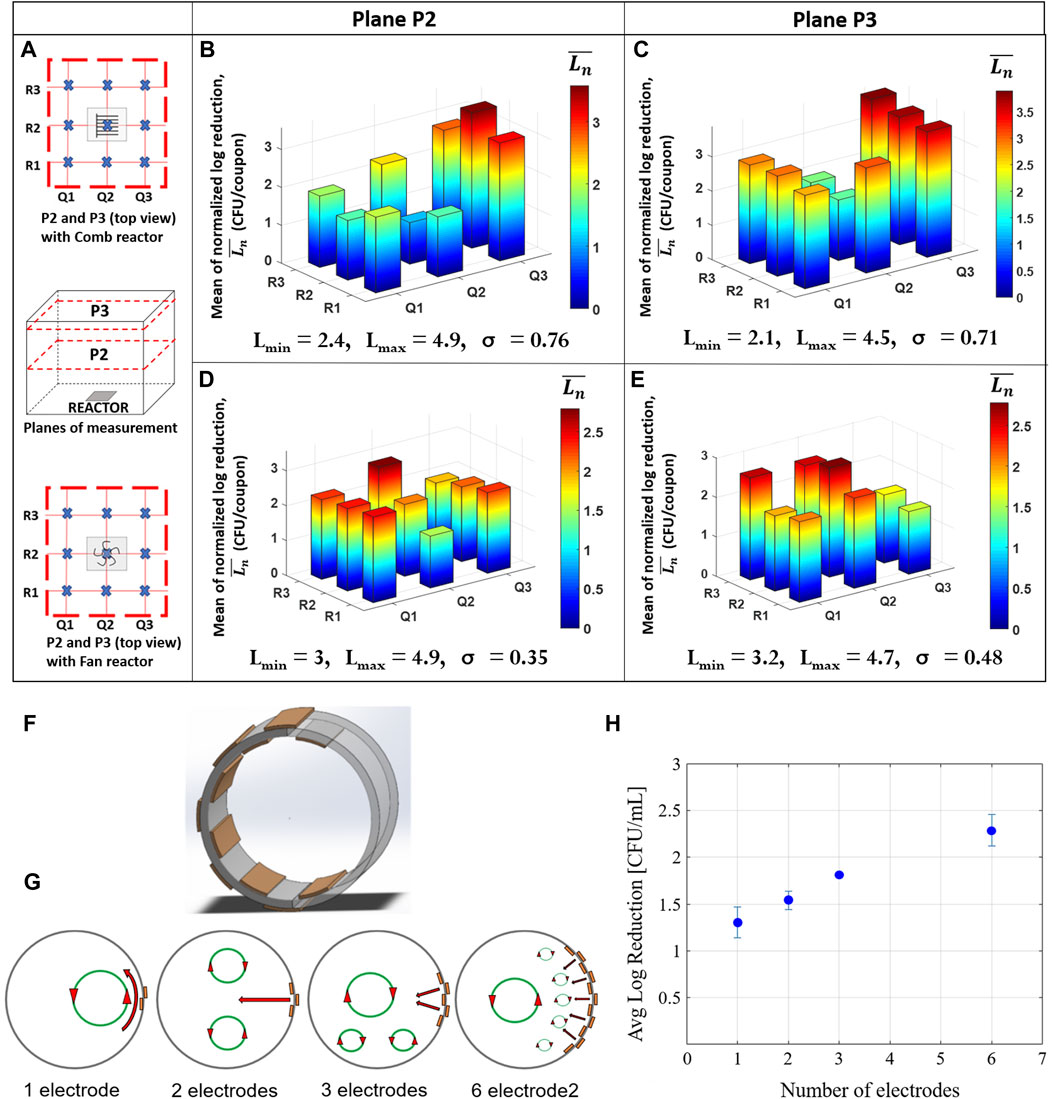
FIGURE 15. Examples of dynamic decontamination introduced in [113, 114]. (A) Measurement planes P2 and P3 with measurement grid and reactor orientation used in the study of SDBD actuated distribution of Escherichia coli decontamination inside a chamber. (B,C) Decontamination distribution using a comb-type reactor at 3.5 min in planes P2 and P3, respectively. (D,E) Decontamination distribution using a fan-type reactor at 3.5 min in planes P2 and P3, respectively. Reactor, respectively. Here, Ln: normalized log reduction; Lmin and Lmax: minimum and maximum log reduction achieved in each plane over all the repeats, respectively. σ standard deviation of the mean of normalized log reductions over the plane, indicating uniformity in decontamination distribution [113]. (F) Schematic of expected vortices from one, two, three, and six exposed electrodes in the cylindrical actuators. (G) Average log reduction (CFU ml−1) of Salmonella cells inoculated onto glass coverslips placed within SDBD actuators with one, two, three, and six electrodes and treated for 4 minutes [114].
In addition, recent works have explored the use of a multi-electrode SDBD plasma actuator, powered by a combination of DC voltage and repetitive nanosecond pulses, which self-enhances the EHD force and successfully accelerates the ionic wind with no counter wind effects. Besides the flow enhancement, the main advantage of this actuators is that do not require very high-voltage, as typical SDBD actuators do, making it more suitable for industrial applications and flow control in vehicles of low or medium speed [116].
Finally, fundamental research is expected to be performed in developing efficient and accurate computational models and measurement techniques for better understanding and subsequent designing of application specific SDBD plasma actuators. Such studies have been recently published by [101, 117–119].
Author contributions
SP and BC organized the logic structure of the information. SP wrote the first draft of the manuscript. BC and DC participated in the writing of some sections and the overall manuscript revision.
Funding
Research grant #COVID19-236 obtained through the Public Call for Rapid Response to COVID-19 in Panama, which is an initiative sponsored by the Inter-American Development Bank (IDB) and the National Secretariat of Science and Technology (SENACYT) of Panama.
Acknowledgments
SP and DC are grateful for the financial support received from the National Research System of Panama (SNI) and the administrative support received from the Centro de Estudios Multidisciplinarios en Ciencias, Ingeniería y Tecnología AIP (CEMCIT-AIP).
Conflict of interest
The authors declare that the research was conducted in the absence of any commercial or financial relationships that could be construed as a potential conflict of interest.
Publisher’s note
All claims expressed in this article are solely those of the authors and do not necessarily represent those of their affiliated organizations, or those of the publisher, the editors and the reviewers. Any product that may be evaluated in this article, or claim that may be made by its manufacturer, is not guaranteed or endorsed by the publisher.
References
1. Leonov SB, Adamovich IV, Soloviev VR. Dynamics of near-surface electric discharges and mechanisms of their interaction with the airflow. Plasma Sourc Sci Technol (2016) 25:063001. doi:10.1088/0963-0252/25/6/063001
2. Starikovskiya AY, Aleksandrovb NL. Gasdynamic flow control by ultrafast local heating in a strongly nonequilibrium pulsed plasma. Plasma Phys Rep (2021) 47(2):148–209. doi:10.1134/s1063780x21020069
3. Fridman G, Peddinghaus M, Ayan H, Fridman A, Balasubramanian M, Gutsol A, et al. Blood coagulation and living tissue sterilization by floating-electrode dielectric barrier discharge in air. Plasma Chem Plasma Process (2006) 27:425–42. doi:10.1007/s11090-006-9024-4
4. Laroussi M. Cold plasma in medicine and healthcare: The new frontier in low temperature plasma applications. Front Phys (2020) 8. doi:10.3389/fphy.2020.00074
5. Dimitrakellis P, Faubert F, Wartel M, Gogolides E, Pellerin S. Plasma surface modification of epoxy polymer in air DBD and gliding arc. Processes (2022) 10(104). doi:10.3390/pr10010104
6. Wang H, Zhang L, Luo H, Wang X, Tie J, Ren Z. Sterilizing processes and mechanisms for treatment of Escherichia coli with dielectric-barrier discharge plasma. Appl Environ Microbiol (2019) 86(1):e01907-19. doi:10.1128/aem.01907-19
7. Kogelheide F, Offerhaus B, Bibinov N, Krajinski P, Schücke L, Schulze J, et al. Characterisation of volume and surface dielectric barrier discharges in N2–O2 mixtures using optical emission spectroscopy. Plasma Process Polym (2020) 17:1900126. doi:10.1002/ppap.201900126
8. Kogelschatz U, Eliasson B, Egli W. Dielectric-barrier discharges. Principle and applications. J de Physique IV Colloque (1997) 7(C4):47–66.
9. Choi MS, Jeon EB, Kim JY, Choi EH, Lim JS, Choi J, et al. Application of dielectric barrier discharge plasma for the reduction of non-pathogenic Escherichia coli and E. coli O157:H7 and the quality stability of fresh oysters (Crassostrea gigas). LWT (2022) 112698. doi:10.1016/j.lwt.2021.112698
10. Ambrico PF, Šimek M, Rotolo C, Morano M, Minafra A, Ambrico M, et al. Surface dielectric barrier discharge plasma: A suitable measure against fungal plant pathogens. Sci Rep (2020) 10:3673. doi:10.1038/s41598-020-60461-0
11. Choudhury B, Portugal S, Mastanaiah N, Johnson J, Roy S. Inactivation of Pseudomonas aeruginosa and Methicillin-resistant Staphylococcus aureus in an open water system with ozone generated by a compact, atmospheric DBD plasma reactor. Sci Rep (2018) 8:17573. doi:10.1038/s41598-018-36003-0
12. Portugal S, Roy S, Lin J. Functional relationship between material properties, applied frequency and ozone generation for surface dielectric barrier discharges in atmospheric air. Scientific Reports-Nature Publishing (2017).
13. Panngom K, Lee SH, Park DH, Sim GB, Kim YH, Uhm HS, et al. Non-thermal plasma treatment diminishes fungal viability and up-regulates resistance genes in a plant host. PLoS ONE (2014) 9(6):e99300. doi:10.1371/journal.pone.0099300
14. Huang YM, Chen CK, Hsu CL. Non-thermal atmospheric gas plasma for decontamination of sliced cheese and changes in quality. Food Sci Technol Int (2020) 26(8):715–26. doi:10.1177/1082013220925931
15. Wang R, Hu P, Kong X, Ma G. Decomposition for chemical warfare agent sarin: Comparation between plate-to-plate and plate-to-pin dielectric barrier discharge. IEEE Trans Plasma Sci IEEE Nucl Plasma Sci Soc (2022) 50(4):863–72. doi:10.1109/tps.2022.3152492
16. Pemen AJM, Chirumamilla VR, Beckers FJCM, Hoeben WFLM, Huiskamp T. An SDBD plasma-catalytic system for on-demand air purification. IEEE Trans Plasma Sci IEEE Nucl Plasma Sci Soc (2018) 46(12):4078–90. doi:10.1109/tps.2018.2855402
17. Vandenbroucke AM, Morent R, Geyter ND, Leys C. Non-thermal plasmas for non-catalytic and catalytic VOC abatement. J Hazard Mater (2011) 195:30–54. doi:10.1016/j.jhazmat.2011.08.060
18. Bekeschus S, Pietro F, Robert E, von Woedtke T. White paper on plasma for medicine and hygiene: Future in plasma health sciences. Plasma Process Polym (2019) 16(1):1800033–12. doi:10.1002/ppap.201800033
19. Dijksteel GS, Ulrich MMW, Vlig M, Sobota A, Middelkoop E, Boekema BKHL. Safety and bactericidal efficacy of cold atmospheric plasma generated by a flexible surface Dielectric Barrier Discharge device against Pseudomonas aeruginosa in vitro and in vivo. Ann Clin Microbiol Antimicrob (2020) 19:37. doi:10.1186/s12941-020-00381-z
20. Busco G, Robert E, Chettouh-Hammas N, Pouvesle JM, Grillon C. The emerging potential of cold atmospheric plasma in skin biology. Free Radic Biol Med (2020) 161:290–304. doi:10.1016/j.freeradbiomed.2020.10.004
21. Fridman G, Shereshevsky A, Jost MM, Brooks A, Fridman A, Gutsol A, et al. Floating electrode dielectric barrier discharge plasma in air promoting apoptotic behavior in melanoma skin cancer cell lines. Plasma Chem Plasma Process (2007) 27:163–76. doi:10.1007/s11090-007-9048-4
22. Vandamme M, Robert E, Rober PS, Barbosa E, Dozias S, Sobilo J, et al. Antitumor effect of plasma treatment on U87 glioma xenografts: Preliminary results. Plasma Process Polym (2010) 7:264–73. doi:10.1002/ppap.200900080
23. Bekeschus S, Schmidt A, Weltmann KD, Tv W. The plasma jet kINPen – a powerful tool for wound healing. Clin Plasma Med (2016) 4(1):19–28. doi:10.1016/j.cpme.2016.01.001
24. Maho T, Binois R, Brulé-Morabito F, Demasure M, Douat C, Dozias S, et al. Anti-bacterial action of plasma multi-jets in the context of chronic wound healing. Appl Sci (2021) 11(20):9598. doi:10.3390/app11209598
25. Robert E, Darny T, Dozias S, Iseni S, Pouvesle JM. New insights on the propagation of pulsed atmospheric plasma streams: From single jet to multi jet arrays. Phys Plasmas (2015) 22:122007. doi:10.1063/1.4934655
26. Kim JY, Ballato J, Kim SO. Intense and energetic atmospheric pressure plasma jet arrays. Plasma Process Polym (2012) 9(3):253–60. doi:10.1002/ppap.201100190
27. Cao Z, Walsh JL, Km G. Atmospheric plasma jet array in parallel electric and gas flow fields for three-dimensional surface treatment. Appl Phys Lett (2009) 64:021501. doi:10.1063/1.3069276
28. Robert E, Sarron V, Darny T, Riès D, Dozias S, Fontane J, et al. Rare gas flow structuration in plasma jet experiments. Plasma Sourc Sci Technol (2014) 23(1):012003. doi:10.1088/0963-0252/23/1/012003
29. Morabit Y, Whalley R, Robert E, Hasan M, Walsh J. Turbulence and entrainment in an atmospheric pressure dielectric barrier plasma jet. Plasma Process Polym (2020) 17:1900217. doi:10.1002/ppap.201900217
30. Morabit Y, Hasan MI, Whalley RD, Robert E, Modic M, Walsh JL. A review of the gas and liquid phase interactions in low-temperature plasma jets used for biomedical applications. Eur Phys J D (2021) 75(32). doi:10.1140/epjd/s10053-020-00004-4
31. Darny T, Pouvesle JM, Fontane J, Joly L, Dozias S, Robert E. Plasma action on helium flow in cold atmospheric pressure plasma jet experiments. Plasma Sourc Sci Technol (2017) 26(10):105001. doi:10.1088/1361-6595/aa8877
32. Jiang N, Yang J, He F, Cao Z. Interplay of discharge and gas flow in atmospheric pressure plasma jets. J Appl Phys (2011) 109:093305. doi:10.1063/1.3581067
33. Heuer K, Hoffmanns MA, Demir E, Baldus S, Volkmar CM, Röhle M, et al. The topical use of non-thermal dielectric barrier discharge (DBD): Nitric oxide related effects on human skin. Nitric Oxide (2015) 44:52–60. doi:10.1016/j.niox.2014.11.015
34. Poggie J, McLaughlin T, Leonov S. Plasma aerodynamics: Current status and future directions. Aerospace Lab (2015) 10.
35. Enloe CL, Font GI, McLaughlin TE, Orlov DM. Surface potential and longitudinal electric field measurements in the aerodynamic plasma actuator. AIAA JOURNAL (2008) 46(11):2730–40. doi:10.2514/1.33973
36. Enloe CL, McLaughlin TE, Font GI, Baughn JW. Parameterization of temporal structure in the single-dielectric-barrier aerodynamic plasma actuator. AIAA J (2006) 44:1127–36. doi:10.2514/1.16297
37. Orlov DM, Font GI, Edelstein aD. AIAA aerospace sciences meeting and exhibit (2008). p. 3142–50. In 46thReno, NV, 7–10 January.Characterization of discharge modes of plasma actuators
38. Benard N, Moreau E. Role of the electric waveform supplying a dielectric barrier discharge plasma actuator. Appl Phys Lett (2012) 100:193503. doi:10.1063/1.4712125
39. Benard N, Moreau E. Electrical and mechanical characteristics of surface AC dielectric barrier discharge plasma actuators applied to airflow controlow control. Exp Fluids (2014) 55:1846. doi:10.1007/s00348-014-1846-x
40. Nijdam S, Teunissen J, Ebert U. The physics of streamer discharge phenomena. Plasma Sourc Sci Technol (2020) 29:103001. doi:10.1088/1361-6595/abaa05
41. Tirumala R, Benard N, Moreau E, Fenot M, Lalizel G, Dorignac E. Temperature characterization of dielectric barrier discharge actuators: Influence of electrical and geometric parameters. J Phys D Appl Phys (2014) 47:255203. doi:10.1088/0022-3727/47/25/255203
42. Benard N, Moreau E. Effects of effects of altitude on the electromechanical characteristics of a single dielectric barrier discharge plasma actuator. In: 41st plasmadynamics and lasers conference. Chicago (2010). p. 28. June - 1 July.
43. Gibalov VI, Pietsch GJ. The development of dielectric barrier discharges in gas gaps and on surfaces. J Phys D Appl Phys (2000) 33:2618–36. doi:10.1088/0022-3727/33/20/315
44. Boeuf JP, Lagmich Y, Pitchford LC. Contribution of positive and negative ions to the electrohydrodynamic force in a dielectric barrier discharge plasma actuator operating in air. J Appl Phys (2009) 106:023115. doi:10.1063/1.3183960
45. Enloe CL, McLaughlin TE, VanDyken RD, Kachner KD, Jumper EJ, Corke TC. Plasma structure in the aerodynamic plasma actuator: Plasma morphology. In AIAA Aerospace Sciences Meeting and Exhibit, 5. Reno, Nevada (2004)–8 January 2004.
46. Moreau E, Debien A, Benard N, Zouzou N. Nanosecond-Pulsed dielectric barrier discharge plasma actuator for airflow control along an NACA0015 airfoil at high Reynolds number. IEEE Trans Plasma Sci IEEE Nucl Plasma Sci Soc (2016) 44(11):2803–11. doi:10.1109/tps.2016.2603226
47. Park S, Cvelbar U, Choe W, Moon SY. The creation of electric wind due to the electrohydrodynamic force. Nat Commun (2018) 9:371. doi:10.1038/s41467-017-02766-9
48. Jukes TN, Choi KS. Dielectric-barrier-discharge vortex generators: Characterisation and optimisation for flow separation control. Exp Fluids (2011) 52:329–45. doi:10.1007/s00348-011-1213-0
49. Wang JJ, Choi KS, Feng LH, Jukes TN, Whalley RD. Recent developments in DBD plasma flow control. Prog Aerospace Sci (2013) 62:52–78. doi:10.1016/j.paerosci.2013.05.003
50. Moreau E, Da BN, Jukes T, Whalley R, Choi K, Berendt A, et al. Surface dielectric barrier discharg plasma actuators. ERCOFTAC Bull (2013) 94:5–10.
51. Debien A, Benard N, David L, Moreau E. Unsteady aspect of the electrohydrodynamic force produced by surface dielectric barrier discharge actuators. Appl Phys Lett (2012) 100:013901. doi:10.1063/1.3674308
52. Forte M, Jolibois J, Pons J, Moreau E, Touchard G, Cazalens M. Optimization of a dielectric barrier discharge actuator by stationary and non-stationary measurements of the induced flow velocity: Application to airflow control. Exp Fluids (2007) 43:917–28. doi:10.1007/s00348-007-0362-7
53. Jolibois J, Moreau E. Enhancement of the electromechanical performances of a single dielectric barrier discharge actuator. IEEE Trans Dielectr Electr Insul (2009) 16(3):758–67. doi:10.1109/tdei.2009.5128516
54. Kriegseis J, Grundmann S, Tropea C. Power consumption, discharge capacitance and light emission as measures for thrust production of dielectric barrier discharge plasma actuators. J Appl Phys (2011) 110:013305. doi:10.1063/1.3603030
55. Bernard N, Debien A, Moreau E Time-dependent volume force produced by a non-thermal plasma actuator from experimental velocity field, 46 (2013).
56. Enloe CL, McHarg MG, Font GI 47th AIAA Aerospace Siences Meeting, 5. Orlando, Florida: January (2009)–8.Plasma-induced force and self-induced drag in the dielectric barrier discharge aerodynamic plasma actuator
57. Kim W, Do H, Mm G, Cappelli MA. On the role of oxygen in dielectric barrier discharge actuation of aerodynamic flows. Appl Phys Lett (2007) 91:181501. doi:10.1063/1.2803755
58. Boeuf JP, Pitchford LC. Electrohydrodynamic force and aerodynamic flow acceleration in surface dielectric barrier discharge. J Appl Phys (2005) 97:103307. doi:10.1063/1.1901841
59. Gregory JW, Enloe CL, Font GI, McLaughlin TE. Force production mechanisms of a dielectric-barrier discharge plasma actuator. In 45th AIAA Aerospace Sciences Meeting and Exhibit, 8. Reno, Nevada (2007)–11.
60. Font G, Enloe CL, McLaughlin TE. Effect of volumetric momentum addition on the total force production of a plasma actuator. In: 39th AIAA fluid dynamics conference. San Antonio, Texas: June (2009). p. 22–5.
61. Neumann C, Friedrich J, Czarske J, Kriegseis J, Grundmann S. Determination of the phase-resolved body force produced by a dielectric barrier discharge plasma actuator. J Phys D Appl Phys (2013) 46:042001. doi:10.1088/0022-3727/46/4/042001
62. Roth JR, Dai X Proceedings of the 44th AIAA Aerospace Sciences Meeting and Exhibit, 9. Reno, Nevada (2006)–12 January 2006.Optimization of the aerodynamic plasma actuator as an electrohydrodynamic (EHD) electrical device. AIAA paper 2006-1203
63. Corke TC, Enloe CL, Wilkinson SP. Dielectric barrier discharge plasma actuators for flow control. Annu Rev Fluid Mech (2010) 42:505–29. doi:10.1146/annurev-fluid-121108-145550
64. Gao G, Dong L, Peng K, Wei W, Wu G. Comparison of the surface dielectric barrier discharge characteristics under different electrode gaps. Phys Plasmas (2017) 24:013510. doi:10.1063/1.4974037
65. Enloe CL, McLaughlin TE, VanDyken RD, Kachner KD, Jumper EJ, Corke TC, et al. Mechanisms and responses of a dielectric barrier plasma actuator: Geometric effects. AIAA J (2004) 42(3):595–604. doi:10.2514/1.3884
66. Post M, Corke T. Separation control using plasma actuators - stationary & oscillating airfoils. In: 42nd AIAA aerospace sciences meeting and exhibit. Reno: Nevada (2004).
67. Roth JR, Dai X, Rahel J, Shermann DM. The physics and phenomenology of paraelectric one atmosphere uniform glow discharge plasma (OAUGDP™) actuators for aerodynamic flow control. In: 43nd AIAA aerospace sciences meeting and exhibit. Reno, Nevada (2005). p. 10–3.
68. Thomas FO, Corke TC, Iqbal M, Kozlov A, Schatzman D. Optimization of dielectric barrier discharge plasma actuators for active aerodynamic flow control. AIAA J (2009) 47(9):2169–78. doi:10.2514/1.41588
69. Pons J, Moreau E, Touchard G. Asymmetric surface dielectric barrier discharge in air at atmospheric pressure: Electrical properties and induced airflow characteristics. J Phys D Appl Phys (2005) 38:3635–42. doi:10.1088/0022-3727/38/19/012
70. Dong B, Bauchire JM, Pouvesle JM, Magnier P, Hong D. Experimental study of a DBD surface discharge for the active control of subsonic airflow. J Phys D Appl Phys (2008) 41:155201. doi:10.1088/0022-3727/41/15/155201
71. Zhang Y, Qin T, Li J, Wu Y, Mizuno A, Shang K. Morphological image analysis of surface dielectric barrier discharge at atmospheric air. IEEE Trans Plasma Sci IEEE Nucl Plasma Sci Soc (2017) 45(11):2988–93. doi:10.1109/tps.2017.2753257
72. Riherd M, Roy S. Serpentine geometry plasma actuators for flow control. J Appl Phys (2013) 114:083303. doi:10.1063/1.4818622
73. Roy S, Wang CC. Bulk flow modification with horseshoe and serpentine plasma actuators. J Phys D Appl Phys (2009) 42:032004. doi:10.1088/0022-3727/42/3/032004
74. Wang CC, Roy S. Geometry effects of dielectric barrier discharge on a flat surface. In AIAA Aerospace Sciences Meeting including the New Horizons Forum and Aerospace Exposition, 4 - 7. Orlando, Florida (2011).
75. Durscher RJ, Roy s. Three-dimensional flow measurements induced from serpentine plasma actuators in quiescent air. J Phys D Appl Phys (2012) 45:035202. doi:10.1088/0022-3727/45/3/035202
76. Joussot R, Leroy A, Weber R, Rabat H, Loyer S, Hong D. Plasma morphology and induced airflow characterization of a DBD actuator with serrated electrode. J Phys D Appl Phys (2013) 46:125204. doi:10.1088/0022-3727/46/12/125204
77. Choi KS, Jukes TN, Whalley RD, Feng L, Wang J, Matsunuma T, et al. Plasma virtual actuators for flow control. J Flow Control Meas Visualization (2015) 3:22–34. doi:10.4236/jfcmv.2015.31003
78. Reni R, Aram E, Mittal R, Cattafesta L. Simple models of zero-net mass-flux jets for flow control simulations. Int J Flow Control (2009) 1(3):179–97. doi:10.1260/175682509789877092
79. Tuck A, Soria J. Separation control on a NACA 0015 airfoil using a 2D micro ZNMF jet. Aircraft Eng Aerospace Technol (2008) 80(2):175–80. doi:10.1108/00022660810859391
80. Strzelczyk P, Gil P. Properties of velocity field in the vicinity of synthetic jet generator. J Phys Conferece Ser (2016) 760.
81. Monir HE, Tadjfar M, Bakhtian A. Tangential synthetic jets for separation control. J Fluids Structures (2014) 45:50–65. doi:10.1016/j.jfluidstructs.2013.11.011
82. Santhanakrishna A, Jacob JD. On plasma synthetic jet actuators. In AIAA aerospace sciences meeting and exhibit, 9. Reno, Nevada (2006)–12.
83. Santhanakrishnan A, Reasor DA, LeBeau RP. Characterization of linear plasma synthetic jet actuators in an initially quiescent medium. Phys Fluids (2009) 21:043602. doi:10.1063/1.3097004
84. Nishida H, Abe T. Numerical analysis of plasma evolution on dielectric barrier discharge plasma actuator. J Appl Phys (2011) 110:013302. doi:10.1063/1.3603001
85. Little J, Takashima K, Nishihara M, Adamovich I, Samimy M. Separation control with nanosecond-pulse-driven dielectric barrier discharge plasma actuators. AIAA J (2012) 50:350–65. doi:10.2514/1.j051114
86. Benard N, Zouzou EEM, Zouzou N, Rabat H, Pons J, Hong D, et al. Nanosecond pulsed plasma actuators. ERCOFTAC Bull (2013) 94.
87. Ukai T, Kontis K. Thermal fluctuation characteristics around a nanosecond pulsed dielectric barrier discharge plasma actuator using a frequency analysis based on schlieren images. Energies (2020) 13:628. doi:10.3390/en13030628
88. Abdollahzadeh M, Páscoa JC, Oliveira PJ. Two-dimensional numerical modeling of interaction of micro-shock wave generated by nanosecond plasma actuators and transonic flow. J Comput Appl Maths (2014) 270:401–16. doi:10.1016/j.cam.2013.12.030
89. Aleksandrov NL, Kindysheva SV, Nudnova MM, Starikovskiy AY. Mechanism of ultra-fast heating in a non-equilibrium weakly ionized air discharge plasma in high electric fields. J Phys D Appl Phys (2010) 43:255201. doi:10.1088/0022-3727/43/25/255201
90. Wojewodka MM, White C, Ukai T, Russell A, Kontis K. Pressure dependency on a nanosecond pulsed dielectric barrier discharge plasma actuator. Phys Plasmas (2019) 26:063512. doi:10.1063/1.5092703
91. Cui YD, Zhao ZJ, Bouremel Y, Li J, Zheng JG, Hu FG, et al. Studies on the configurations of nanosecond DBD pulse plasma actuators. In: 19th australasian fluid mechanics conference. Melbourne, Australia (2014). p. 8–11.
92. Zheng JG, Zhao ZJ, Li J, Cui YD, Khoo BC. Numerical simulation of nanosecond pulsed dielectric barrier discharge actuator in a quiescent flow. Phys Fluids (2014) 26:036102. doi:10.1063/1.4867708
93. Correale G, Michelis T, Ragni D, Kotsonis M, Scarano F. Nanosecondpulsed plasma actuation in quiescent air and laminar boundary layer. J Phys D Appl Phys (2014) 47:105201. doi:10.1088/0022-3727/47/10/105201
94. Benard N, Zouzou N, Claverie A, Sotton J, Moreau E. Optical visualization and electrical characterization of fast-rising pulsed dielectric barrier discharge for airflow control applications. J Appl Phys (2012) 111:033303. doi:10.1063/1.3682568
95. Conrow E. Estimating technology readiness level coefficients. J Spacecraft Rockets (2011) 48(1):146–52. doi:10.2514/1.46753
96. Dovichi Filho FB, Castillo Santiago Y, Silva Lora EE, Escobar Palacio JC, Almazan del Olmo OA. Evaluation of the maturity level of biomass electricity generation technologies using the technology readiness level criteria. J Clean Prod (2021) 126426. doi:10.1016/j.jclepro.2021.126426
97. Tomaschek K, Olechowski A, Eppinger S, Joglekar N. A survey of technology readiness level users. INCOSE Int Symp (2016) 26:2101–17. doi:10.1002/j.2334-5837.2016.00283.x
98. Buchner G, Stepputat K, Zimmermann A, Schomäcker R. Specifying technology readiness levels for the chemical industry. Ind Eng Chem Res (2019) 58(17):6957–69. doi:10.1021/acs.iecr.8b05693
99. Fahimian M, Behdinan K. On characterization of technology readiness level coefficients for design. In: Proceedings of the 21st international conference on engineering design (ICED 17) vol 2: Design processes. Vancouver: Design Organisation and Management (2017). p. 309–16. Canada 21-25 08.
100. Cheng Z, Huang B, Luo Z, Che X, Yan P, Shao T. Atmospheric-pressure pulsed plasma actuators for flow control: Shock wave and vortex characteristics. Plasma Sourc Sci Technol (2019) 28(6):064001. doi:10.1088/1361-6595/ab094c
101. Sujar-Garrido P, Becerra M, Örlü R. Efficiency assessment of a single surface dielectric barrier discharge plasma actuator with an optimized Suzen–Huang model. Phys Fluids (2022) 34(4):047110. doi:10.1063/5.0087395
102. Little J, Singh A, Ashcraft T, Durasiewicz C. Post-stall flow control using nanosecond pulse driven dielectric barrier discharge plasma actuators. Plasma Sourc Sci Technol (2019) 28:014002. doi:10.1088/1361-6595/aaf52f
103. Gu B, Boxer SG. Stark spectroscopy: Applications in Chemistry, biology, and materials science. Annu Rev Phys Chem (1997) 48(1):213–42. doi:10.1146/annurev.physchem.48.1.213
104. Obradovića BM, Ivković SS, Km M. Spectroscopic measurement of electric field in dielectric barrier discharge in helium. Appl Phys Lett (2008) 92(19):191501. doi:10.1063/1.2927477
105. Ivkovic SS, Obradovic BM, Kuraica MM. Electric field measurement in a DBD in helium and helium–hydrogen mixture. J Phys D Appl Phys (2012) 45:275204. doi:10.1088/0022-3727/45/27/275204
106. Gaborit G, Jarrige P, Lecoche F, Dahdah J, Duraz E, Volat C, et al. Single shot and vectorial characterization of intense electric field in various environments with pigtailed electrooptic probe. IEEE Trans Plasma Sci IEEE Nucl Plasma Sci Soc (2014) 42(5):1265–73. doi:10.1109/tps.2014.2301023
107. Iseni S. Mapping the electric field vector of guided ionization waves at atmospheric pressure. Plasma Res Express (2020) 2:025014. doi:10.1088/2516-1067/ab9b69
108. Dozias S, Pouvesle JM, Robert E.Comment on ‘Mapping the electric field vector of guided ionization waves at atmospheric pressure. Plasma Res Express (2020). p. 3.
109. Chng TL, Naphade M, Goldberg BM, Adamovich IV, Starikovskaia SM. Electric field vector measurements via nanosecond electric-field-induced second-harmonic generation. Opt Lett (2020) 45(7):1942–5. doi:10.1364/ol.45.001942
110. Zhao Y, Fuji T. Two-dimensional free space electric field imaging using electric field induced second harmonic generation. Opt Lett (2022) 47:2999–3002. doi:10.1364/ol.460742
111. Dogariu A, Goldberg BM, O’Byrne S, Miles RB. Species-independent femtosecond localized electric field measuremen. Phys Rev Appl (2018) 7(2).
112. Goldberg BM, Chng TL, Arthur D, Miles RB. Electric field measurements in a near atmospheric pressure nanosecond pulse discharge with picosecond electric field induced second harmonic generation. Appl Phys Lett (2018) 112:064102. doi:10.1063/1.5019173
113. Choudhury B, Portugal S, Roy S, Mastro E, Johnson JA. Smart dielectric barrier discharge plasma decontamination: Spatially targeted decontamination with actuated ozone distribution. Front Phys (2022) 10. doi:10.3389/fphy.2022.834030
114. Ngo AD, Pai K, Timmons C, Ma LM, Jacob J. Evaluation of cylindrical asymmetric surface dielectric barrier discharge actuators for surface decontamination and mixing. Plasma (2021) 4:755–63. doi:10.3390/plasma4040038
115. Portugal S, Choudhury B, Lilley A, Charters C, Porrello C, Lin J, et al. A fan-shaped plasma reactor for mixing enhancement in a closed chamber. J Phys D Appl Phys (2020) 53:22LT01. doi:10.1088/1361-6463/ab7e64
116. Sato S, Furukawa H, Komuro A, Takahashi M, Ohnishi N. Successively accelerated ionic wind with integrated dielectric-barrierdischarge plasma actuator for lowvoltage operation. Sci Rep (2019) 9:5813. doi:10.1038/s41598-019-42284-w
117. Zhao L, Xiao Z, Liu F. Simulation of flow induced by single-dielectric-barrier-discharge plasma actuator using a high-order flux-reconstruction scheme. Phys Fluids (2021) 33(4):047108. doi:10.1063/5.0046900
118. Wilde ND, Xu H, Gomez-Vega N, Barrett SR. A model of surface dielectric barrier discharge power. Appl Phys Lett (2021) 118(15):154102. doi:10.1063/5.0043339
Keywords: SDBD, EHD force, nanosecond pulse, electrode geometry, induced velocity
Citation: Portugal S, Choudhury B and Cardenas D (2022) Advances on aerodynamic actuation induced by surface dielectric barrier discharges. Front. Phys. 10:923103. doi: 10.3389/fphy.2022.923103
Received: 18 April 2022; Accepted: 03 August 2022;
Published: 08 September 2022.
Edited by:
Andrey Starikovskiy, Princeton University, United StatesReviewed by:
Eric Robert, UMR7344 Groupe de recherches sur l'énergétique des milieux ionisés (GREMI), FranceV S, University of Chemistry and Technology in Prague, Czechia
Copyright © 2022 Portugal, Choudhury and Cardenas. This is an open-access article distributed under the terms of the Creative Commons Attribution License (CC BY). The use, distribution or reproduction in other forums is permitted, provided the original author(s) and the copyright owner(s) are credited and that the original publication in this journal is cited, in accordance with accepted academic practice. No use, distribution or reproduction is permitted which does not comply with these terms.
*Correspondence: Dorindo Cardenas, ZG9yaW5kby5jYXJkZW5hc0B1dHAuYWMucGE=
 Sherlie Portugal
 Bhaswati Choudhury
 Dorindo Cardenas