- 1Texas A and M University, College Station, TX, United States
- 2National University of Mongolia, Ulaanbaatar, Mongolia
- 3Mississippi State University, Starkville, MS, United States
- 4Baylor University, Waco, TX, United States
- 5Princeton University, Princeton, NJ, United States
We investigate quantum beats by monitoring cooperative emission from rubidium vapor and demonstrate correlated beats via coupled emission channels. We develop a theoretical model, and our simulations are in good agreement with experimental results. The results pave the way for advanced techniques measuring interactions between atoms that are excited to high energy levels.
1 Introduction
Quantum coherence plays important roles in many advances in quantum detection and control techniques in the recent two decades, such as coherent anti-Stokes Raman scattering (CARS) spectroscopy [1, 2], multidimensional Fourier transform spectroscopy [3], wave packet control of atoms and molecules [4–6], and quantum interference control of photocurrent [7], due to the fact that optical interference can reveal the quantum pathways in which the system evolves. Quantum computers also heavily rely on coherent manipulation of quantum states, for e.g., in atomic, ionic, and superconducting circuit qubits [8–10]. These systems use dipole–dipole interactions to simulate many-body physics. Thus, it is important to measure the interactions of atomic/ionic systems at different energy states. Recent works using double-quantum two-dimensional coherent spectroscopy were able to detect long-range dipole–dipole interactions in low-density atomic vapors [11]. It has also been demonstrated that by comparing the shape, including broadening and sidebands, of the Fourier spectra of measured quantum beat patterns to theoretical models, the number of atoms involved in dipole–dipole interactions can be characterized for an excited atomic ensemble [12]. Most importantly, this method provides a possible route to measure dipole–dipole interactions at many highly excited states. Therefore, improving quantum beat measurements for highly excited atomic systems is of great interest.
Many of these quantum beating experiments [12–15] were carried out in pump–probe configurations. Typically, a laser pulse is split into two with different intensities; the stronger one is used as the pump pulse and the other as the probe. The delay between the pump and probe pulses is scanned to obtain a beat pattern. At the density of atoms (or molecules) at which quantum beats are observed, the first few or ten picoseconds of the coherent optical signals exhibit exponential decay envelopes. This is attributed to superfluorescence (SF) processes, where the single-pass gain is large enough to overcome dephasing in a population inverted system, and a build-up polarization results in a burst of emission [16, 17]. In this work, we present experimental data to determine a time scale for this process, based on our previous studies of SF processes in the same atomic system and other systems [18, 31]. Furthermore, because we used two beams at different wavelengths for the pump and drive/probe pulses, which effectively couple much lower energy levels, we were able to see some transitions which are weak or negligible in other experiments, e.g., in [19].
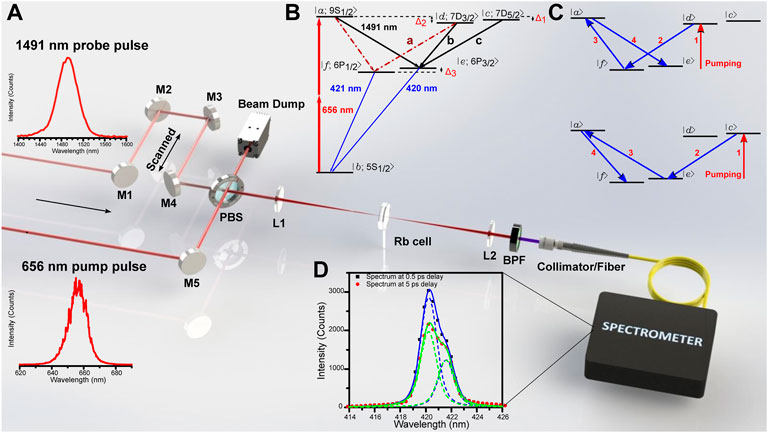
We investigate multichannel quantum beats via the 420 nm and 421 nm radiation from an atomic vapor of 87Rb, and relevant energy levels are shown in Figure 1B. The atoms are two-photon excited from 5S to both 9S and 7D levels by ultrashort laser pulses with a broadband spectrum centered at 656 nm, and Δ’s are angular frequency differences between energy levels. The broadband drive pulses centered at 1491 nm couple the fine structure levels of 9S and 7D to those of 6P. According to selection rules, all transitions from 9S and 7D to 6P are dipole-allowed, except the 7D5/2 → 6P1/2 transition. The sum rule [20] tells us that the transition intensity of the three labeled ones from 7D to 6P in the figure is a : b : c = 5 : 1 : 9. If we imagine that transition b is absent, one can see that when the delay between pump and drive pulses is scanned, the beat frequency Δ1/2π can be seen on the 420 nm transition, while the 421 nm transition can show the beat frequency of Δ2/2π. Furthermore, since the two channels are coupled through levels 9S (and weakly via 7D3/2), multi-photon processes, as shown in Figure 1C, are revealed through the beat frequency of (Δ2 − Δ1)/2π. All these happen in a typical SF time scale of ∼ 20 picoseconds. In the following sections of this article, we will discuss these aspects in detail. In Sections 2, 3, we describe the experimental setup and results. Section 4 is devoted to a theoretical model of multichannel beat processes. An approximate formula for beat intensity is derived using the fourth-order time-dependent perturbation theory. We summarize the experimental and theoretical results in the last section.

FIGURE 1. (A) Experimental schematics for observing the multichannel quantum beats. The pump (656 nm) and the probe (1491 nm) laser pulses were collinearly combined and focused into the rubidium (Rb) cell. Normalized spectra of the input pulses are shown as they are generated from OPAs. M1–M5 are mirrors. PBS is a Pellicle beamsplitter. BPF is a band-pass filter centered at 420 nm with full width at half maximum (FWHM) of 10 nm. (B) Simplified energy level diagram of 87Rb. Broadband pump pulses excite atoms from 5S to both 9S and 7D levels; probe pulses couple 9S and 7D levels to 6P levels. (C) Illustrations of fourth-order quantum paths, which result in exchanging transition probabilities of the two 6P fine structure levels and beat pattern’s envelope oscillations as discussed in the text. (D) Spectra of the emission (black and red dots) measured at a delay time of 0.5 and 5 ps between pump and probe pulses; two distinguishable lines (dashed lines) at 420 and 421 nm are fitted to each spectrum. The solid lines are the sum of the fitted Voigt profiles.
2 Experimental methods
The experimental setup is shown in Figure 1A. Femtosecond laser pulses with wavelengths centered at 656 and 1491 nm were collinearly focused into a thin rubidium vapor cell. The cell is made of sapphire which allows a high temperature operation. It has a cylindrical shape with a total length of 5.3 mm, two 1.7-mm-thick windows, and a diameter of 1 inch. Rb vapor fills the 1.9-mm-long space sandwiched between the windows. The generated signal was analyzed using a spectrometer (HR4000, Ocean Optics). The pump (656 nm) and drive (1491 nm) laser pulses were generated from two optical parametric amplifiers (OperA, Coherent) pumped by 800 nm, 30 fs laser pulses from a Ti:sapphire femtosecond laser system (Legend, Coherent) with a 1-kHz repetition rate. Both pulses were linearly polarized, with the same polarization. The pulse energy of each beam was controlled using a reflective-type continuous variable neutral density filter. The probe beam was retro-reflected by a pair of mirrors mounted on a digitally controlled translation stage (Newport) to precisely adjust the time delay between pump and drive pulses. Both beams were collinearly combined by a pellicle beamsplitter (PBS) and were focused using a lens with 200 mm focal length into the Rb cell. The cold reservoir of the cell was kept at 214 °C, and the number density of 87Rb atoms was estimated to be 1.3 × 1015 cm−3 [21].
3 Experimental results and discussion
The spectra of the coherent emission in the forward direction are shown in Figure 1D. They were obtained with an average pump power at 2.0 mW and 0.5 mW of the drive at two different delay times between pump and drive pulses. As we scan the delay, two peaks clearly change their intensities; thus, we fit each spectrum by double peaks of Voigt profiles. In the fitting, the two peaks share the same line widths, while the positions and intensities of two peaks plus a constant baseline are independent parameters. Both spectra show fitted peaks at 420.2 and 421.6 nm which match the exact values of the transitions [22] within the calibration accuracy (0.1 nm) of our spectrometer. The fitted spectral width of the Voigt profiles is 1.5 nm; thus, it is not limited by the resolution (0.35 nm) of our spectrometer. A similar spectrum was taken at every step while the translation stage was scanned.
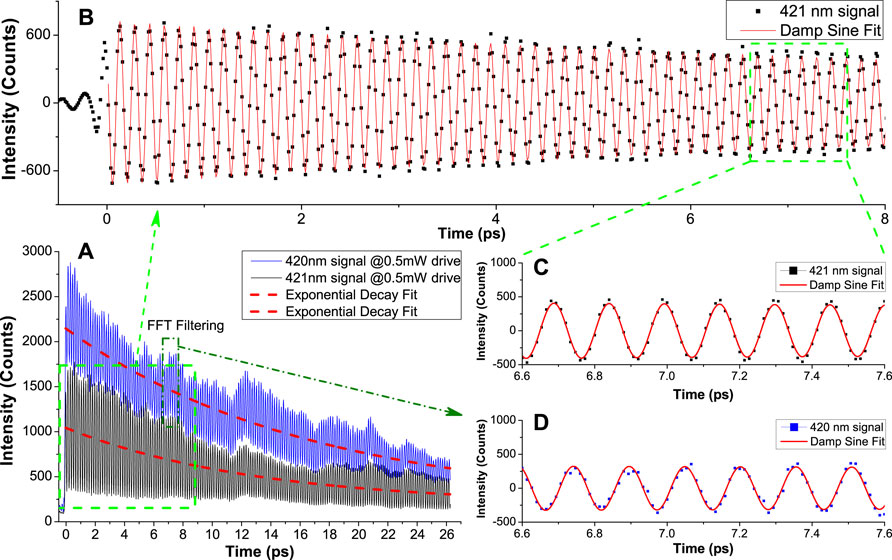
To resolve the beat frequencies, we used a small step size of 2 μm, which is equivalent to 0.0133 ps time delay. In order to see a large time scale decay curve, we also scanned with a 10 times larger step size, corresponding to 0.133 ps per step. A sample of the typical data scanned with a smaller step size is shown in Figure 2A. These data are fitted by a single exponential decay curve, and on average, we get a 16.14 ps decay time constant which closely matches to the delay time of the SF signal (17.5 ps) from our previous work [18]. There are two time constants associated with SF processes: the collective damping time τr governs the SF pulse width, and the delay time τD tells how much time the system takes to evolve before emitting an SF pulse. Our data suggest that τD is a qualitative measure of the decay time of the beating pattern. A good match between the two time scales is reasonable because amplified spontaneous emission (ASE) rises from the population inversion between upper levels (9S and 7D levels) and intermediate levels (6P, and 8P, 7P, 5P) after the atoms are optically pumped. If there is enough single-pass gain (in other words, enough number of excited atoms within a wavelength range), the emission will evolve into SF [16, 17]. Coherence in the atomic ensemble builds up, and after some delay time, a burst of light is emitted from the atoms. This argument rises naturally as many quantum beat experiments mentioned previously rely on the detection of the SF or yoked SF [23] signal(s).

FIGURE 2. Experimental data with fitted functions. (A) Long-range scanned data with a time resolution of 0.0133 ps. Solid lines represent the measured data, and dashed red lines are fitted exponential decay curves. The fitted curves give an average decay time of 16.14 ps. (B) Fast Fourier transform (FFT) filtered 421 nm data (black dots) fitted to a damped sine curve (red line) in a 10 ps time window. The DC offset is removed by the FFT filtering. (C) Zoomed-in window as shown in the green dashed box. (D) Data of 420 nm signal (blue dot and line) and fitted damped sine curve (red line) in the same time window as (C).
To extract a clear beat pattern, we performed a fast Fourier transform (FFT) filtering which filters the decay and the dc offset components. A typical sample of the processed data is shown in Figure 2B. To find the beat frequency, we fit the data to a damped sine function of the form
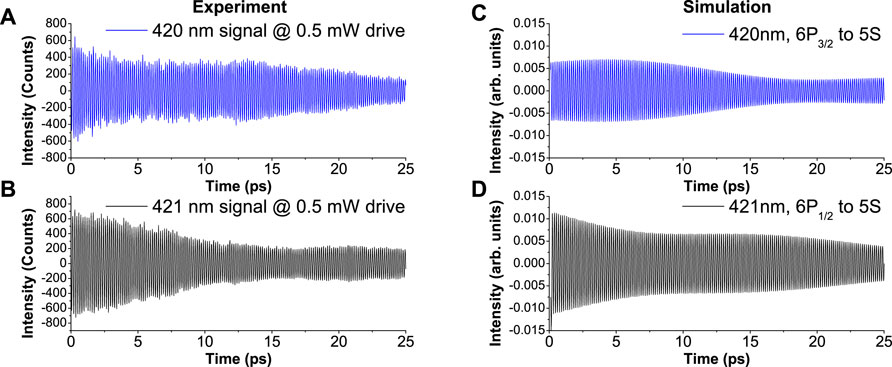
After an FFT filtering of the longer scan data shown in Figure 2A, the beat pattern shows an overall envelope with two features: an exponential decay and an oscillation with a frequency of 46 GHz, which matches to the fine structure splitting of 7D. Figure 3 exhibits the experimental results together with simulations demonstrating both features. The exponential decay of this envelope is carried from the overall decay of the signals. The reason of this oscillation is understood as follows. By closely inspecting the energy diagram (Figure 1), it is obvious for the 420 nm signal to carry a frequency of 46 GHz, since both levels of 7D are involved in its quantum path. However, questions arise are: how can the 421 nm signal also carry this frequency? Is it from the coupling via 9S? To answers these questions, we employ the following theoretical model.

FIGURE 3. Slow varying envelopes of the beats of 420 and 421 nm signals. (A) Blue and (B) black are experimental data after an FFT high-pass filtering used to remove the DC and exponential decay components from the raw data. (C) Blue and (D) black are numerical simulations for the corresponding transitions to (A) and (B), both labeled with wavelength and color-coded to match the experimental results.
4 Theoretical model and interpretations
For the 6-level system as shown in Figure 1B, the atom–field effective interaction Hamiltonian can be written as [24, 25]:
where we assume Gaussian pulses such that
where ej and fj (j = 0, 1, 2) are constants. e2 and f1 are explicitly written as:
where we change the indices order in the complex conjugate of the Rabi frequency such that
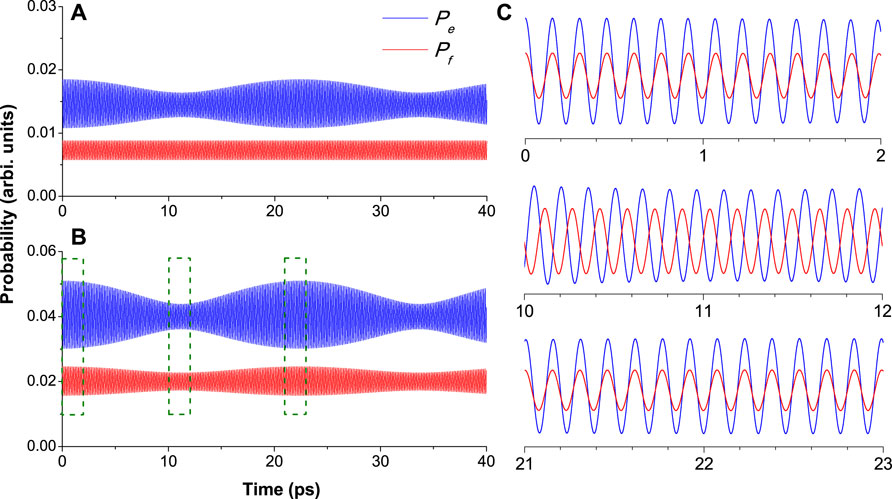
We plot the probability of finding atoms on level |e⟩ (Pe) and level |f⟩ (Pf) with parameters shown in Figure 4. For conditions e1 ≫ e2 and f1 ≪ f2, one can verify that probabilities Pe and Pf oscillate at angular frequencies Δ1 and Δ2, respectively. Therefore, e1 and f2 terms in Eq. 2 give fast oscillations, as shown in resolved time windows in Figure 4C. Moreover, because the frequencies are different, we can also see that the relative phase of the beat oscillation shifts as the delay time increases. The expression which only keeps up to second-order terms is plotted in Figure 4A, where the envelope modulation of Pf is absent; while the plot using expression with fourth-order terms clearly shows the modulation on Pf and a larger modulation depth on Pe. We conclude that the e2 and f1 terms in Eqs. 3 and 4 cause the envelope modulation shown in the analytical results (Figure 4B) and the experimental results (Figure 3). Furthermore, the main reasons for the envelope oscillation are the fourth-order processes coupled through the |a⟩ state (9S1/2) as well as other processes in Eqs. 3 and 4. To see this more clearly, let us set

FIGURE 4. (A) Probabilities of finding atoms on level |e⟩ (Pe)and level |f⟩ (Pf) plotted from analytical expressions up to second-order terms. (B) Same probabilities plotted with the expressions up to fourth-order terms. The envelope modulation of Pf is a result of multi-photon (
5 Conclusion
In this work, we demonstrate that the beat pattern of the 421 nm signal is much less disturbed by other quantum pathways, and it is potentially a better candidate for the technique described in Ref. [12] to characterize dipole–dipole interactions. In general, F = 1/2 levels have less coupled upper levels due to selection rules; thus, they can be used to obtain cleaner beat patterns for sensing dipole–dipole interactions. In addition, this technique requires a long time scan (
It is also possible to detect the beat pattern by monitoring the transmission of the infrared probe [14] as well as X-ray absorption [28], as long as different quantum pathway interferences at a common final state are realized [24, 29]. Controls of the beat pattern and thus the quantum path have been studied in our group by shifting the pump wavelength [15] or adding a control pulse [4]. In the present case, a shift of the pump beam central wavelength would tune the amplitudes and initial phase of the beat pattern. While our current system is based on OPAs, new laser sources can provide an extended wavelength range to cover more transition wavelengths and give more control of the sources, such as different frequency generation sources that extend to mid-infrared and a versatile single-laser platform that combines a short-pulse laser source with a tunable broadband wavelength converter based on a highly non-linear photonic-crystal fiber (PCF), which was recently demonstrated for single-beam dual-color two-photon spectroscopy [30].
In conclusion, we investigate coherent emissions at 420 and 421 nm in 87Rb. We observed quantum beats at different frequencies on these two emissions as we scan the delay between pump and drive pulses. The profiles were measured, and numerical simulations based on a theoretical model are compared with the experimental results. Our results suggest that the SF delay time is a good measure of the exponential decay of the beating envelope. With the help of the time-dependent perturbation method, a higher order (five-photon) process was identified from the beat envelope of the 421 nm emission. The results pave the way for detecting dipole–dipole interactions of atoms at highly excited states.
Data availability statement
The original contributions presented in the study are included in the article/Supplementary Material; further inquiries can be directed to the corresponding authors.
Author contributions
ZY, GA, and MS conceived the work; ZY conducted the experiment and collected the data; ZY, GA, and AS analyzed the data; TB, ZY, AZ, and MS developed the theoretical model and simulations. TB wrote the code. All authors wrote the manuscript.
Funding
We gratefully acknowledge support of the Air Force Office of Scientific Research (Award No. FA9550-20-1-0366 DEF), the National Science Foundation (Grant No. PHY-2013771), and the Robert A. Welch Foundation (Award A-1261, A-1547, and A-1801). TB thanks the funding from the National University of Mongolia (P2021-4180).
Acknowledgments
We would like to thank Anatoly A. Svidzinsky and Moochan Kim for their helpful discussions.
Conflict of interest
The authors declare that the research was conducted in the absence of any commercial or financial relationships that could be construed as a potential conflict of interest.
Publisher’s note
All claims expressed in this article are solely those of the authors and do not necessarily represent those of their affiliated organizations, or those of the publisher, the editors, and the reviewers. Any product that may be evaluated in this article, or claim that may be made by its manufacturer, is not guaranteed or endorsed by the publisher.
Supplementary material
The Supplementary Material for this article can be found online at: https://www.frontiersin.org/articles/10.3389/fphy.2022.921499/full#supplementary-material
References
1. Pestov D, Murawski RK, Ariunbold GO, Wang X, Zhi M, Sokolov AV, et al. Optimizing the laser-pulse configuration for coherent Raman spectroscopy. Science (2007) 316:265–8. doi:10.1126/science.1139055
2. Traverso AJ, Hokr B, Yi Z, Yuan L, Yamaguchi S, Scully MO, et al. Two-photon infrared resonance can enhance coherent Raman scattering. Phys Rev Lett (2018) 120:063602. doi:10.1103/physrevlett.120.063602
3. Li H, Bristow AD, Siemens ME, Moody G, Cundiff ST. Unraveling quantum pathways using optical 3D Fourier-transform spectroscopy. Nat Commun (2013) 4:1390. doi:10.1038/ncomms2405
4. Yuan L, Pestov D, Murawski RK, Ariunbold GO, Zhi M, Wang X, et al. Tracking molecular wave packets in cesium dimers by coherent Raman scattering. Phys Rev A (2012) 86:023421. doi:10.1103/physreva.86.023421
5. Brinks D, Hildner R, van Dijk EMHP, Stefani FD, Nieder JB, Hernando J, et al. Ultrafast dynamics of single molecules. Chem Soc Rev (2014) 43:2476–91. doi:10.1039/c3cs60269a
6. Svidzinsky AA, Eleuch H, Scully MO. Rabi oscillations produced by adiabatic pulse due to initial atomic coherence. Opt Lett (2017) 42:65. doi:10.1364/ol.42.000065
7. Wang K, Muniz RA, Sipe JE, Cundiff ST. Phys Rev Lett (2019) 123:067402. doi:10.1103/physrevlett.123.067402
8. Ebadi S, Wang TT, Levine H, Keesling A, Semeghini G, Omran A, et al. Quantum phases of matter on a 256-atom programmable quantum simulator. Nature (2021) 595:227–32. doi:10.1038/s41586-021-03582-4
9. Egan L, Debroy DM, Noel C, Risinger A, Zhu D, Biswas D, et al. Fault-tolerant control of an error-corrected qubit. Nature (2021) 598:281–6. doi:10.1038/s41586-021-03928-y
10. Song C, Xu K, Li H, Zhang Y-R, Zhang X, Liu W, et al. Generation of multicomponent atomic Schrödinger cat states of up to 20 qubits. Science (2019) 365:574–7. doi:10.1126/science.aay0600
11. Yu S, Titze M, Zhu Y, Liu X, Li H. Long range dipole-dipole interaction in low-density atomic vapors probed by double-quantum two-dimensional coherent spectroscopy. Opt Express (2019) 27:28891. doi:10.1364/oe.27.028891
12. Shen F, Gao J, Senin AA, Zhu CJ, Allen JR, Lu ZH, et al. Many-body dipole-dipole interactions between excited Rb atoms probed by wave packets and parametric four-wave mixing. Phys Rev Lett (2007) 99:143201. doi:10.1103/physrevlett.99.143201
13. Blanchet V, Nicole C, Bouchene M-A, Girard B. Temporal coherent control in two-photon transitions: From optical interferences to quantum interferences. Phys Rev Lett (1997) 78:2716–9. doi:10.1103/physrevlett.78.2716
14. Zhu CJ, Xiao Y, Senin AA, Gao J, Eden JG, Varzhapetyan TS, et al. Quantum beating in Rb at 18.3 THz (608cm^{− 1}) detected by parametric six-wave mixing and sum-frequency generation in LiIO_ {3}. Phys Rev A (2007) 75:053405. doi:10.1103/physreva.75.053405
15. Ariunbold GO, Sautenkov VA, Scully MO. Switching from a sequential transition to quantum beating in atomic rubidium pumped by a femtosecond laser. J Opt Soc Am B (2011) 28:462. doi:10.1364/josab.28.000462
16. Maki JJ, Malcuit MS, Raymer MG, Boyd RW, Drummond PD. Influence of collisional dephasing processes on superfluorescence. Phys Rev A (1989) 40:5135–42. doi:10.1103/physreva.40.5135
17. Yuan L, Hokr BH, Traverso AJ, Voronine DV, Rostovtsev Y, Sokolov AV, et al. Theoretical analysis of the coherence-brightened laser in air. Phys Rev A (2013) 87:023826. doi:10.1103/physreva.87.023826
18. Yi Z, Jha PK, Yuan L, Voronine DV, Ariunbold GO, Sinyukov AM, et al. Observing the transition from yoked superfluorescence to superradiance. Opt Commun (2015) 351:45–9. doi:10.1016/j.optcom.2015.04.035
22. Sansonetti JE. Wavelengths, transition probabilities, and energy levels for the spectra of rubidium (Rb I through Rb XXXVII). J Phys Chem Reference Data (2006) 35:301–421. doi:10.1063/1.2035727
23. Brownell JH, Lu X, Hartmann SR. Yoked superfluorescence. Phys Rev Lett (1995) 75:3265–8. doi:10.1103/physrevlett.75.3265
25. Zubairy AHMS, Zubairy MS. Validity of the effective Hamiltonian in the two-photon atom-field interaction. Phys Rev A (1992) 45:4951–9. doi:10.1103/physreva.45.4951
26. Svidzinsky AA, Chang J-T, Scully MO. Exact solution of gradient echo memory and analytical treatment of gradient frequency comb. Phys Rev A (2010) 81:053821. doi:10.1103/PhysRevA.81.053821
27. Xia H, Svidzinsky AA, Yuan L, Lu C, Suckewer S, Scully MO. Phys Rev Lett (2012) 109:093604. doi:10.1103/physrevlett.109.093604
28. Guimarāes F, Gelmukhanov F, Cesar A, Ågren H. Quantum wave packet revivals in IR + X-ray pump–probe spectroscopy. Chem Phys Lett (2005) 405:398. doi:10.1016/j.cplett.2005.02.061
29. Drühl MOK, Drhl K. Quantum eraser: A proposed photon correlation experiment concerning observation and "delayed choice" in quantum mechanics. Phys Rev A (1982) 25:2208–13. doi:10.1103/physreva.25.2208
30. Chebotarev AS, Lanin AA, Raevskii RI, Kostyuk AI, Smolyarova DD, Bilan DS, et al. Single-beam dual-color alternate-pathway two-photon spectroscopy: Toward an optical toolbox for redox biology. J Raman Spectrosc (2021) 52:1552–60. doi:10.1002/jrs.6183
Keywords: ultrafast spectroscopy, quantum beat, rubidium, quantum interference, quantum coherence
Citation: Yi Z, Begzjav TK, Ariunbold GO, Zheltikov AM, Sokolov AV and Scully MO (2022) Multiple pathway quantum beat spectroscopy. Front. Phys. 10:921499. doi: 10.3389/fphy.2022.921499
Received: 15 April 2022; Accepted: 12 July 2022;
Published: 19 August 2022.
Edited by:
Omar Magana-Loaiza, Louisiana State University, United StatesReviewed by:
Freddy Fernandes Guimaraes, Universidade Federal de Goiás, BrazilBo-Han Wu, University of Arizona, United States
Copyright © 2022 Yi, Begzjav, Ariunbold, Zheltikov, Sokolov and Scully. This is an open-access article distributed under the terms of the Creative Commons Attribution License (CC BY). The use, distribution or reproduction in other forums is permitted, provided the original author(s) and the copyright owner(s) are credited and that the original publication in this journal is cited, in accordance with accepted academic practice. No use, distribution or reproduction is permitted which does not comply with these terms.
*Correspondence: Zhenhuan Yi, eXpoQHRhbXUuZWR1; Marlan O. Scully, c2N1bGx5QHRhbXUuZWR1
 Zhenhuan Yi
 Tuguldur Kh. Begzjav1,2
 Gombojav O. Ariunbold
 Marlan O. Scully