- 1Department of Nephrology, Children’s Hospital of Fudan University, Shanghai, China
- 2Shanghai Kidney Development and Pediatric Kidney Disease Research Center, Shanghai, China
- 3Shanghai Key Lab of Birth Defect, Children’s Hospital of Fudan University, Shanghai, China
- 4Department of Radiology, Children’s Hospital of Fudan University, Shanghai, China
- 5School of Communication and Information Engineering, Shanghai University, Shanghai, China
- 6Department of Urology, Children’s Hospital of Fudan University, Shanghai, China
- 7Data Management Center, Children’s Hospital of Fudan University, Shanghai, China
- 8State Key Laboratory of Medical Neurobiology, Institutes of Brain Science and School of Basic Medical Science, Fudan University, Shanghai, China
Background: Assessment of renal lesions and deficiency accurately remains critical in the diagnosis of congenital anomalies of the kidneys and urinary tracts (CAKUT) in children. Advanced imaging such as Magnetic resonance Imaging (MRI) and Diffusion weighted Imaging (DWI) allows structural and functional insufficiency to be detected. Currently, radiomics machine learning models are being explored as full-automated diagnostic tools. We aimed to develop a machine learning integrated radiomics model to predict renal anomalies and deficiency in children.
Methods: A retrospective study of 280 children with MRI/DWI were enrolled between 2018 and 202 at a children’s hospital. A total of 1,037 radiomics features were extracted from the DWI images of each participant, which were divided into training set and test set (8:2 split). Using 5-fold cross-validated method, multiple machine learning algorithms were employed to predict renal lesions and deficiency when compared with the radiologist’s diagnosis based on DWI, 99mTc-labeled dimercaptosuccinic acid (DMSA) SPECT cortical renal scintigraphy or 99mTc-labeled diethylenetriamine pentaacetate (DTPA) renal scan.
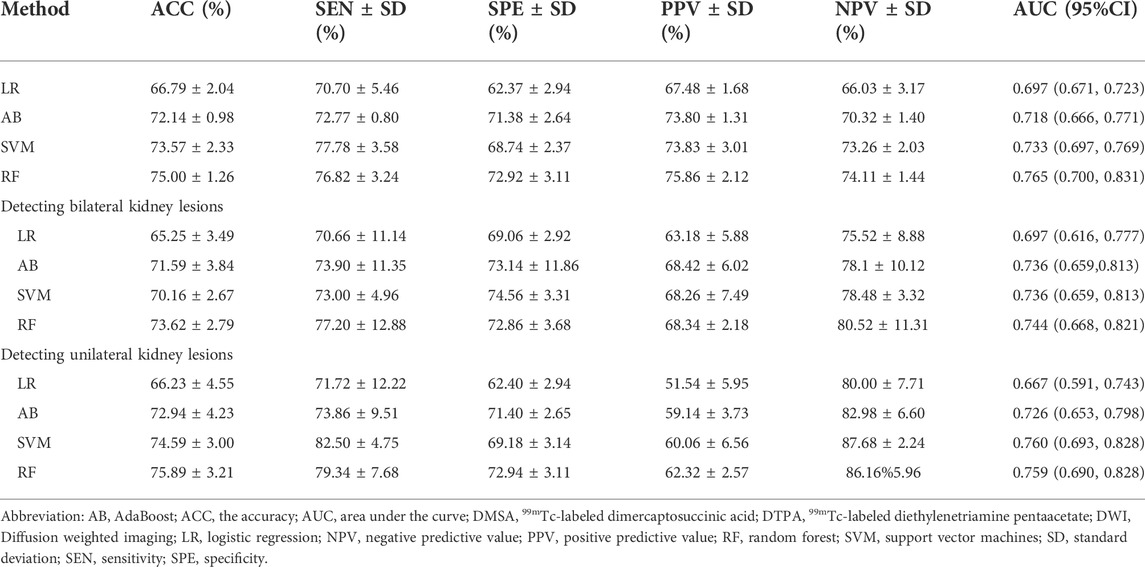
Results: For detecting the kidney lesions, the LASSO + Random Forest algorithm outperformed other classifiers with an accuracy of 0.750 (95% confidence interval, 0.734–0.766) and area under the curve (AUC) of 0.765 (95% confidence interval, 0.700–0.831). The performance of classifiers did not show a significant difference (p > 0.05) in detecting bilateral or unilateral kidney lesions by DWI scanning. The classifiers performed significantly better in bilateral kidney deficit than in unilateral kidney deficit (p < 0.05). We next built prediction models for renal deficiency using the radiomics signature and clinical features compared to renal scintigraphy. The ensemble model had a high-test accuracy of 80.9% ± 4.2% and a sensitivity of 91.7% ± 7.1% with a moderate calibration.
Conclusion: An ensemble model integrated with DWI-radiomic and clinical features can be utilized to predict renal lesions and deficiency in children with CAKUT.
Introduction
Congenital anomalies of the kidneys and urinary tracts (CAKUT) account for roughly 20% of all birth defects [1]. CAKUT is not only associated with urinary tract infection (UTI), but also increases the risk of renal deficit in febrile UTI. CAKUT affects around 5 per 1,000 live births, accounting for 30%–50% chronic kidney disease (CKD) in children [2]. Therefore, early diagnosis of kidney anomalies and renal deficits is critical for CAKUT heath improvement.
Advanced imaging, including ultrasound, magnetic resonance imaging (MRI), and scintigraphy, allow for the retrieval of structural, functional, and molecular information that may be used to identify changes in renal tissue properties and functionality [3]. Diffusion weighted imaging (DWI) is a non-invasive magnetic resonance modality, which uses the motion of water molecules as a contrast to measure in vivo movement of water diffusion or Brownian motion. It reflects the microstructure of the tissue by describing the water restriction and diffusivity within this tissue. DWI has been described as a reliable biological marker of renal interstitial fibrosis, renal perfusion alterations or water handing [4]. Nevertheless, DWI quantification involves a lot of manual procedures, making it time consuming and observer dependent, limiting its clinical utility. Radiomics is a new tool for diagnosing renal disease that has been utilized successfully for renal cancer, diabetic nephropathy, polycystic kidney disease, and urolithiasis differentiation [5–8]. Radiomics is a method designed to retrieve a large number of quantitative features from medical images to aid diagnostic reasoning [9]. We hypothesized that DWI-based radiomics might be developed as a diagnostic assistance for CAKUT.
For early detection the renal deficiency before a loss of kidney function estimated with serological test, there is great interest in developing novel methods that can be used to detect renal deficiency in children at an early stage. Here we present a novel machine learning model for predicting renal anomalies and deficiency in children based on DWI radiomics and clinical features.
Materials and methods
Study population and clinical features
After receiving approval from the Research Ethics Board of Children’s Hospital of Fudan University (NO. 2018-286), a total of 280 pediatric patients (age below 18 years old) were recruited in the study between January 2018 and December 2020. All participants and/or their legal guardians were fully informed about the study’s aims and provided their written and/or verbal consent prior to the examination. The inclusion criteria were 1) age under 18 years old, 2) MRI including T1-weighted, T2-weighted and DWI were available, 3) the image quality was adequate for analysis, no motion or artifacts.
Basic clinical information included patients’ age at examination, gender, and initial manifestation of urinary tract infection (UTI). Based on the diagnosis of DWI scanning from 3 independent senior radiologists, all the participants were divided into two groups: kidney lesions and non-lesion detected by MRI/DWI. Kidney function decline was defined as an abnormal value of split renal function using 99mTc-labeled dimercaptosuccinic acid (DMSA) SPECT cortical renal scintigraphy or 99mTc-labeled diethylenetriamine pentaacetate (DTPA) renal scan [10, 11]. Figure 1 showed the flowchart for the study.
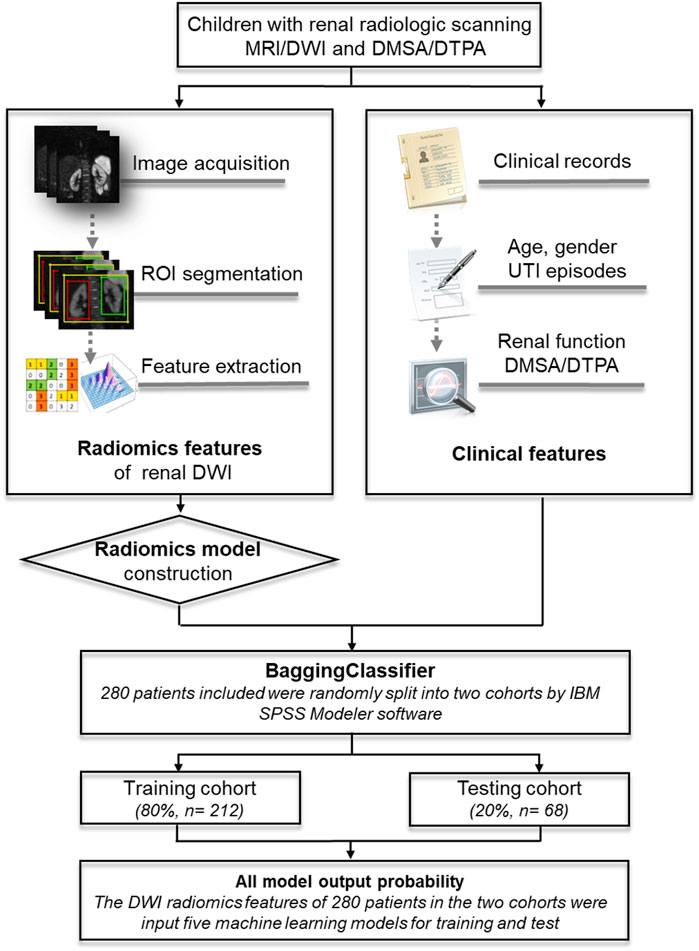
FIGURE 1. An illustration of the machine learning models based on DWI-radiomics in children. MRI, magnetic resonance imaging; DWI, Diffusion weighted imaging; DMSA, 99mTc-labeled dimercaptosuccinic acid SPECT cortical renal scintigraphy; DTPA, 99mTc-labeled diethylenetriamine pentaacetate renal scan.
Image processing
A 1.5-T MRI scanner (Avanto, Siemens Healthcare, Germany) was used. Signal reception was conducted with a six-element body matrix coil and 12-element design of the inbuilt spine matrix coil. During the scanning process, the individuals were required to lie flat on the examination bed, maintain free breathing, and keep their body motionless with sedation if necessary. The scan was performed by an experienced MR technician. Conventional coronal T2WI, axial T1WI, T2WI, and DWI sequences were performed. DWI applied a single-shot echo planar imaging (EPI) sequence with free-breathing. Chemical shift artifacts can be reduced by fat saturation technique. The images were acquired using a diffusion-weighted single shot echo-planar imaging fat saturated sequence. The repetition time (ms)/echo time (ms) was 3300/57; the flip angle was 90°; the results of two excitations were averaged; the field of view was 30 × 30 cm; the matrix size was 128 × 128; 10 coronal slices were acquired with a thickness of 4 mm; the parallel imaging (ASSET) factor was 3; and the acquisition time was 180 s. The b-values ranged from 0 to 700 (0, 10, 20, 50, 100, 180, 300, 420, 550, 700). Renal lesions identified by MRI/DWI include simple cysts, solid/mixed solid cysts, renal cortical defects, and local/diffuse signal intensity changes (high/low) in renal parenchymal.
All the images of MRI/DWI scanning were retrieved in DICOM format at their original dimensions and resolution. Two readers (a radiologist with 4 years of body MRI expertise and a medical student with MRI anatomy training) manually delineated the rectangular 2D ROI that included kidney slice by slice on a coronal DWI image, and then an experienced radiologist checked all the ROIs. The largest 2D ROI was then automatically selected by a self-developed software, and then used as the mask for all the slices that included kidney regions. After extracting the region in the mask of each slice, a cubic 3D ROI (or named VOI) was obtained by stacking all these slices from a DWI image. The 3D ROI from each DWI image was then used for further radiomics analysis.
Radiomics feature extraction and feature selection
We employed an open-source python package called “PyRadiomics” to extract radiomic features from the DWI images, and all the results were collected in a form. The radiomics features were classified into 10 categories: First-order statistics (n = 18), shape (n = 14), texture derived from GLCM (n = 24), texture derived from GLSZM (n = 16), texture derived from GLRLM (n = 16), texture derived from GLDM (n = 14), texture derived from NGTDM (n = 5), wavelet-based features (n = 744), exponential-based features (n = 93), and logarithm-based features (n = 93) (Supplementary Table S1). Each feature was named by concatenating the image type from which the feature was extracted, feature group and feature name. For example, original_shape_Elong- ation was a feature extracted from the original image, shape group, and the feature name was Elongation.
In the feature selection, we first performed t-test analysis to pick features and those with p values < 0.05 were selected. The two independent sample t-test is used to test whether the mean and distribution of the two independent samples are significantly different. Several features involved averages in the two sets of samples of normal and abnormal patients, and the t-test was used to determine whether these features are substantially different. If there are significant differences, they can be reserved for classification tasks and this feature will be removed if there is no significant difference. T-test analysis was followed by the Lasso feature selection method, aiming to remove irrelevant features before classification. Lasso regression is based on ordinary least squares with L1 regular expression, the L1 regular expression is used to prevent the model from overfitting. Lasso can transform the value of irrelevant features into 0, thereby performing feature reduction and selecting important features for classification tasks.
Radiomics model construction and performance evaluation
To predict kidney lesions or deficiency, DWI-radiomics features were fed into four distinct models. We utilized the machine learning classifiers including Logistic Regression (LR), AdaBoost (AB), Support Vector Machines (SVM), and Random Forest (RF) from the same splits of patients to train and test on DWI features. All these classifiers were imported from a Python (version 3.6.5) machine learning library named scikit-learn (version 20.3). Models were trained with a batch size of 16. Early stopping was used with the patience parameter set to 50; finally, each model was allowed a maximum of 500 epochs of training if it was never stopped early. After 100 training trials, the model with the best validation accuracy was selected. During training, a predetermined probability of 0.5 was assigned to the final sigmoid activation neuron as a threshold for the classification of kidney lesion. The models were trained to maximize the accuracy of the model prediction. We split the training data set into five equally-sized parts, each exhibiting the same class distribution, and then the five-fold cross-validation was used to tune hyper-parameters.
The performance of the radiomics classifiers was firstly compared with that by radiologist diagnosis based on the DWI imaging data. It was subsequently compared with the diagnosis of kidney function decline according to the split renal function (SRF) estimated by DMSA or DTPA. To assess the performance of the classification, the accuracy (ACC), sensitivity (SEN), specificity (SPE), positive predictive value (PPV), negative predictive value (NPV), and the area under the curve (AUC) of its ROC curve with 95% confidence interval (95% CI) were calculated as evaluation (Supplementary Table S2). The classification results were expressed by the format of mean ± standard deviation (SD) over repeated runs. The confidence interval was calculated using the adjusted Wald method. p-values were calculated using a binomial test. A p-value of 0.05 was considered as the threshold for significance.
Development, performance of a clinical–radiomics model
To predict renal deficiency, a bagging classifier combined the clinical variable with radiomics signature to build an ensemble model. SPSS modeler (version 8.0, IBM) software randomly selected 80% of the dataset as the training group and 20% of the data as the test group to verify the trained model. Firstly, the five classifiers, including logistic regression (LR), decision tree (C5.0), SVM, neural network (Nnet), and RF were unutilized separately. To fit the weights of the models with 5-fold cross validation, we split the data into 5 subsets of roughly equal size and interactively used 4 subsets for interfold training and the fifth subset for interfold testing. We set the parameters as follows to enhance the performance of each classifier: Boosting was used in the C5.0 algorithm to improve model accuracy; binomial logistic regression with backward selection was used in the LR model; the polynomial function kernel was used as the kernel of the SVM; multilayer perceptron (MLP) networks were employed in Nnet; the MLP undersampling balanced training set was aggregated using the bagging ensemble method; 100 random tree number in RF model with the max feature included all the features input; the multi-model approach of ensemble is realized by combining the prior models employed. Predictive performance was assessed using the AUC with 95%CI of its receiver operating characteristic (ROC AUC) curve and precision recall curve (PR AUC), SEN, SPE, PPV, NPV, and ACC. We compared the concordance between the renal deficiency as assessed by the best classifier in the five machine learning algorithms and radiological diagnosis of SRF. The DeLong method was used to compare the AUCs of the machine learning classifiers. A power calculation was performed to ensure that the test data set was sufficient to assess the AUC estimated from the training group.
Statistical analysis
All the statistical analysis was performed using SPSS (version 25.0, IBM, Armonk, New York) and SPSS Modeler (version 18.0). Graph was created using SPSS Modeler and GraphPad prism 8.3.0. To compare the differences in count data, Pearson’s chi-squared test or Fisher’s exact test were used. Statistical significance was defined as a p-value of less than 0.05. In the training set and testing set, the performance of the machine learning models was assessed with respect to their discrimination and calibration. The ROC AUC was calculated to assess the discrimination of the models, while the calibration was evaluated with the Hosmer-Lemeshow test. Cohen’s kappa value was used to analyze the concordance between the best classifier and the radiologist’s assessment of renal anomalies or deficiency. PASS v18 was used for sample size estimation (2018, NCSS, LLC. Kaysville, Utah, United States. www.ncss.com) and “Tests for One ROC Curve” function was used to perform the power calculation.
Results
Participants clinical characteristics
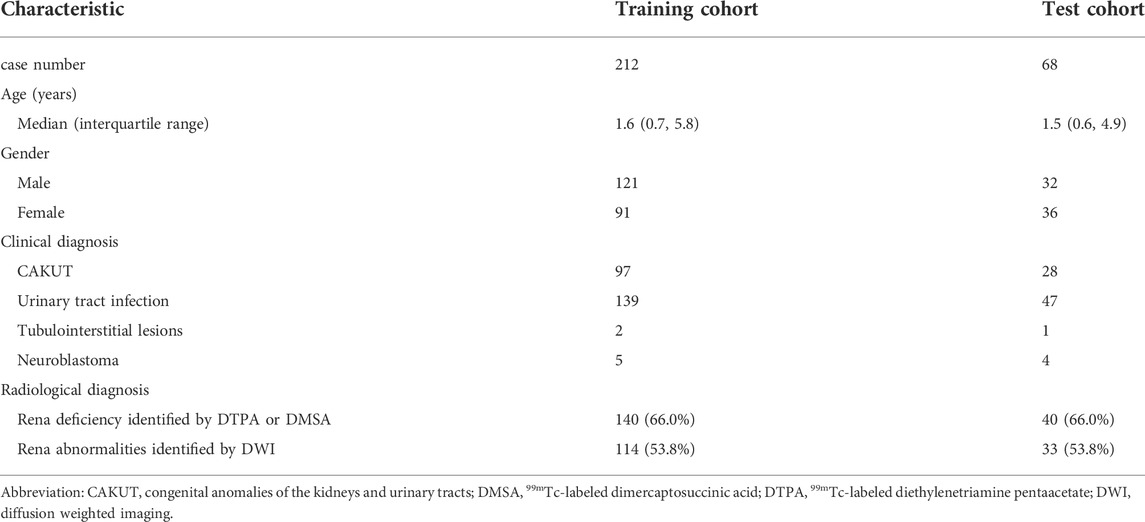
A total of 280 participants were enrolled in this study. There were 125 cases diagnosed with CAKUT initially, 140 cases diagnosed with UTI without CAKUT, 9 with neuroblastoma and 3 cases with tubulointerstitial lesions. Among the 186 participants with UTI history, 104 cases with only one episode of UTI, 32 cases with two episodes of UTI, and 50 cases with more than three episodes of UTI prior to the MRI/DWI scanning. The characteristics of the training and testing cohort were summarized in Table 1. There was no statistically significant difference in the clinical features between the two cohorts (Pearson test, p > 0.05).
Radiomics signature building and performance evaluation
Totally, 1,037 radiomics features were retrieved from each participant’s DWI images. The Lasso feature selection approach was performed to identify the top ten radiomics features. The unsupervised clustering of these features was shown as a heat map (Figure 2). Univariate analysis revealed the top ten features in Supplementary Table S2. We selected the ten key features in the training set based on the regression algorithm in the fivefold cross-validation studies.
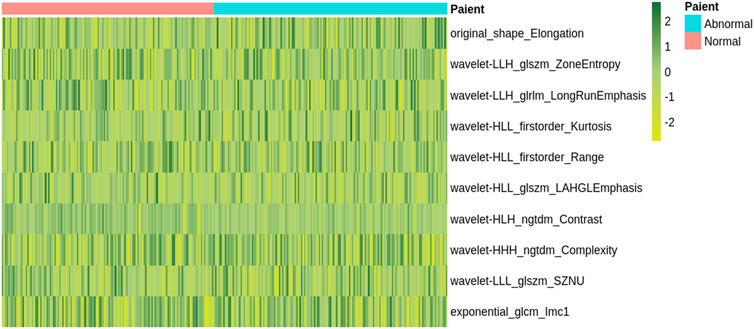
FIGURE 2. A heatmap shows the radiomic features. Each column and row correspond to one patient and z-score normalized radiomic feature, respectively.
Based on the radiomics feature selection methods, the performance of the radiomics classifiers compared with the expert evaluation on DWI were presented in Table 2. With a ROC AUC of 0.765 (95% CI, 0.700–0.831) and ACC of 0.750 (95%CI, 0.734–0.766), the selection method LASSO + RF algorithm outperformed other classifiers for identifying the kidney lesions. We examined the classifiers’ predictive performance in patients with bilateral or unilateral kidney lesions (Figure 3). None of the classifiers showed a significant better performance in detecting the bilateral kidney lesions compared with unilateral lesions (p > 0.05, respectively, Table 2; Figure 3).
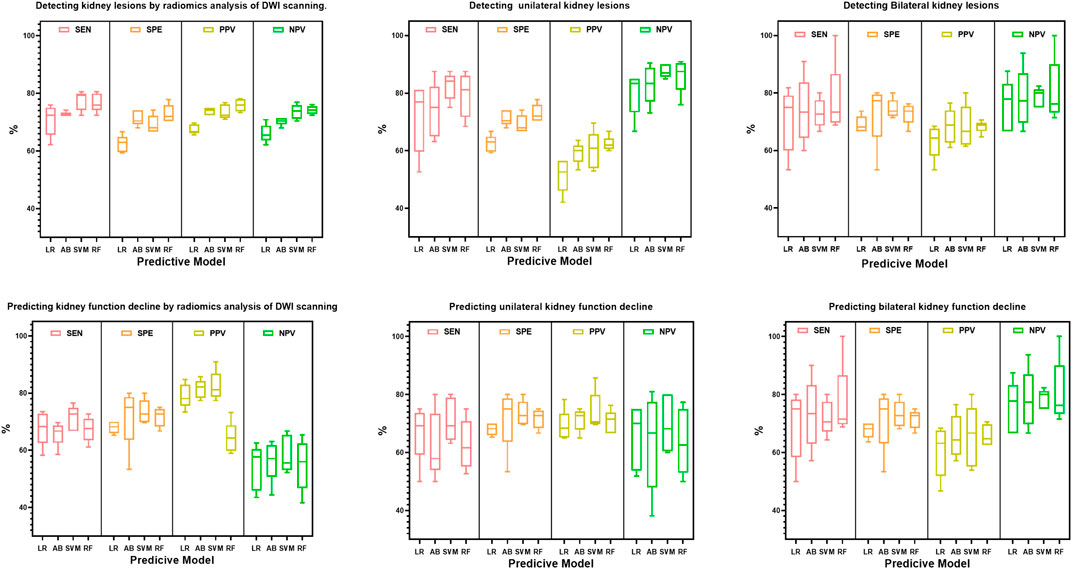
FIGURE 3. Box plot distributions of sensitivity (SEN), specificity (SPE), positive predictive value (PPV) and negative predictive value (NPV) under radiomics models for the prediction of bilateral or unilateral kidney lesions. The four machine learning classifiers including Logistic Regression (LR), AdaBoost (AB), Support Vector Machines (SVM) and Random Forest (RF) from the same splits of patients to train and test on DWI features.
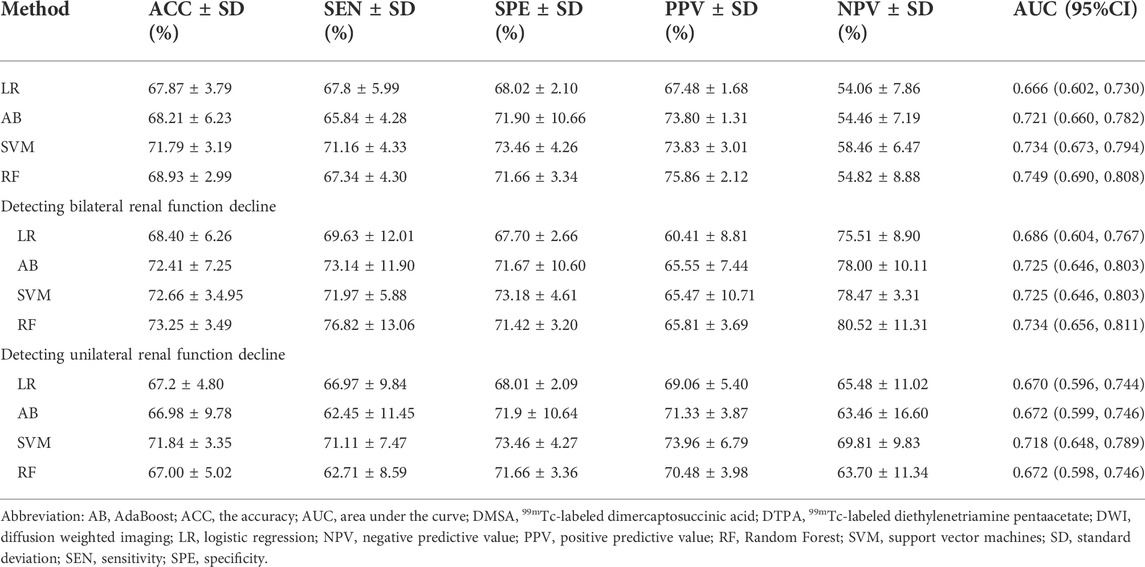
Furthermore, we tested the efficacy of the classifier for predicting the renal deficiency as identified by DTPA or DMSA. Similarly, the selection method LASSO + classifier RF presented the highest ROC AUC of 0.749 (95% CI, 0.690, 0.808) (Table 3). When we compared the models’ performance in groups of bilateral and unilateral renal deficiency, we found that the LASSO + classifier RF in the bilateral renal deficiency group outperformed the unilateral renal deficiency group in terms of sensitivity, accuracy and AUC (p < 0.05, respectively, Table 3; Figure 3).
Development and performance of prediction models for renal deficiency
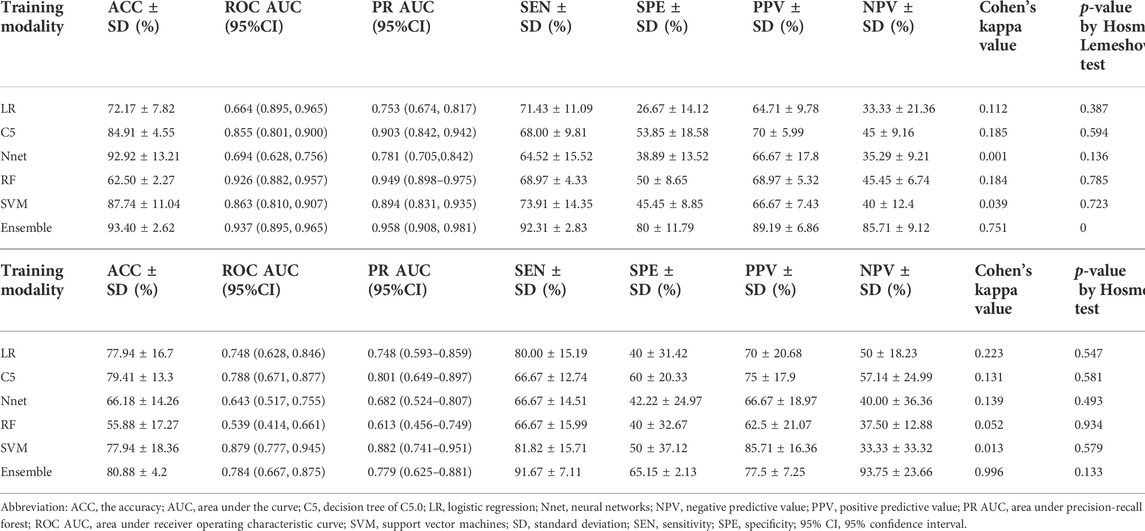
Firstly, a multivariate regression analysis was conducted integrating the radiomics and clinical features such as age, gender and UTI episodes. The VIFs of the three potential predictors ranged from 1.07 to 1.63, indicating that multicollinearity was not present (Supplementary Figure S1). We also applied the five machine learning models to predict renal deficiency detected by DMSA or DTPA based on clinical features of gender, age, UTI episodes and selected DWI-radiomics features. The performance of the six models in the training and test sets are presented in Table 4 and Figure 4. Confusion matrices and reliability curves of all models in the training and test sets were displayed in Figure 5 and Supplementary Figure S2. The ROC AUCs in the trained model for LG, C5.0, Nnet, RF, and SVM were 0.664 (95%CI, 0.895–0.965), 0.855 (95%CI, 0.801–0.900), 0.694 (95%CI, 0.628–0.756), 0.926 (95%CI, 0.882–0.957), 0.863 (95%CI, 0.810–0.907), respectively. Application of the five machine learning algorithms in the test cohort yield high AUCs of SVM and RF with 0.926 (95%CI, 0.882–0.957), 0.879 (95%CI, 0.777–0.945), respectively.
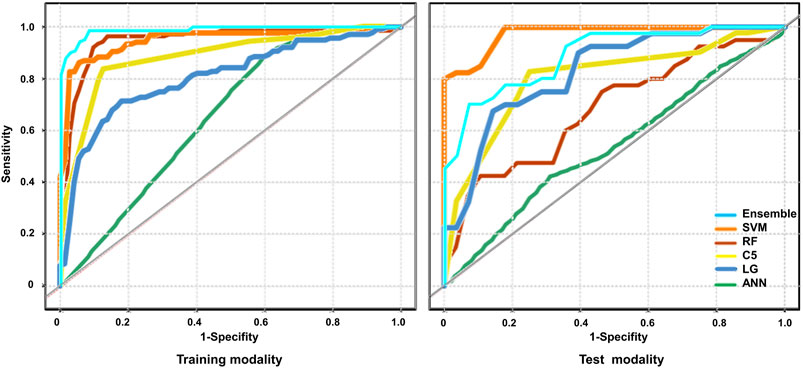
FIGURE 4. The performance of the models for the prediction of renal deficiency diagnosed by DMSA/DTPA. The Receiver operating characteristic (ROC) curves of the different models were presented across the training and test cohort. Logistic regression (LR), decision tree (C5.0), SVM, neural network (Nnet), Random Forest (RF) RF and ensemble models were unutilized separately.
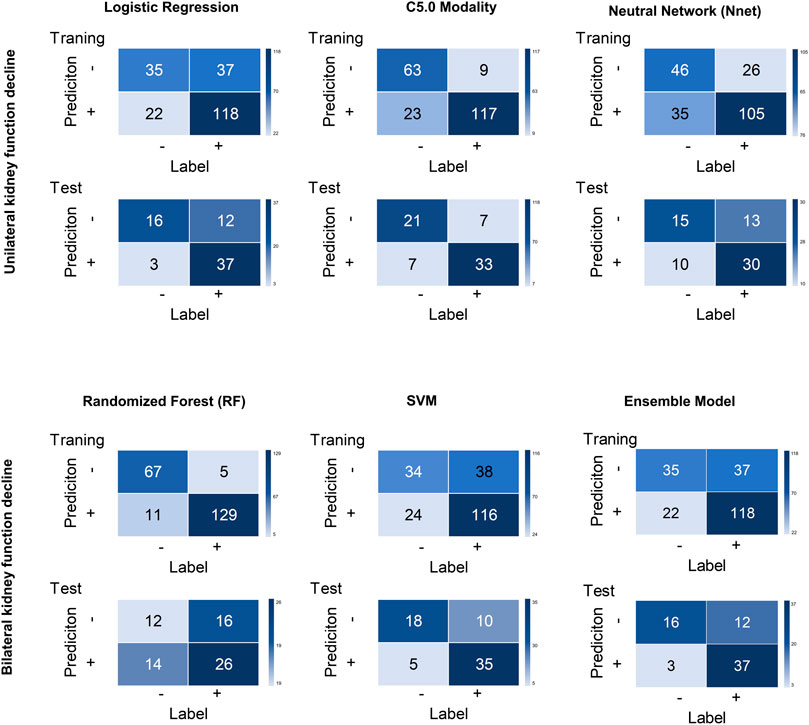
FIGURE 5. Confusion matrices for all models across the training and test cohort. Logistic regression (LR), decision tree (C5.0), SVM, neural network (Nnet), Random Forest (RF) RF and ensemble models were unutilized separately.
An ensemble model was built by combining the five prior machine learning models including LR, C5.0, RF, Nnet, and SVM. The performance was compared with the other independent machine learning algorithms in predicting renal deficiency (Table 4). The ensemble model had the advantage of a high-test accuracy (80.88% ± 4.2%) and sensitivity (91.67% ± 7.11%). In the training set, the ensemble model achieved a ROC AUC of 0.937 (95%CI, 0.895–0.965), while in the testing set, it had a ROC AUC of 0.784 (95%CI, 0.667–0.875). Strong concordance between the ensemble model and renal deficiency identified by DMSA/DTPA was presented with a Cohen’s kappa value of 0.906. Good consistency was also observed between the ensemble prediction model and the renal deficiency in the test set with nonsignificant p values (0.133) derived from the Hosmer-Lemeshow test.
Based on the AUC of the ensemble model in the training set and testing set, we set the AUC0 = 0.937, the AUC1 = 0.784, α = 0.05, false positive rate limited: 0.01–0.20 for power calculation. The results revealed that when the target power was 0.80, the sample sizes of the test sets were 60 or 50, respectively. Therefore, the test sets were sufficient to evaluate the AUC calculated from the training data.
Discussion
In this retrospective study, we illustrated that radiomic features of DWI appear to be reliable imaging indicators of renal lesions. A machine leaning approach integrated DWI-radiomics features and clinical variables was applied to predict renal deficiency with good performance.
There have been a few studies employing radiomics models as computer assisted diagnostic tools for renal deficits using DWI scanning [3]. The detection of renal parenchymal lesions by MRI or DWI scanning in children with CAKUT is very time consuming. It requires experienced and mature radiologists to avoid misdiagnosis. Radiomics texture analysis can provide quantitative information that is normally invisible to the naked eyes of a radiologist. Texture analysis approaches describe inter-relationships between the pixels and the gray-level frequencies within an image that cannot be sensed visually to quantify the variability of the distribution of pixels and their spatial arrangement. Owing to fibrosis as the hallmark of renal damage and the heterogeneity of the renal parenchyma, texture analysis on medical images of kidneys may be a useful predictor of renal lesions or deficiencies. Our findings confirmed the feasibility and efficacy of radiomics classifiers to detect renal parenchymal lesions by DWI scanning. Instead of estimating radiomics with region-based segmentation of kidneys, we manually established the square areas in the bilateral kidneys and applied the radiomics over the entire region. For each scenario, manually establishing the ROI took only 5–10 s. After training and cross-validating the four common machine learning classifiers based on renal DWI images, we illustrated that the LASSO + RF algorithm performed best with a high AUC and ACC compared to expert evaluation on renal DWI in children. RF is a well-known machine learning algorithm for classification tasks that has an inherent resistance to overfitting. It builds multiple decision trees using random data points from the dataset and enhances the final prediction performance [12]. In this study, we applied stratified 5-fold cross-validation, which randomly split all the data into five parts and then held out 20% of the testing data, repeated five times. It might be difficult to identify the bilateral diffuse lesions in the kidneys without contralateral comparison by the naked eye. We found that the radiomics models had comparable accuracy and AUC for identification of kidney lesions by DWI when comparing the unilateral and bilateral lesions group. Hence, radiomics classifiers combined with machine learning techniques have been shown to be a useful complementary tool for clinicians, particularly in the early detection of renal lesions in childhood.
The split renal function can be used to measure the renal function through renal scintigraphy, such as DMSA and DTPA. DMSA and DTPA are regarded as the “gold standards” for diagnosing renal insufficiency in children due to their excellent diagnostic sensitivity [10, 11]. However, the procedure of DMSA or DTPA is invasive and involves radiation exposure. MRI/DWI outperformed DMSA/DTPA in terms of safety without the need for contrast agent injection. Calculating GFR with dynamic contrast-enhanced MRI in children, especially infants, is more challenging than in adults because of the faster inherent respiratory and cardiac motion [13]. It is essential to improve the accuracy of MRI/DWI in the diagnosis of renal deficiency. In the current study, the LASSO + classifier RF or SVM models not only had the prediction accuracy of 68.9%–71.8% for renal deficiency identified by DTPA or DMSA, but they also performed better in bilateral kidney deficiency than in unilateral kidney deficiency. Even when the split renal function shows normal variation of 50%/50%–44%/56% (one kidney compared with the other), radiomics models may help to overcome the misdiagnosis of bilateral renal deficiency. Further study at 3-T field strength MRI in children will provide more high-quality radiological information to conduct quantitative analysis of renal function.
To further improve the diagnostic accuracy and sensitivity for predicting renal deficiency, we applied models combined the radiomics features with clinical variables when compared to calculation of split renal function by DMSA or DTPA. Ideally, a deep learning model would be used as a risk stratification tool to assist clinicians and patients in detecting early changes in renal function. To this purpose, the most essential statistic is sensitivity, because higher sensitivity, means that more children will receive an early diagnosis of renal damage or insufficiency. In addition to the radiomics signature, we involved the clinical variables such as age, gender and UTI episodes in machine learning models. This is in accordance with the viewpoint that UTI in childhood is associated with long-term outcome of renal function decline [14].
Compared with previous machine-learning studies, our work has several differences. First, we chose DWI that offers more information on renal parenchymal changes than simple attenuation differences measured in Hounsfield units on CT. Our machine learning algorithms retrieved radiomic features and improved the accuracy for clinical utilization. Second, to the best of our knowledge, this is the first study focusing on the role of DWI-based radiomics in children with CAKUT [15, 16]. All available normal or abnormal findings in kidneys from children who underwent MRI/DWI and DMSA/DTPA were included in our cohort. Most of the previous studies, on the other hand, only covered oncology or a limited number of CKD cases. Third, we employed clinical-radiomics fused data-based modalities to compare the prediction accuracy to radiologist diagnosis based on DMSA or DTPA. An ensemble model combining multiple machine learning models was transformed into the most optimal model in renal deficiency prediction with a high-test accuracy (ACC, 80.9%) and sensitivity (91.7%) after 5-fold cross-validation. Our cross-validation findings achieved a test AUC of 0.78 and a test PR AUC of 0.78 on average across all folds, confirming the model-building process.
There were several limitations to this study. First, overfitting a machine learning model is easy, especially when training with small amounts of data. Although the test accuracy reported for the best model was 80.9%, generalization is questionable due to the small cohort size and the lack of external validation. Despite the fact that we included 280 cases in our cohort, which is more than any prior machine learning works on CAKUT or CKD [3], algorithm development might benefit from a larger patient cohort, especially given the variability of image capture settings among institutions. Second, manual set for ROI was performed by students and radiologists reading the DWI images. On CT or MRI, automatic segmentation based on deep learning has been successfully established with equivalent accuracy to expert segmentation in kidneys [5, 17, 18]. Due to the small volume in children’s kidneys, it is difficult to tell the kidneys apart from other organs in the body which may have comparable intensity, especially in CAKUT. We use the rectangle ROI to locate the bilateral kidneys which takes 5–10 s which can be substituted by automatic kidney segmentation in future. And time saving analysis should be performed when deployed into the clinical routine. In our initial exploration of the DWI-radiomics, the ROI selection is based on experience. In the future work, we can compare different choices of ROI, including manual sketching or automatic segmentation of the planar ROI, twelve-layer concentric objects (TLCO) [19], and three-dimensional volumes-of-interest (VOIs) [20], to see the difference in classification results. It may also provide novel sights on perinephric changes. Third, as a single-center retrospective study, it might result in a potential selection bias. The diagnostic performance of DWI-based radiomic model needs further study in multi-centers. Fourth, this study is based on DWI-derived radiomics combined with clinical features to predict renal deficiency. Multiparametric MRI-derived radiomics with united model based on T1WI, T2WI and ADC sequences may provide more successful prediction model for CAKUT. Future study on multiparametric MRI-derived radiomics will be conducted.
In conclusion, we established a machine learning model using the DWI-radiomics and clinical features to predict renal lesions and deficiency with high accuracy and sensitivity comparable with DMSA/DTPA-based diagnosis. If further validated, the algorithm can contribute to the early detection of renal lesions and predict renal deficiency in CAKUT.
Data availability statement
The original contributions presented in the study are included in the article/Supplementary Materials, further inquiries can be directed to the corresponding authors.
Ethics statement
The studies involving human participants were reviewed and approved by NO. 2018_28. Written informed consent to participate in this study was provided by the participants’ legal guardian/next of kin.
Author contributions
JR and JS led and supervised the project and were involved in all aspects of the study. JR, JS, and ZQ conceived and designed the study. WK, HZ, MJ, HS, TX, YL, YF, QQ, JW, JS, LT, XL, YY, XG, and XW acquired the data. WK and HZ processed the images. JR and HZ analyzed and interpreted the data. All authors contributed to the article and approved the final version.
Funding
JR is supported by a grant from the National Key Research and Development Program of China (2021YFC2701100), a grant from Clinical Research Plan of SHDC (SHDC2020CR2064B).
Conflict of interest
The authors declare that the research was conducted in the absence of any commercial or financial relationships that could be construed as a potential conflict of interest.
Publisher’s note
All claims expressed in this article are solely those of the authors and do not necessarily represent those of their affiliated organizations, or those of the publisher, the editors and the reviewers. Any product that may be evaluated in this article, or claim that may be made by its manufacturer, is not guaranteed or endorsed by the publisher.
Supplementary material
The Supplementary Material for this article can be found online at: https://www.frontiersin.org/articles/10.3389/fphy.2022.920506/full#supplementary-material
References
1. Stonebrook E, Hoff M, Spencer JD. Congenital anomalies of the kidney and urinary tract: A clinical review. Curr Treat Options Pediatr (2019) 5(3):223–35. doi:10.1007/s40746-019-00166-3
2. Murugapoopathy V, Gupta IR. A primer on congenital anomalies of the kidneys and urinary tracts (CAKUT). Clin J Am Soc Nephrol (2020) 15(5):723–31. doi:10.2215/CJN.12581019
3. Alnazer I, Bourdon P, Urruty T, Falou O, Khalil M, Shahin A, et al. Recent advances in medical image processing for the evaluation of chronic kidney disease. Med Image Anal (2021) 69:101960. doi:10.1016/j.media.2021.101960
4. Sulkowska K, Palczewski P, Duda-Zysk A, Szeszkowski W, Wojcik D, Kownacka-Piotrowska D, et al. Diffusion-weighted MRI of kidneys in healthy volunteers and living kidney donors. Clin Radiol (2015) 70(10):1122–7. doi:10.1016/j.crad.2015.05.016
5. Abdeltawab H, Shehata M, Shalaby A, Khalifa F, Mahmoud A, El-Ghar MA, et al. A novel CNN-based CAD system for early assessment of transplanted kidney dysfunction. Sci Rep (2019) 9(1):5948. doi:10.1038/s41598-019-42431-3
6. CongHua LQ-Q, Huang Z-Q, Ma Q-L, Wang X-M, Huang C-C, Xu J-X, et al. A radiomics method based on MR FS-T2WI sequence for diagnosing of autosomal dominant polycystic kidney disease progression. Eur Rev Med Pharmacol Sci (2021) 25(18):5769–80. doi:10.26355/eurrev_202109_26795
7. Pei X, Wang P, Ren J-L, Yin XP, Ma LY, Wang Y, et al. Comparison of different machine models based on contrast-enhanced computed tomography radiomic features to differentiate high from low grade clear cell renal cell carcinomas. Front Oncol (2021) 11:659969. doi:10.3389/fonc.2021.659969
8. Zheng J, Yu H, Batur J, Shi Z, Tuerxun A, Abulajiang A, et al. A multicenter study to develop a non-invasive radiomic model to identify urinary infection stone in vivo using machine-learning. Kidney Int (2021) 100(4):870–80. doi:10.1016/j.kint.2021.05.031
9. Bodalal Z, Trebeschi S, Nguyen-Kim TDL, Schats W, Beets-Tan R. Radiogenomics: Bridging imaging and genomics. Abdom Radiol (Ny) (2019) 44(6):1960–84. doi:10.1007/s00261-019-02028-w
10. Mandell GA, Eggli DF, Gilday DL, Heyman S, Leonard JC, Miller JH, et al. Society of nuclear medicine procedure guideline for renal cortical scintigraphy in children In: Society of Nuclear Medicine Procedure Guidelines Manual August. Available at: https://humanhealth.iaea.org/HHW/NuclearMedicine/PaediatricsandNephrourology/GuidelinesandLiterature/SNMGuidelinesPaediatrics/Renal_Cortical_Scintigraphy.pdf (2003). 195–198.
11. Treves ST. Pediatric nuclear medicine and molecular imaging. New York, NY: Springer New York (2014).
12. Hosny A, Parmar C, Quackenbush J, Schwartz LH, Aerts HJWL. Artificial intelligence in radiology. Nat Rev Cancer (2018) 18(8):500–10. doi:10.1038/s41568-018-0016-5
13. Kurugol S, Afacan O, Lee RS, Seager CM, Ferguson MA, Stein DR, et al. Prospective pediatric study comparing glomerular filtration rate estimates based on motion-robust dynamic contrast-enhanced magnetic resonance imaging and serum creatinine (eGFR) to 99mTc DTPA. Pediatr Radiol (2020) 50(5):698–705. doi:10.1007/s00247-020-04617-0
14. Calderon-Margalit R, Golan E, Twig G, Leiba A, Tzur D, Afek A, et al. History of childhood kidney disease and risk of adult end-stage renal disease. N Engl J Med (2018) 378(5):428–38. doi:10.1056/nejmoa1700993
15. Chen C-J, Pai T-W, Hsu H-H, Lee CH, Chen KS, Chen YC. Prediction of chronic kidney disease stages by renal ultrasound imaging. Enterprise Inf Syst (2020) 14(2):178–95. doi:10.1080/17517575.2019.1597386
16. Ding J, Xing Z, Jiang Z, Zhou H, Di J, Chen J, et al. Evaluation of renal dysfunction using texture analysis based on DWI, BOLD, and susceptibility-weighted imaging. Eur Radiol (2019) 29(5):2293–301. doi:10.1007/s00330-018-5911-3
17. Homayounieh F, Doda Khera R, Bizzo BC, Ebrahimian S, Primak A, Schmidt B, et al. Prediction of burden and management of renal calculi from whole kidney radiomics: A multicenter study. Abdom Radiol (Ny) (2021) 46(5):2097–106. doi:10.1007/s00261-020-02865-0
18. Boer Ade, Harteveld AA, Stemkens B, Blankestijn PJ, Bos C, Franklin SL, et al. Multiparametric renal MRI: An intrasubject test-retest repeatability study. J Magn Reson Imaging (2021) 53(3):859–73. doi:10.1002/jmri.27167
19. Li L-P, Milani B, Pruijm M, Kohn O, Sprague S, Hack B, et al. Renal BOLD MRI in patients with chronic kidney disease: Comparison of the semi-automated twelve layer concentric objects (TLCO) and manual ROI methods. Magn Reson Mater Phy (2020) 33(1):113–20. doi:10.1007/s10334-019-00808-5
Keywords: congenital anomalies of the kidneys and urinary tracts (CAKUT), machine learning, radiomics, diffusion weighted imaging (DWI), children
Citation: Kang W, Ji M, Zhang H, Shi H, Xiang T, Li Y, Fang Y, Qi Q, Wang J, Shen J, Tang L, Liu X, Ye Y, Ge X, Wang X, Xu H, Qiao Z, Shi J and Rao J (2022) A novel clinical-radiomics model predicted renal lesions and deficiency in children on diffusion-weighted MRI. Front. Phys. 10:920506. doi: 10.3389/fphy.2022.920506
Received: 14 April 2022; Accepted: 21 July 2022;
Published: 17 August 2022.
Edited by:
Giovanni Mettivier, Università degli Studi di Napoli Federico II, ItalyReviewed by:
Xiaopan Xu, Fourth Military Medical University, ChinaXun Sun, Huazhong University of Science and Technology, China
Copyright © 2022 Kang, Ji, Zhang, Shi, Xiang, Li, Fang, Qi, Wang, Shen, Tang, Liu, Ye, Ge, Wang, Xu, Qiao, Shi and Rao. This is an open-access article distributed under the terms of the Creative Commons Attribution License (CC BY). The use, distribution or reproduction in other forums is permitted, provided the original author(s) and the copyright owner(s) are credited and that the original publication in this journal is cited, in accordance with accepted academic practice. No use, distribution or reproduction is permitted which does not comply with these terms.
*Correspondence: Zhongwei Qiao, emhvbmd3ZWlxaWFvQGdtYWlsLmNvbQ==; Jun Shi, anVuc2hpQHNodS5lZHUuY24=; Jia Rao, amlhcmFvQGZ1ZGFuLmVkdS5jbg==
†These authors have contributed equally to this work and share first authorship
 Weijie Kang
 Min Ji
 Huili Zhang5†
 Hua Shi
 Tianchao Xiang
 Yaqi Li
 Ye Fang
 Qi Qi
Qi Qi Liangfeng Tang
 Hong Xu
 Jun Shi
 Jia Rao