 Esther Nabadda
 Pascuala García-Martínez
 María del Mar Sánchez-López1,3
 Ignacio Moreno
- 1Instituto de Bioingeniería, Universidad Miguel Hernández de Elche, Elche, Spain
- 2Departamento de Óptica y Optometría y Ciencias de la Visión, Universitat de València, Burjassot, Spain
- 3Departamento de Física Aplicada, Universidad Miguel Hernández de Elche, Elche, Spain
- 4Departamento de Ciencia de Materiales, Óptica y Tecnología Electrónica, Universidad Miguel Hernández de Elche, Elche, Spain
In this work we apply a phase-shifting interferometry (PSI) to evaluate the reconstruction of complex-valued holograms displayed onto a phase-only spatial light modulator (SLM). The interferometer is vibration-free since it uses a common-path polarization arrangement based on the SLM itself, which is used simultaneously to display the hologram and to apply the phase-shifting values. The change from the hologram display configuration to the interferometer configuration involves only a rotation of a polarizer. The continuous phase modulation provided by the SLM allows using PSI with arbitrary phase bias values. Several examples are demonstrated by generating different combinations of modes with an efficient on-axis hologram encoding technique.
Introduction
The possibility of encoding arbitrary complex-valued fields in a light beam has led to the generation of the so-called structured light, a research area that has received a great deal of attention [1, 2]. In their most common configuration for this application, SLMs are typically arranged as parallel-aligned liquid-crystal on silicon (LCOS) displays [3]. These are pixelated linear retarders that, under illumination with linearly polarized light parallel to the liquid-crystal (LC) director, produce phase-only modulation. This modulation response does not allow directly displaying complex-valued holograms and several encoding techniques have been developed for this purpose [4–9]. In most cases, the successful generation of the complex beam is verified by regarding the intensity in the far field. In some cases, however, the phase distribution of the propagated field is also of interest, and it is measured typically with a wave-front sensor or through interferometry [8, 10]. These are external systems that must be added to the SLM setup generating the structured light beam to recover the phase distribution, thus adding some complexity to the optical systems.
Phase-shifting interferometry (PSI) is a very efficient and accurate classical technique, where a phase distribution is retrieved from a sequence of phase-shifted interferograms [11]. Although the most common device for phase shifting is a piezoelectric transducer, LC retarders have also been extensively used [12, 13]. LC-SLMs have been also exploited to build several interferometric and holographic systems [14]. On the other hand, the phase modulation properties and/or aberration of LC-SLMs are typically measured by introducing the device in an external interferometer [15]. In the last years some works demonstrated the use of the SLM itself to simultaneously build the interferometer, either by displaying a diffraction grating [16] or using the light reflected on the device coating [17]. These techniques exploit a common-path interferometer, thus becoming very simple, compact and vibration insensitive.
In this work we combine three well-stablished methods in a simple and compact optical system: 1) a technique to encode complex-valued holograms onto a phase-only SLM; 2) a common path interferometer based on polarized light; and 3) the classical PSI technique. The goal is to show how this combination can be exploited to evaluate the quality of the propagated structured light field, not only in intensity but also in its the phase distribution. The hologram is displayed with a checkerboard grating technique that provides on-axis reconstruction [7–9] The same system is employed to retrieve the phase distribution in far field through a PSI algorithm by simply rotating a polarizer. The technique is demonstrated by producing different superpositions of Gaussian modes [18]. The PSI algorithms provides quantitative phase evaluation that complements the traditional intensity pattern evaluation.
Methods and Techniques
Experimental Interferometric Arrangement
Figure 1 shows a scheme of the experimental arrangement. A linearly polarized He-Ne laser (Melles-Griot 05-LHP-991, with a
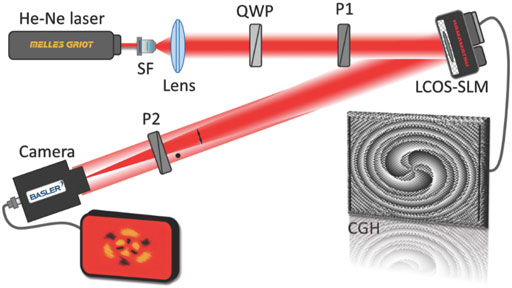
FIGURE 1. Scheme of the optical system. SF: spatial filter; QWP: quarter-wave plate; P: linear polarizer; CGH: displayed phase-only computer-generated hologram.
The SLM displays a phase-only function that combines the hologram with a converging lens,
Complex Hologram Encoding
We encode complex-valued functions on the SLM with a well-established technique that uses a modulated checkerboard diffraction grating [7, 8]. This technique presents the advantage of producing a reconstruction on axis, although it might be severely affected if the SLM presents fringing [9]. Let us consider the complex function
Here
Figure 2 illustrates this encoding technique, applied to a Laguerre-Gauss LG13 mode. Figures 2A,B show the intensity distribution
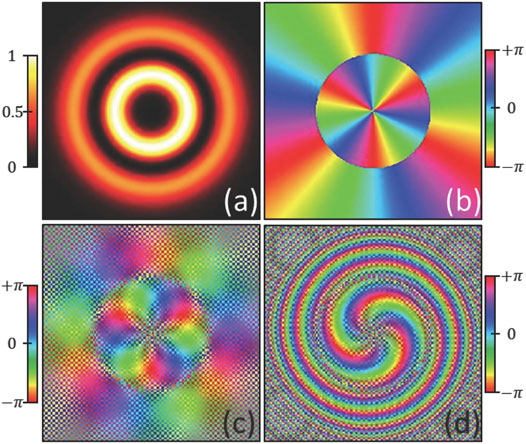
FIGURE 2. Illustration of the complex encoding technique. LG13 mode (A) intensity
Common-Path Interferometer
We are interested in experimentally evaluating the hologram reconstruction in the Fourier plane by measuring the intensity and the phase distributions, although the same technique could be applied to Fresnel or fractional Fourier planes. In our approach we use the LCOS-SLM itself to generate the interferometer, thus avoiding any additional components. We follow the scheme presented in [20]. This is based on rotating the input polarizer (P1) so a significant component of the input beam is oriented perpendicular to the LC director of the SLM. This non-modulated polarization component is the reference beam. The second polarizer (P2) produces the interference of the modulated test beam and the reference beam in a common-path configuration, with significant advantages of alignment and stability.
While in ref. [20] the interferometer was demonstrated, here we perform quantitative phase measurements. To this aim we apply the well-known PSI algorithms by adding a known constant phase-shift
Given the continuous phase modulation provided by the LCOS-SLM, it is simple to add a constant phase
If the phase steps are evenly distributed in the range
Well-established classical algorithms are the three-step algorithm, with phase-shifts
or the standard four-step algorithm, which adds a fourth phase shift
Results and Discussion
To illustrate the procedure, Figure 3 shows a first set of experiments where we encode a Hermite-Gauss and a Laguerre-Gauss beam. Figures 3A,B show the HG33 characteristic intensity and phase patterns. The phase distribution is plotted only with the color code in the pixels where the intensity distribution is greater than 5% of the maximum intensity. The rest are plotted gray since they are not significant in comparison with the experimental results. Figure 3C shows the camera capture which shows the successful realization of the intensity distribution. For this experiment, the input polarizer (P1) was aligned with the LCOS director, so
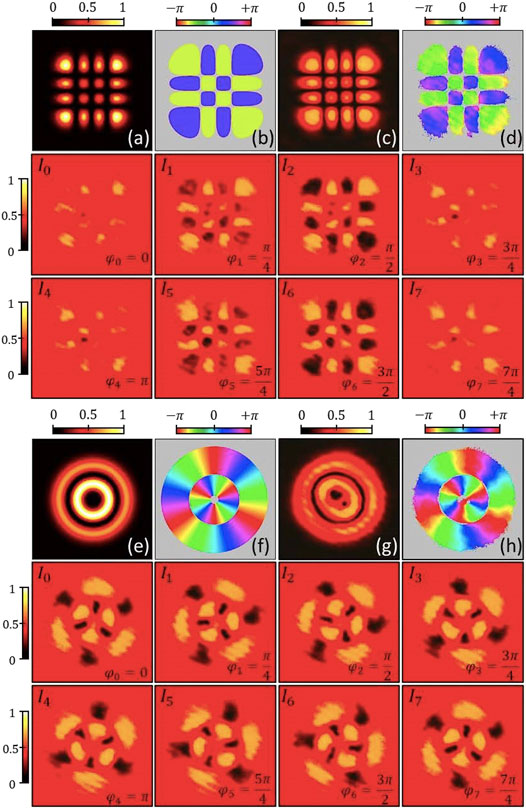
FIGURE 3. Realization of a HG33 (A–D) and LG13 (E–H) beam. Theoretical intensity (A,E) and phase (B,F) distributions. Experimental intensity (C,G) and phase (D,H) distributions. The phase distribution of each beam is retrieved from the interferograms shown below each case with eight consecutive phase shifts of step
To retrieve the phase distribution, we rotate P1 such that a significant portion of the input beam is not modulated. The interference pattern is shown in the second and third rows in Figure 3. We apply
The angle of the polarizer P1 was adjusted to achieve the best contrast before capturing all the sequence of interferograms. Interferograms
We note that, since the hologram and the lens are both displayed on the SLM, the phase in the detector also includes a quadratic phase factor given by
Note that the PSI technique can only retrieve a wrapped phase map, here presented in the range
Here the summation is made only in the region with significant pixels and
Figure 3 shows equivalent results for the LG13 beam. The theoretical intensity and phase distributions (Figures 3E,F) exhibit its characteristic double ring and spiral pattern. In this case, the experimental interferograms show three bright and three dark lobes inside each of the two intensity rings. The bright and dark lobes are opposite from one ring to the other, as corresponds to the
We further tested different superpositions of LG beams. The first and second rows in Figure 4 show their theoretical intensity and phase distributions. The third and fourth rows show the corresponding experiments. As in the previous figures, the phase distributions are plotted with the color code only where the intensity distribution is significant. All cases bear a very good agreement. Note for instance how the simplest case, the LG01 mode (Figure 4A) exhibits the classical doughnut shape and a spiral phase pattern. This case provides the best phase RMSE of only 0.154π.
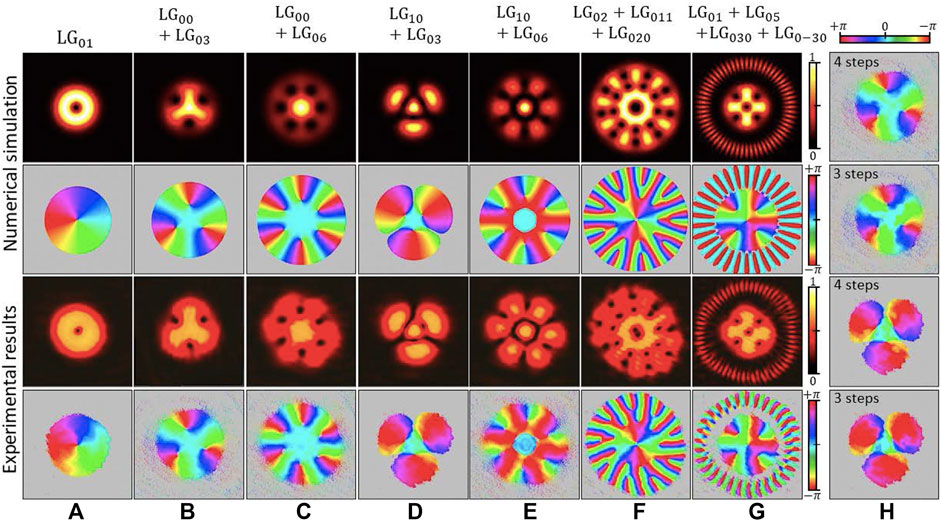
FIGURE 4. Realization of different superpositions of LG modes: (A) LG01 (B) LG0-1 (C) LG00 + LG06, (D) LG10 + LG03, (E) LG10 + LG06, (F) LG02 + LG0,11 + LG0,20, (G) LG01 + LG05 + LG0,30 + LG0,-30. First and second rows show numerical simulations of the intensity and phase distributions. Third and fourth rows show the corresponding experimental results. (H) Experimental phase distributions for the superpositions LG00 + LG03 and LG10 + LG03 (cases (B) and (D) respectively) when PSI with 4 and 3 steps are considered.
The collinear superposition of LG beams has been performed by several ways. For instance, in [22] we demonstrated a system with two SLMs, each encoding one mode, which interfere after passing through a polarizer. Here, instead, we numerically calculate the superposition and display it in a single SLM, similar to what was done previously in [18]. In that work, the verification of the experimental phase was performed by simply regarding an interference pattern. Here, we apply the proposed common-path PSI technique to achieve a quantitative evaluation.
Figure 4B,C show respectively the superposition of the fundamental mode LG00 with the LG03 mode and with the LG06 mode. Here the LG00 mode provides light on axis despite the axial phase singularity of the LG03 or the LG06 modes. However, their interference exhibits intensity patterns with three and six dark spots respectively. The phase pattern presents a constant value in the center and a spiral distribution at the outer part. In between there are points where the phase completely twists around, which coincide with the dark spots in the intensity. The corresponding experimental results displayed in the last two rows corroborate these patterns.
Figure 4D,E present results of the superpositions LG10 + LG03 and LG10 + LG06 respectively. Here both intensity patterns show a bright spot in the center, caused by the LG10 mode. However, in contrast to the case in Figure 4C, the intensity has dark lines separating the central bright spot from the external lobes, with three outer spots in Figures 4D and six outer spots in Figure 4E. The phase patterns are again constant in the center and spirals in the outer region, but the region in between shows different distributions. The experiments again show a good agreement with the theory. In these results the Gouy phase difference on the propagation was compensated since it can cause a rotation of the patterns [23].
Figure 4F,G more sophisticated patterns obtained by the superposition of three and four different LG modes. Figure 4F illustrates the LG02 + LG0,11 + LG0,20 superposition. Here, the three modes present a phase singularity on axis, thus creating a central dark spot. However, the higher the mode azimuthal order, the larger the radius of the ring of maximum intensity. As a result, the intensity pattern shows a central bright ring, while the outer part exhibits bright lobes separated by regions with two dark spots at two radial coordinates. The phase distribution shows a complicated pattern. However, singular points where the phase makes a complete cycle are clearly visible, which coincide with the dark spots in the intensity. Despite the higher increased complexity of this superposition, the experimental distributions show a good agreement with theoretical results.
Finally, Figure 4G shows the superposition of four modes, LG01 + LG05 + LG0,30 + LG0,−30. All these modes present a singularity on axis and the center shows a dark spot. Near the center, four dark spots are yielded by the interference of the LG01 and LG05 modes. LG0,30 and LG0,−30 modes have such a large azimuthal order that their intensity is located far from the center, where they create an azimuthal interference (“petal beam”). Again, the experiments reproduce well the expected patterns. This case shows the fastest spatial variations in the phase distribution, especially in the binary pattern at the outer ring. Therefore, any slight shift of the experiment compared to the simulation yields a higher error compared to other cases, showing the highest RMSE phase value of
All the results presented so far were obtained by applying the PSI algorithm with eight phase steps described in Eq. 6. We have also tested the results with fewer interferograms. For instance, in Figure 4H we present the phase retrieved for two cases, LG00 + LG03 (Figure 4B) and LG10 + LG03 (Figure 4D), but now considering a PSI with four steps (Eq. 5) and with three steps (Eq. 4). They again agree quite well with numerical simulations. The RSME phase values for the LG00 + LG03 case are
Conclusion
In summary, we have presented a PSI technique to evaluate the phase distribution of holograms displayed on a phase-only LCOS-SLM. Complex-valued Fourier transform holograms are encoded to generate different kinds of Gaussian beams. Results are given for intensity and phase retrieval of several cases.
The interferometric technique is based on a common-path polarization arrangement in which the LCOS SLM is used to simultaneously display the hologram and to apply the phase-shifting values required to retrieve the phase distribution. A simple rotation of a polarizer changes from a hologram configuration leading to the pure intensity recovery, to a common-path interferometric arrangement useful to measure the phase. Hence, the phase distribution of the beam can be recovered with no need of adding any extra-interferometer or wave-front measurement system.
Results show an excellent agreement with the theory, thus confirming the successful generation of structured light, not only in its intensity but also in its phase distribution, which probes the accuracy and advantage of the technique.
Data Availability Statement
The raw data supporting the conclusions of this article will be made available by the authors, without undue reservation.
Author Contributions
EN is a PhD student that did the optical experiments under the supervision of MS-L and IM. PG-M was a visitors professor at the University Miguel Hernandez of Elche that was collaborating in the experiment. PG-M, MS-L, and IM wrote the paper. All authors contributed to the article and approved the submitted version.
Funding
This work received financial support from Ministerio de Ciencia, Innovación y Universidades, Spain (grant RTI2018-097107-B-C33). EN acknowledges a grant from Generalitat Valenciana (ref. GRISOLIAP/2020/004).
Conflict of Interest
The authors declare that the research was conducted in the absence of any commercial or financial relationships that could be construed as a potential conflict of interest.
Publisher’s Note
All claims expressed in this article are solely those of the authors and do not necessarily represent those of their affiliated organizations, or those of the publisher, the editors and the reviewers. Any product that may be evaluated in this article, or claim that may be made by its manufacturer, is not guaranteed or endorsed by the publisher.
References
1. Rosales-Guzmán C, Ndagano B, Forbes A. A Review of Complex Vector Light fields and Their Applications. J Opt (2018) 20:123001. doi:10.1088/2040-8986/aaeb7d
2. Pachava S, Dharmavarapu R, Vijayakumar A, Jayakumar S, Manthalkar A, Dixit A, et al. Generation and Decomposition of Scalar and Vector Modes Carrying Orbital Angular Momentum: A Review. Opt Eng (2019) 59(4):041205. doi:10.1117/1.OE.59.4.041205
3. Zhang Z, You Z, Chu D. Fundamentals of Phase-Only Liquid crystal on Silicon (LCOS) Devices. Light Sci Appl (2014) 3:213. doi:10.1038/lsa.2014.94
4. Davis JA, Cottrell DM, Campos J, Yzuel MJ, Moreno I. Encoding Amplitude Information onto Phase-Only Filters. Appl Opt (1999) 38(23):5004–13. doi:10.1364/ao.38.005004
5. Ando T, Ohtake Y, Matsumoto N, Inoue T, Fukuchi N. Mode Purities of Laguerre-Gaussian Beams Generated via Complex-Amplitude Modulation Using Phase-Only Spatial Light Modulators. Opt Lett (2009) 34(1):34–6. doi:10.1364/ol.34.000034
6. Clark TW, Offer RF, Franke-Arnold S, Arnold AS, Radwell N. Comparison of Beam Generation Techniques Using a Phase Only Spatial Light Modulator. Opt Express (2016) 24(6):6249–64. doi:10.1364/oe.24.006249
7. Arrizón V. Optimum on-Axis Computer-Generated Hologram Encoded into Low-Resolution Phase-Modulation Devices. Opt Lett (2003) 28(24):2521–3. doi:10.1364/OL.28.002521
8. Mendoza-Yero O, Mínguez-Vega G, Lancis J. Encoding Complex fields by Using a Phase-Only Optical Element. Opt Lett (2014) 39(7):1740–3. doi:10.1364/ol.39.001740
9. Davis JA, Wolfe ED, Moreno I, Cottrell DM. Encoding Complex Amplitude Information onto Phase-Only Diffractive Optical Elements Using Binary Phase Nyquist Gratings. OSA Continuum (2021) 4(3):896–910. doi:10.1364/osac.418578
10. Bowman D, Harte TL, Chardonnet V, De Groot C, Denny SJ, Le Goc G, et al. High-Fidelity Phase and Amplitude Control of Phase-Only Computer Generated Holograms Using Conjugate Gradient Minimisation. Opt Express (2017) 25:11692–700. doi:10.1364/oe.25.011692
11. Creath K. V Phase-Measurement Interferometry Techniques. Prog Opt (1988) 26:349–93. doi:10.1016/s0079-6638(08)70178-1
12. Machuca-Bautista YB, Strojnik M, Flores JL, Serrano-García DI, García-Torales G. Michelson Interferometer for Phase Shifting Interferometry with a Liquid crystal Retarder. Results Opt (2021) 5:100197. doi:10.1016/j.rio.2021.100197
13. Ramírez C, Otón E, Iemmi C, Moreno I, Bennis N, Otón JM, et al. Point Diffraction Interferometer with a Liquid-Crystal Monopixel. Opt Express (2013) 21(7):8116–25. doi:10.1364/OE.21.008116
14. Haist T, Osten W. Holography Using Pixelated Spatial Light Modulators-Part 2: Applications. J Micro/Nanolith. MEMS MOEMS (2015) 14(4):041311. doi:10.1117/1.jmm.14.4.041311
15. He A, Quan C. Wavefront Correction for Spatial Nonuniformity of the Liquid Crystal on Silicon Based Spatial Light Modulator. Opt Lasers Eng (2019) 121:377–88. doi:10.1016/j.optlaseng.2019.05.010
16. Martínez L, Fernández EJ, Prieto PM, Artal P. Interferometric Method for Phase Calibration in Liquid Crystal Spatial Light Modulator Using a Self-Generated Diffraction Grating. Opt Express (2016) 24(13):14159–71. doi:10.1364/OE.24.014159
17. Marco D, Vargas A, Sánchez-López Md. M, Moreno I. Measuring the Spatial Deformation of a Liquid-Crystal on Silicon Display with a Self-Interference Effect. Opt Lett (2020) 45(16):4480–3. doi:10.1364/ol.396105
18. Huang S, Miao Z, He C, Pang F, Li Y, Wang T. Composite Vortex Beams by Coaxial Superposition of Laguerre-Gaussian Beams. Opt Lasers Eng (2016) 78:132–9. doi:10.1016/j.optlaseng.2015.10.008
19. Moreno I, Sánchez-López MDM, Davis JA, Cottrell DM. Simple Method to Evaluate the Pixel Crosstalk Caused by Fringing Field Effect in Liquid-Crystal Spatial Light Modulators. J Eur Opt Soc.-Rapid Publ (2021) 17:27. doi:10.1186/s41476-021-00174-7
20. Moreno I, Davis JA, Klein FA, Mitry MJ. Polarization-Splitting Common-Path Interferometer Based on a Zero-Twist Liquid Crystal Display. Appl Opt (2008) 47(11):1797–801. doi:10.1364/ao.47.001797
22. García-Martínez P, Marco D, Martínez-Fuentes JL, Sánchez-López MM, Moreno I. Efficient on-Axis SLM Engineering of Optical Vector Modes. Opt Lasers Eng (2020) 125:105859. doi:10.1016/j.optlaseng.2019.105859
Keywords: spatial light modulators, holograms, liquid-crystal on silicon, phase shifting, polarization interferometry
Citation: Nabadda E, García-Martínez P, Sánchez-López MdM and Moreno I (2022) Phase-Shifting Common-Path Polarization Self-Interferometry for Evaluating the Reconstruction of Holograms Displayed on a Phase-Only Display. Front. Phys. 10:920111. doi: 10.3389/fphy.2022.920111
Received: 14 April 2022; Accepted: 15 June 2022;
Published: 08 July 2022.
Edited by:
Elizabeth C. Carroll, Delft University of Technology, NetherlandsReviewed by:
Takanori Nomura, Wakayama University, JapanRakesh Kumar Singh, Indian Institute of Technology (BHU), India
Naveen Nishchal, Indian Institute of Technology Patna, India
Copyright © 2022 Nabadda, García-Martínez, Sánchez-López and Moreno. This is an open-access article distributed under the terms of the Creative Commons Attribution License (CC BY). The use, distribution or reproduction in other forums is permitted, provided the original author(s) and the copyright owner(s) are credited and that the original publication in this journal is cited, in accordance with accepted academic practice. No use, distribution or reproduction is permitted which does not comply with these terms.
*Correspondence: Pascuala García-Martínez, pascuala.garcia@uv.es