 Guochao Qian1,2
 Fu Wan
 Weigen Chen
95% of researchers rate our articles as excellent or good
Learn more about the work of our research integrity team to safeguard the quality of each article we publish.
Find out more
ORIGINAL RESEARCH article
Front. Phys. , 24 June 2022
Sec. Optics and Photonics
Volume 10 - 2022 | https://doi.org/10.3389/fphy.2022.917688
This article is part of the Research Topic State-of-the-Art Laser Spectroscopy and its Applications : Volume II View all 51 articles
In this article, with an anti-resonant hollow core fiber (ARHCF), fiber-enhanced Raman spectroscopy (FERS) for trace-gas sensing in a high-concentration gas background is demonstrated for the first time. The performance of the apparatus is verified by detecting trace-gas in the high concentration SF6 and gaseous impurities in the high concentration C2H6. With a 1.5 W laser source and 60 s exposure time, the limit of detection (LOD) of gases at tens of ppm levels is achieved, including carbonyl sulfide (COS), carbon tetrafluoride (CF4), carbon dioxide (CO2), carbon monoxide (CO), methane (CH4), acetylene (C2H2), ethylene (C2H4), propyne (C3H4), propylene (C3H6), and propane (C3H8). Quantification of multi-gas with great accuracy exceeding 94% is also realized. It shows that the FERS can demonstrate the ability of multi-gas sensing with high selectivity, sensitivity, and accuracy.
Trace-gas sensing in a high-concentration gas background is important for environmental pollution [1], equipment fault diagnosis [2], chemical composition analysis [3], and gaseous energy detection [4]. For example, the natural gases extracted during the recovery and treatment of oilfield-associated gas contain acidic trace-gases such as hydrogen sulfide (H2S) and carbon dioxide (CO2), which will react with water and cause corrosion of natural gas transportation pipelines [5]. Sulfur hexafluoride [6] (SF6), a preferred insulating and arc-quenching medium in gas insulation equipment, decomposes and produces trace characteristic gases during partial discharge or overheating. By obtaining the type and concentrations of the decomposition gases, the equipment failure can be accurately diagnosed [7]. The content of impurities in the high-purity gas represents the purification of the standard gas [8]. Therefore, accurate monitoring of the types and concentrations of trace gases in a high-concentration gas background is necessary.
In some applications, the concentration of characteristic gas is very low and the composition is complex, which requires a highly sensitive and selective gas analysis method. At present, the existing gas analysis methods are mainly divided into chemical sensor methods [9], gas chromatography (GC) methods [10], and optical methods. The chemical sensor method has high sensitivity, rapid response, and small volume, but there exist shortcomings of cross interference, poor long-term stability, and repeatability. Although GC has high sensitivity, it is time- and gas-consuming, and the aging of the chromatographic column is adverse to quantification. Optical methods are mainly based on absorption and scattering effects, such as infrared absorption spectroscopy [11], photoacoustic spectroscopy [12], photothermal spectroscopy [13], and Raman spectroscopy, both of which can provide exceptional sensitivity and selectivity. However, since homonuclear diatoms (O2 and H2, etc.) only have a weak electric four-dipole moment [14], the absorption effect is extremely weak, so it is difficult to realize the detection of trace homonuclear diatomic gases [15]. In addition, the absorption spectrum lines are relatively dense, and the absorption spectrum of a high-concentration background gas is likely to overlap with the trace-gas spectrum lines. Therefore, it is difficult to detect trace gases in a high-concentration gas background based on the absorption effect. Moreover, different gases can only produce absorption effects on specific laser wavelengths corresponding to the energy level of each gas, so multiple laser sources may be required when detecting multi-component gases.
Raman spectroscopy is another effective optical method for gas sensing based on scattering effects. When the incident light with frequency ν0 passes through the gas, the incident laser light will excite gas molecules to generate spherical divergent Raman scattered light with frequency ν0±νR. Different gases have their own unique νR, namely Raman frequency shift, so Raman spectroscopy can detect the multicomponent gases (except for monatomic gases) simultaneously and highly selectively with a single-wavelength laser. It is worth noting that Raman spectroscopy can easily distinguish multi-component gases in a high-concentration gas background, owing to the relatively independent vibration Raman frequency shift with little overlapping. However, due to the extremely low gas Raman scattering cross section [16], the sensitivity is low, which limits its practical application in trace-gas detection [17], such as power transformer fault diagnosis [18].
The sensitivity of Raman spectroscopy can be improved when combined with an optical resonant cavity, namely, cavity-enhanced Raman spectroscopy (CERS) [19]. By locking the laser frequency to the resonant mode of a FP cavity, the laser will be confined and accumulated, resulting in quite a strong laser power buildup due to constructive interference. The sensitivity enhancement of CERS can reach three orders of magnitude. However, the resonant cavity has extremely high requirements for the collimation of the optical path, resulting in insufficient anti-interference ability and usually requiring tens of milliliters of gas volume, which is not suitable for many applications with only little gases.
Another method to enhance the sensitivity of Raman spectroscopy is combined with hollow core fiber or capillary, namely, fiber-enhanced Raman spectroscopy (FERS), which improves the collection efficiency of spherical divergent Raman scattered light to about 360°. It not only requires a small gas volume of microliters but also has a flexible layout. Compared to hollow-core capillary [20] with high-transmission loss [21], hollow-core fiber has lower transmission loss [22]. Therefore, FERS combined with hollow core fiber can achieve higher Raman signal enhancement. The hollow-core photonic crystal fiber (HCPCF) and anti-resonant hollow core fiber (ARHCF) are the most commonly used in FERS. Buric [23] uses FERS with HCPCF to analyze the fuel gases. The detection limit (LOD) of CH4 and C3H8 is less than 140 ppm bar with a laser of 100 mW at 514.5 nm and an exposure time of 1 s. Popp [24–26] reported the highly selective and sensitive detection of complex gas mixtures (consisting of H2, CH4, N2, O2, and CO2) by FERS with HCPCF. With a laser wavelength of 532 nm, laser power of 1.3 W, and 1 s exposure time, the LOD of N2, O2, CO2, CH4, and H2 are 140, 160, 80, 4, and 90 ppm bar, respectively. Compared with the HCPCF, the ARHCF has a larger core diameter and is easier to achieve efficient coupling and has lower transmission loss of about 80 dB/km at 532 nm or 13.8 dB/km at 539 nm, which is more conducive to signal enhancement. In addition, Andreas Knebl [27] first applied the ARHCF in FERS. With a laser wavelength of 532 nm, 1.3 W power, and a 30 s exposure time, the LODs of O2 and CO2 are 125 and 25 ppm bar, respectively. Duluo Zuo [28]integrated ARHCF into the Raman system, by collecting scattering radiation in the forward direction and filtering of the background through selection of an appropriate integral region, the LODs of CH4, C2H4, C2H2, C2H6, H2, and CO were determined as 1.2, 1.7, 2.6, 2.9, 13.8, and 16.7 ppm bar, respectively, with the input excitation laser power of 200 mW and exposure time of 60 s.
To our best knowledge, fiber-enhanced Raman spectroscopy for trace-gas sensing in a high-concentration gas background has not been reported. Therefore, in this article, we build FERS with ARHCF to realize the detection of multi-component trace gases in a high-concentration gas background. The performance of the apparatus is verified by the detection of decomposition gas in the high-concentration sulfur hexafluoride [29] (SF6) and gaseous impurities in the high-concentration ethane.
The experimental setup of the FERS with ARHCF in this work is shown in Figure 1. A solid Nd: YAG laser-emitting linearly polarized light with a wavelength of 532 nm and a power of 1.5 W is used as a light source. The half-wave plate (HP, Thorlabs WPV10L-532) is used to adjust the polarization and power of the laser beam when cooperating with the polarization beam splitter (PBS, Thorlabs CCM1-PBS251). After reflecting by a dichroic mirror (F, Semrock LPD02-532RU-25), the laser beam passes through achromatic lens L1 (Thorlabs AC254-060-A), focuses into the ARHCF, and excites gas molecules in the core of ARHCF to generate spherical divergent Raman scattered light. The Raman scattering light is collected backward from the fiber enter end (A1) by the same lens (L1) and passes through the dichroic mirror (F) and the two long-pass edge filters EF (532 nm Semrock LP03-532RE-25), which are used to filter out laser radiation, Rayleigh scattering signals, and anti-Stokes Raman scattering light. Then, the remaining Stokes Raman scattering light is focused and coupled into the spectrometer (Andor SR500) through the achromatic lens L2 (Thorlabs AC254-075-A) and recorded using the CCD camera (Andor iDus 416). The grating line is 1,200/mm, and the blaze wavelength is 750 nm.
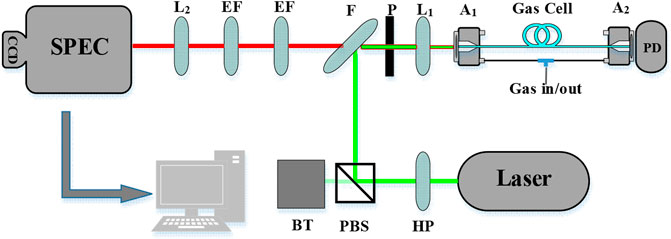
FIGURE 1. Schematic diagram of the FERS setup. The FERS setup consists of the following components: half-wave plate (HP), polarization beam splitter (PBS), dichroic mirror (F), pinhole (P), achromatic lens (L1, L2), gas cell (A1, A2), photodetector (PD), edge filter (EF), beam trap (BT), spectrometer (SPEC), and personal computer (PC).
The core diameter of ARHCF is 26 um. The transmission band is 440–1,200 nm with a loss at 532 nm of 80 dB/km, and the fiber length used in this work is 0.5 m. The pinhole (P) is for preliminary spatial filtering, which can adjust the laser spot size and filter the silicon signal of fiber by making full use of the spatial distribution pattern. The two ends of the fiber are fixed on the tapered V-groove fiber holder (Thorlabs HFV002) for better laser beam coupling. The holder is fixed in our self-made gas cells (A1, A2), which contain a pressure sensor to facilitate real-time acquisition of total gas pressure. The power meter (PD, Thorlabs PDA100A-EC) is placed at the output end of the fiber to monitor the laser output power in time.
The specific coupling parameters are measured using the beam quality analyzer (Thorlabs BC207VIS/M). The mode field diameter of the laser at L1 is 2 mm. The calculated mode field diameter of the fiber is 19.5 um according to the Gaussian beam lens transformation principle as in Eq. 1: (75% of the core diameter [30])
where F is the focal length of lens, λ is the laser wavelength, ω0 is the mode field diameter of the laser at a certain position, and ω1 is the mode field diameter of the fiber.
In order to achieve NA matching, the focal length of L1 needs to be 57.5 mm, which should be customized and expensive, so a 60-mm-focal length lens is used in this experiment. In order to precisely adjust the relative position of the achromatic lens L1 and the fiber to achieve efficient coupling, L1 is fixed on a manual three-axis micron-positioning stage. After measuring the incident and transmitted laser power through the ARHCF, which is 1.1 and 1.4 W, respectively, the coupling efficiency was calculated as about 85%.
Before loading the gas sample, the gas cells and ARHCF was first evacuated using a vacuum pump. Then, the measured gas was pumped into one of the gas cells (A2) to 5 bar. Finally, FERS of the measured gas can be detected after the internal pressure of the fiber reaches equilibrium.
SF6 is widely applied as the preferred insulating and arc-quenching medium in gas-insulated switchgear (GIS) in power systems. The equipment will inevitably yield defects during preparation, installation, and operation. Over the long-term operation, some SF6 molecules decompose and produce several lower fluorides of sulfur SFX (X = 1, 2….5) such as SF2, SF3, SF4, and SF5 through partial discharge, arc, spark, and overheating caused by insulation defects. In addition, if the solid insulation (organic materials such as epoxy resin) of GIS is damaged by partial discharge, trace carbon-containing gases such as COS, CF4, CO, and CO2 will be generated. Accurate detection of these trace gases in the SF6 background can diagnose the type and severity of the insulation defects as well as GIS failures. So, in this experiment, we used this FERS apparatus to detect multi-component trace gases (COS, CF4, CO2, and CO) in a high-concentration SF6 background. In order to achieve the qualitative and quantitative analysis of the aforementioned multi-component gases, we need to detect reference spectra of a single gas first.
The experimental condition of SF6 is under 5 bar, which is the working pressure of a running GIS. Figure 2 shows the Raman spectrum of pure SF6 under a low laser power of 100 mW. The peak position of the Raman spectrum is 774 cm−1, which corresponds to the v1 transition vibration mode of the SF6 molecule and proves that the saturated Raman peak is an independent peak.
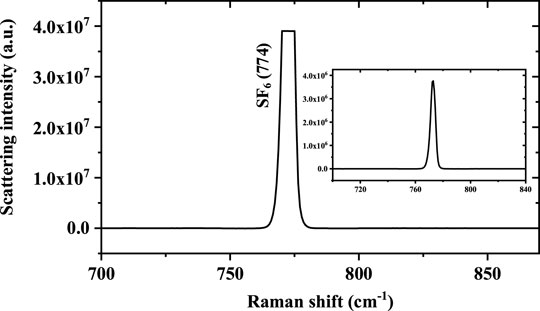
FIGURE 2. Raman spectrum of 5 bar pure SF6.
Figure 3 shows the Raman spectra of COS, CF4, CO, and CO2. Figure 3A shows the Raman spectrum of 0.05 bar COS (10,000 ppm of COS in Ar at 5 bar), and the exposure time is 60 s; the ν1 transition at 858 cm−1 and 2ν2 transition at 1,048 cm−1 are achieved, corresponding to the stretching vibration of C-S and bend vibration. According to three times the signal-to-noise ratio, the LOD is 11.6 Pa (858 cm−1), corresponding to 23.2 ppm at 5 bar. Figure 3B shows the Raman spectrum of 0.05 bar CF4 (10,000 ppm of CF4 in Ar at 5 bar), and the ν1 transition at 908 cm−1 is achieved, corresponding to the stretching vibration of C-F; the LOD is 24.2 Pa, equivalent to 48.5 ppm at 5 bar. Figure 3C shows the Raman spectrum of 0.05 bar CO2 (10,000 ppm of CO2 in Ar at 5 bar). A Fermi resonance pair (ν1/2ν2) is observed at 1,285 cm−1 (ν−) and 1,388 cm−1 (ν+), the hot band is observed at 1,409 cm−1, and 13CO2 can be also observed at 1,265 cm−1. A LOD of 0.54 Pa for CO2 (1,388 cm−1) is achieved, equivalent to 39.4 ppm at 5 bar Figure 3D shows the Raman spectrum of 0.05 bar CO (10,000 ppm of CO in Ar at 5 bar); the Q1 vibration of CO is observed at 2,142 cm−1, and the LOD is 52.4 Pa, corresponding to 104.8 ppm at 5 bar.
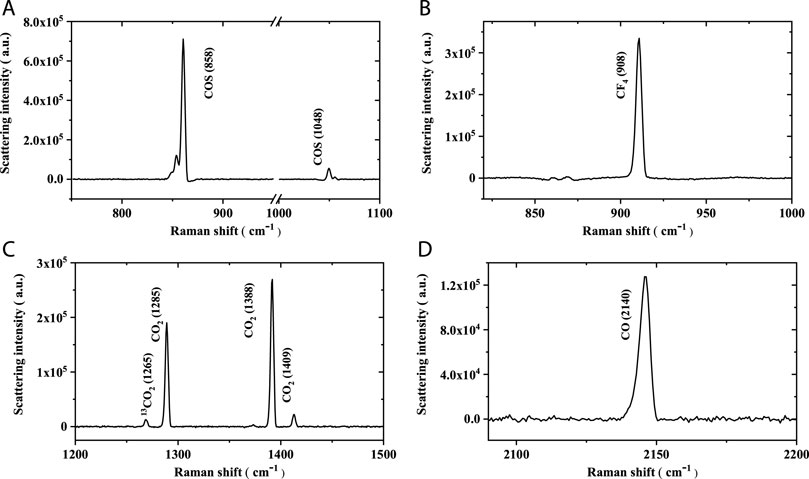
FIGURE 3. Raman spectrum of 0.05 bar gases, (A) COS, (B) CF4, (C) CO2, and (D) CO.
For online quantification of the concentrations of each gas in the high-concentration SF6 background, the Raman spectra of each gas should be taken at a known value of laser power, total pressure, exposure time, fiber length, and temperature. The test gas concentration (ratio of partial pressure to total pressure) will be acquired based on the peak intensity ratio of the calibration gas. We take COS, for example, as shown in Figure 4. This quantitative calibration is very robust owing to the linearity between partial pressure and Raman intensity, with an R-square value of 0.9997. The other gases have almost the same linear relationship.

FIGURE 4. Scattering intensity changes with partial pressure of COS. The R-square value is 0.9997.
Figure 5 shows the Raman spectra of trace multi-gas of COS, CF4, CO2, and CO in the high-concentration SF6 background (the concentration of each gas is COS: 100 ppm, CF4: 650 ppm, CO2: 450 ppm, and CO: 550 ppm, and the rest is SF6, the total pressure is 5 bar, and the exposure time is 60 s). Each peak can be identified for different gases, proving that Raman spectroscopy can be used to detect decomposition gas in the high concentration of SF6. Based on the built-up quantification curve of FERS, the calculated concentrations of COS, CF4, CO2, and CO are 105.6, 639.8, 437.3, and 542.9 ppm at 5 bar, respectively, which is basically consistent with the actual value. The measuring performance of FERS for SF6 depositions in the high-concentration SF6 background is summarized in Table 1.
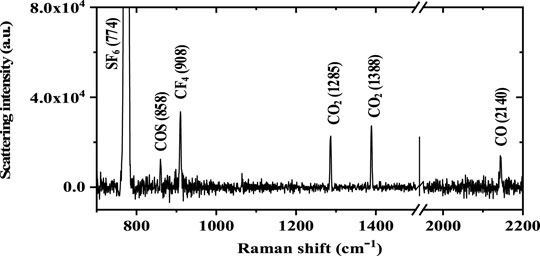
FIGURE 5. Fiber-enhanced Raman spectrum of trace COS, CF4, CO2, and CO in the high-concentration SF6 background.
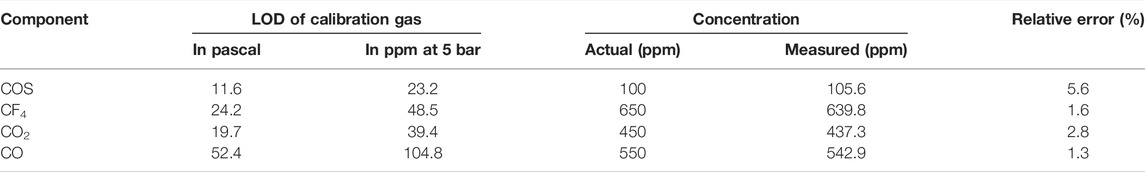
TABLE 1. Measuring performance of FERS for SF6 depositions in the high-concentration SF6 background.
Ethane of high-purity is an important raw material for the organic synthesis industry, but it often contains alkane impurities, such as methane, ethylene, acetylene, propane, propylene, and propyne. In this article, the FERS apparatus is also used to detect impurities in high-concentration ethane. Similarly, in order to be able to qualitatively and quantitatively analyze impurity gases, the detection of the aforementioned reference spectra of single gases, such as methane, ethylene, acetylene, propane, propylene, and propyne (from Chongqing Lihong company), is carried out first.
Figure 6 shows the Raman spectra of 250 Pa methane, ethane, ethylene, acetylene, propyne, propylene, and propane (500 ppm each gas in Ar at 5 bar). The Raman spectrum of CH4 is shown in Figure 6 (a), which mainly contains ν1 transition at 2,917 cm−1 and ν3 transition at 3,020 cm−1, and a LOD of 4.41 Pa for CH4 (2,917 cm−1) is achieved. The Raman spectrum of C2H2 is shown in Figure 6B, including ν1 transition at 3,372 cm−1 and the ν2 transition at 1972 cm−1, and a LOD of 6.18 Pa for C2H2 (1972 cm−1) is achieved. The Raman spectrum of C2H4 is shown in Figure 6C, which includes the δπs transition at 1,344 cm−1, the ν2πs transition at 1,624 cm−1, the 2δπa transition at 2,880 cm−1, and the νπs transition at 3,020 cm−1, and a LOD of 8.47 Pa for C2H4 (1,344 cm−1) is achieved. The Raman spectrum of C2H6 is shown in Figure 6D, including the ν5 transition at 2,997 cm−1, the ν3 transition at 2,900 cm−1, and the 2ν10 transition at 2,955 cm−1, and a LOD of 18.02 Pa for C2H6 (2955 cm−1) is achieved. The Raman spectrum of C3H4 is shown in Figure 6E, including the ν1 transition at 3,336 cm−1, the ν2 transition at 2,943 cm−1, the 2ν7 transition at 2,883 cm−1, the ν3 transition at 2,136 cm−1, and the ν5 transition at 930 cm−1, and a LOD of 7.79 Pa for C3H4 (2,943 cm−1) is achieved. The Raman spectrum of C3H6 is shown in Figure 6F, including the 4ν14 transition at 3028 cm−1, the 2ν2 transition at 3,010 cm−1, the ν5 transition at 2,997 cm−1, the ν1 transition at 2,937 cm−1, the 2ν14 + ν6 transition at 2,905 cm−1, the 2ν6 transition at 2,871 cm−1, the ν6 transition at 1,415 cm−1, the ν13 transition at 1,300 cm−1, and the ν8 transition at 921 cm−1, and a LOD of 36.1 Pa for C3H6 (2,935 cm−1) is achieved. The Raman spectrum of C3H8 is shown in Figure 6G, including the ν1 transition at 2,976 cm−1, the ν2 transition at 2,958 cm−1, the 2ν4 transition at 2,946 cm−1, the 2ν5 transition at 2,929 cm−1, the 2ν11 transition at 2911 cm−1, the ν3 transition at 2,885 cm−1, the overtone 2ν6 transition at 2772 cm−1, the ν5 + ν12 transition at 2,737 cm−1, and the ν8 transition at 868 cm−1, and a LOD of 16.64 Pa for C3H8 (2885 cm−1) is achieved.
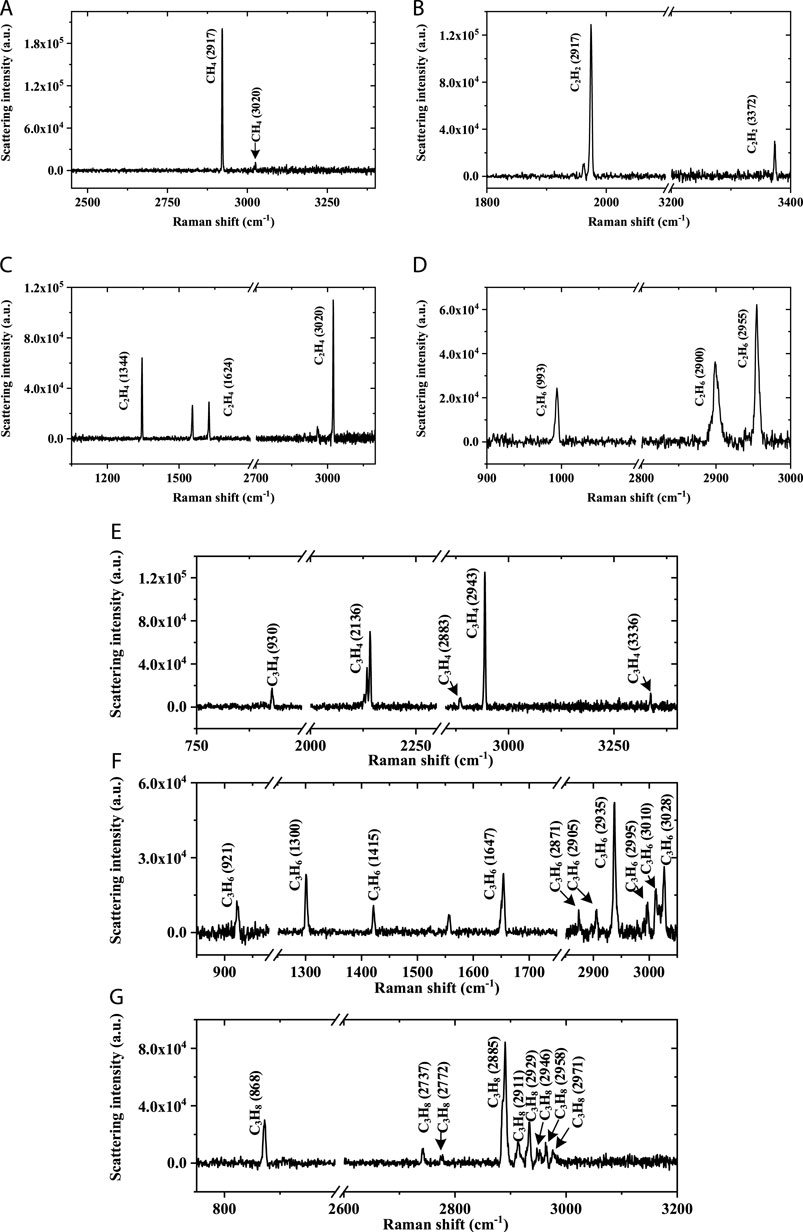
FIGURE 6. Raman spectra of 250 Pa of (A) CH4, (B) C2H2, (C) C2H4, (D) C2H6, (E) C3H4, (F) C3H6, and (G) C3H8.
The simulation detection of methane, ethylene, acetylene, propane, propylene, and propyne was also achieved as shown in Figure 7, which proves that FERS apparatus can be used to detect impurities in high-concentration ethane. The concentration of gaseous impurities in C2H6 is summarized in Table 2.
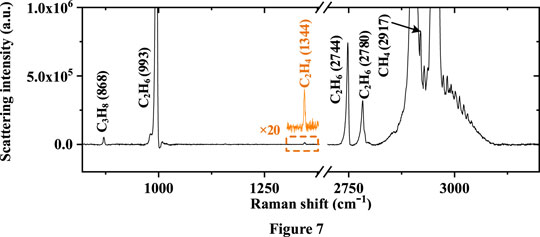
FIGURE 7. Fiber-enhanced Raman spectrum of impurities in the high-concentration C2H6 background.
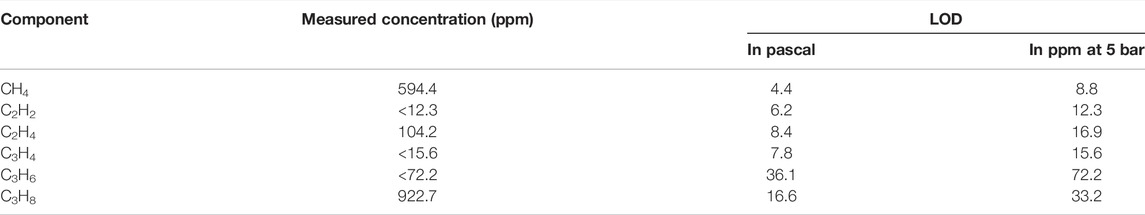
TABLE 2. Quantification of gaseous impurities in C2H6 based on FERS.
Figure 7 shows the Raman spectrum of alkane impurities in a high-concentration C2H6 background. The total pressure is 5 bar, and the exposure time is 60 s.
In this article, we demonstrate the utility of FERS with ARHCF as a unique analysis tool for trace-gas sensing in the high-concentration gas background of SF6 and C2H6. For NA matching, the 60-mm-focal length lens is employed in FERS. To obtain qualitative and quantitative analysis, the Raman spectra of COS, CF4, CO2, CO, CH4, C2H2, C2H4, C2H6, C3H4, C3H6, and C3H8 at standard concentration are acquired, respectively. With 60 s exposure time and 5 bar total pressure, the LOD for COS, CF4, CO2, CO, CH4, C2H2, C2H4, C3H4, C3H6, and C3H8 can be down to 23.2, 48.5, 39.4, 104.8, 8.8, 12.3, 16.9, 72.2, 15.6, and 33.3 ppm, respectively. It has been proved that the gas Raman scattering intensity has a good linear relationship with gas concentration. Quantification of multi-gas with great accuracy exceeding 94% is also realized. In order to further improve the performance of the system, in the future, we will improve the coupling efficiency of the ARHCF and reduce the signal noise to improve the signal-to-noise ratio of the system for practical multi-gas sensing.
The original contributions presented in the study are included in the article/Supplementary Material; further inquiries can be directed to the corresponding author.
GQ gets the first authorship. FW gets the senior authorship. FZ gets the last authorship. JW contributed equally and gets the last authorship. WK contributed equally and gets the last authorship. WC contributed equally and gets the last authorship.
This work was financially supported by the Project Fund for the National Natural Science Foundation of China (51977017), supported by the Chongqing Natural Science Foundation (cstc2021jcyj-msxmX0617), and supported by the National Engineering Laboratory for Ultra High Voltage Engineering Technology ((Kunming, Guangzhou), No. NEL202009).
The authors declare that the research was conducted in the absence of any commercial or financial relationships that could be construed as a potential conflict of interest.
All claims expressed in this article are solely those of the authors and do not necessarily represent those of their affiliated organizations, or those of the publisher, the editors, and the reviewers. Any product that may be evaluated in this article, or claim that may be made by its manufacturer, is not guaranteed or endorsed by the publisher.
1. Davidson EA, Trumbore SE, Amundson R. Soil Warming and Organic Carbon Content. Nature (2000) 408(6814):789–90. doi:10.1038/35048672
2. Wang P, Chen W, Wang J, Tang J, Shi Y, Wan F. Multigas Analysis by Cavity-Enhanced Raman Spectroscopy for Power Transformer Diagnosis. Anal Chem (2019) 92(8):5969–77. doi:10.1021/acs.analchem.0c00179
3. Loubar K, Rahmouni C, Le Corre O, Tazerout M. A Combustionless Determination Method for Combustion Properties of Natural Gases. Fuel (2007) 86(16):2535–44. doi:10.1016/j.fuel.2007.02.024
4. Sieburg A, Knebl A, Jacob JM. Characterization of Fuel Gases with Fiber-Enhanced Raman Spectroscopy. Anal Bioanal Chem (2019) 411:7399–408. doi:10.1007/s00216-019-02145-x
5. Chen JB, Bo DC, Gao M. Problems in Desulfurization and Purification Process for Oilfield Associated Gas and Concerning Solutions. Mod Chem Industry (2018) 38(6):167–72. doi:10.16606/j.cnki.issn0253-4320.2018.06.038
6. Shen CC, Cai XL, Sang YB. Investigation of Multispectral SF6 Stimulated Raman Scattering Laser. Chin Opt Lett (2020) 18(5):051402. doi:10.1364/COL.18.05140210.3788/col202018.051402
7. Zhang X, Zhang Y, Tang J, Cui Z, Li Y, Zhou H, et al. Optical Technology for Detecting the Decomposition Products of SF6: a Review. Opt Eng (2018) 57(11):110901. doi:10.1117/1.OE.57.11.110901
8. Zhang W, Chen L, Xiong D. The Determination of the Impurities in High-Purity Methane by Plasma Chromatography. Low Temperature and Specialty Gases (2018) 36(04):31–6.
9. Zhang X, Gui Y, Dong X. Preparation and Application of TiO2 Nanotube Array Gas Sensor for SF6-Insulated Equipment Detection: a Review. Nanoscale Res Lett (2016) 11(1):1–13. doi:10.1186/s11671-016-1516-4
10. Olthoff JK, Van Brunt RJ, Herron JT. Detection of Trace Disulfur Decafluoride in Sulfur Hexafluoride by Gas Chromatography/mass Spectrometry. Anal Chem (1991) 63(7):726–32. doi:10.1021/ac00007a015
11. Cui RY, Dong L, Wu HP. Highly Sensitive and Selective CO Sensor Using a 2.33 μm Diode Laser and Wavelength Modulation Spectroscopy. Opt Express (2018) 26:24318–28. doi:10.1364/OE.26.024318
12. Lang ZT, Qiao SD, Ma YF. Acoustic Microresonator Based In-Plane Quartz-Enhanced Photoacoustic Spectroscopy with a Line Interaction Mode. Opt Lett (2022) 47(6):1295–8. doi:10.1364/OL.452085
13. Liu XN, Ma YF. Sensitive Carbon Monoxide Detection Based on Light-Induced Thermoelastic Spectroscopy with a Fiber-Coupled Multipass Cell. Chin Opt Lett (2022) 20(3):031201. doi:10.3788/COL202220.031201
14. Herzberg G. Quadrupole Rotation-Vibration Spectrum of the Hydrogen Molecule. Nat (1949) 163(4135):170. doi:10.1038/163170a0
15. Haken H, Wolf HC. Molecular Physics and Elements of Quantum Chemistry: Introduction to Experiments and Theory. 2nd ed. Berlin: Springer Science & Business Media (2004). p. 220.
16. Fenner WR, Hyatt HA, Kellam JM. Raman Cross Section of Some Simple Gases. J Opt Soc A (1973) 63(1):73–7. doi:10.1364/JOSA.63.000073
17. Bao HH, Jin W. Tuning of Group Delay with Stimulated Raman Scattering-Induced Dispersion in Gas-Filled Optical Fiber. Chin Opt Lett (2020) 18(6):060601. doi:10.3788/COL202018.060601
18. Singh S, Bandyopadhyay MN. Dissolved Gas Analysis Technique for Incipient Fault Diagnosis in Power Transformers: A Bibliographic Survey. IEEE Electr Insul Mag (2010) 26(6):41–6. doi:10.1109/MEI.2010.5599978
19. Wang PY, Chen WG, Wan F. Cavity-enhanced Raman Spectroscopy with Optical Feedback Frequency-Locking for Gas Sensing. Opt Express (2019) 27:33311–24. doi:10.1364/OE.27.033312
20. Rupp S, Off A, Seitz-Moskaliuk H. Improving the Detection Limit in a Capillary Raman System for In Situ Gas Analysis by Means of Fluorescence Reduction. Sensors (2015) 15:23110–25. doi:10.3390/s150923110
21. Knebl A, Yan D, Popp J. Fiber Enhanced Raman Gas Spectroscopy. Trac-trend Anal Chem (2018) 103:230–8. doi:10.1016/j.trac.2017.12.001
22. Gao S, Wang Y, Ding W. Conquering the Rayleigh Scattering Limit of Silica Glass Fiber at Visible Wavelengths with a Hollow-Core Fiber Approach. Laser Photon Rev (2020) 14:1900241. doi:10.1002/lpor.201900241
23. Buric MP, Chen KP, Falk J. Improved Sensitivity Gas Detection by Spontaneous Raman Scattering. Appl Opt (2009) 48(22):4424–9. doi:10.1364/AO.48.004424
24. Hanf S, Keiner R, Yan D. Fiber-Enhanced Raman Multigas Spectroscopy: A Versatile Tool for Environmental Gas Sensing and Breath Analysis. Anal Chem (2014) 86(11):5278–85. doi:10.1021/ac404162w
25. Hanf S, Bögözi T, Keiner R. Fast and Highly Sensitive Fiber-Enhanced Raman Spectroscopic Monitoring of Molecular H2 and CH4 for Point-of-Care Diagnosis of Malabsorption Disorders in Exhaled Human Breath. Anal Chem (2014) 87(2):982–8. doi:10.1021/ac503450y
26. Yan D, Popp J, Frosch T. Analysis of Fiber-Enhanced Raman Gas Sensing Based on Raman Chemical Imaging. Anal Chem (2017) 89(22):12269–75. doi:10.1021/acs.analchem.7b03209
27. Knebl A, Domes R, Yan D. Fiber-Enhanced Raman Gas Spectroscopy for 18O–13c-Labeling Experiments. Anal Chem (2019) 91(12):7562–9. doi:10.1021/acs.analchem.8b05684
28. Bai Y, Xiong DS, Yao ZY. Analysis of CH4, C2H6, C2H4, C2H2, H2, CO, and H2S by Forward Raman Scattering with a Hollow-Core Anti-resonant Fiber. J Raman Spectrosc (2022). doi:10.1002/jrs.6320
29. Tang J, Zeng F, Pan J. Correlation Analysis between Formation Process of SF6 Decomposed Components and Partial Discharge Qualities. IEEE Trans Dielect Elect Insul (2013) 20(3):864–75. doi:10.1109/TDEI.2013.6518956
Keywords: anti-resonant hollow core fiber, fiber-enhanced Raman spectroscopy, trace-gas sensing, SF6, high selectivity
Citation: Qian G, Wan F, Zhou F, Wang J, Kong W and Chen W (2022) Fiber-Enhanced Raman Spectroscopy for Trace-Gas Sensing in the High-Concentration Gas Background With an Anti-Resonant Hollow Core Fiber. Front. Phys. 10:917688. doi: 10.3389/fphy.2022.917688
Received: 11 April 2022; Accepted: 29 April 2022;
Published: 24 June 2022.
Edited by:
Yufei Ma, Harbin Institute of Technology, ChinaReviewed by:
Jun Jiang, Nanjing University of Aeronautics and Astronautics, ChinaCopyright © 2022 Qian, Wan, Zhou, Wang, Kong and Chen. This is an open-access article distributed under the terms of the Creative Commons Attribution License (CC BY). The use, distribution or reproduction in other forums is permitted, provided the original author(s) and the copyright owner(s) are credited and that the original publication in this journal is cited, in accordance with accepted academic practice. No use, distribution or reproduction is permitted which does not comply with these terms.
*Correspondence: Fu Wan, ZnUud2FuQGhvdG1haWwuY29t
Disclaimer: All claims expressed in this article are solely those of the authors and do not necessarily represent those of their affiliated organizations, or those of the publisher, the editors and the reviewers. Any product that may be evaluated in this article or claim that may be made by its manufacturer is not guaranteed or endorsed by the publisher.
Research integrity at Frontiers
Learn more about the work of our research integrity team to safeguard the quality of each article we publish.