- 1National Key Laboratory of Science and Technology on Tunable Laser, Harbin Institute of Technology, Harbin, China
- 2Institute of Opt-Electronics, Harbin Institute of Technology, Harbin, China
In this study, a 100-kHz narrow-linewidth burst-mode laser system combined with a master oscillator power amplifier (MOPA) structure was reported with a stable pulse burst profile over 2 ms duration. A theoretical model was established to characterize and compensate the variation characteristics of coefficient of variation (COV) within a burst envelope for the double-pass three-stage amplification system, in terms of different parameter factors. Simulated results yielded similar tendency with the measured ones. For a stable burst envelope with a COV of 2.72% and 2.93%, output pulse energy at a 100 kHz repetition rate was scaled up to 1.08 and 4.38 mJ in the case of an input average pulse energy of 8.6 and 116.51 nJ, respectively. Corresponding Mx2 and My2 values with 2.2 and 2.4 were endowed with 1.08 mJ output single-pulse energy and 2.7 and 2.1 for 4.38 mJ pulse energy. The spectral linewidth of amplified pulses was measured to be less than 83.1 and 67.9 MHz, with respect to output pulse duration of 10.3 and 96.1 ns, respectively.
1 Introduction
The parameter measurements (e.g., temperature, velocities, and mixture fraction) for high-speed flows have greatly boosted the advancements of aerospace and scramjet by use of optical imaging techniques [1–6]. Especially, the solid-state laser system, with a high rate and high energy [7–11], has great potential for optical diagnostic applications, such as planar laser-induced fluorescence (PLIF) [12–14], particle imaging velocimetry (PIV) [15, 16], and filtered Rayleigh scattering (FRS) [17, 18]. Among those measuring techniques, FRS serves as a promising approach in imaging high-speed reacting flames and non-reacting jets for its strong suppression in background noise, with the same wavelength as an input laser, from the Mie scattering and windows and highlights weaker broadened Rayleigh–Brillouin scattering (RBS) signal intensity. Typically, the turbulent reacting and non-reacting flow fields are commonly featured with frequencies up to hundreds of kilohertz [19], and the adopted laser sources are required with high-rate operation to enable high temporal resolution for sufficient analysis of time-varying flow information via the FRS imaging technique. In addition, the collected FRS imaging intensity is dependent on pulsed laser energy, which allows for the laser system with high-energy pulses to enhance the signal-to-noise ratio (SNR) in supersonic–hypersonic flow fields. As a result of advancement in the diode-pumped solid-state (DPSS) laser, it is capable of producing a pulsed laser with frequencies up to tens to hundreds of kilohertz [20, 21]. However, severe thermal loading at the high repetition rate comes into formation in the gain module to further constrain high-energy pulse laser generation.
The burst-mode technique, coupled with DPSS sources, can provide an effective method for both high-rate and high-energy pulsed laser, which is filled with multiple benefits featured with high efficiencies and significant beam characteristics compared with a traditional repetitively Q-switched continuously pulsed laser. Hence, such an effective pulse burst laser has attracted much more interests for achieving high repetition rate with significant pulse energy at low average power, by integrating a series of pulses into a burst envelope and reducing the duty cycle for thermal dissipation. In 2014, Slipchenko et al reported a 100-kHz dual-wavelength diode-pumped Nd:YAG burst-mode laser centered at 1,064 nm, with average pulse energy as high as 40 mJ per pulse over 100 ms burst duration [22]. In 2017, Wu et al illustrated a 100-kHz cavity-dumped burst-mode laser system with 2 ms burst duration, realizing the maximum pulse energy of 9.47 mJ per pulse and the energy extraction efficiency of 30% [23]. In 2019, Smyser et al investigated a burst-mode laser system for generating a high-peak power pulse laser, from which peak power reached 1.24 GW at the 100-kHz repetition rate over 1 ms burst duration with a transform-limited pulse width of 234 fs [24].
In supersonic–hypersonic flow field diagnosis, the FRS scheme necessitates to put forward some additional requirements for performances of laser sources further (e.g., narrow spectral linewidth, stable burst envelope, and so on). Specifically, such narrow-linewidth sources can enhance the transmission purity of stimulated RBS with a temperature-based thermal broadening spectral profile, when a molecular iodine vapor cell serves as a filtering narrow-linewidth background with a similar spectrum to that of the input laser and stable pulse-to-pulse intensity distribution benefits a series of time-relevant uniform FRS imaging intensity within recorded length. In the burst-mode laser system, a short-cavity oscillator based on Q-switching could provide with high-energy pulses, as illustrated in [25, 26], while seeding of those Q-switching lasers is restrictive of their applications in which narrow-linewidth is requisite. During burst-mode amplification, it is interestingly found that the first several pulses are endowed with higher- or lower-intensity distribution, resulting in inhomogeneous intensity variation within the burst envelope, which could further yield significant fluctuation of collected imaging intensity for flow field diagnosis. Hence, a theoretical model is built to give possible investigation and compensation for pulse intensity variation in terms of multiple factors, resulting in dynamic equilibrium in both pumping and amplification for a stable burst envelope. The burst-mode laser could play a significant component in optical diagnosis based on the FRS imaging technique, especially for these measuring relevant to multiple parameters in high-speed flow fields. In 2018, Feng et al illustrated the FRS intensity sensitivity to temperature and pressure in hot jets by utilizing a burst-mode source with total burst energy of 20 mJ per burst and 30 pulses within a burst at 63 MHz spectral linewidth [27].
In this work, a 100-kHz burst-mode master oscillator power amplifier (MOPA) laser was illustrated with narrow spectral linewidth for a stable burst envelope. Pulse intensity variation was investigated within the burst envelope theoretically and experimentally for multiple parameter factors. A stable burst envelope was characterized with the coefficient of variation (COV) of 2.72% and 2.93%, with respect to the burst energy of 217.08 and 880.38 mJ per burst at 2 ms duration, respectively. Relevant spectral linewidth was measured to be less than 83.1 and 67.9 MHz.
2 Theoretical Analysis
In terms of burst envelope intensity variation, it is investigated starting from pulse amplification. The process of amplification is first based on the energy stored in the gain medium before the arrival of the input beam, and then the pulse is amplified with depletion of some particles when passing through an amplifier. For stored energy, the basic expression illustrated in the study mentioned in reference [28] has been deduced by Mance et al by means of solving the differential equation. If we take into account the necessary energy transfer factors, the stored energy Estore could be further developed and presented in Eq. 1, where Ei is initial energy storage in gain medium, τf is upper-level fluorescence lifetime of the Nd:YAG crystal, P is pump peak power, ηa is absorption efficiency of the input pump beam in active medium, ηs is Stokes transfer efficiency, and ηq is expressed as quantum transfer efficiency.
Output energy after amplification could be illustrated by the Frantz–Nodvik formula [29, 30] in the case of known input energy Ein, saturation energy fluence Esat, pump area Sp, and small signal gain factor G0, the expression of which is given by
where the small signal gain factor G0 is determined by stored energy Estore, saturation energy fluence Esat, and pump area Sp. The nonlinear relationship among these parameters is denoted as follows:
The pump and amplification cycle for the pulse burst laser is exhibited in Figure 1A. To simplify the cycle process, some assumptions are carried out for neglecting the amplified spontaneous emission (ASE) effect and ignoring pump time during pulse laser duration. Initially, there is no energy stored in gain medium, resulting in Ei = 0, before pump injecting into the active medium and then stored energy comes into formation during pump time τ (delay time between pumping and the first pulse amplification) by using Ei = 0 in Eq. 1; after that the first pulse within the burst envelope is amplified through Eq. 2 on basis of accumulated energy storage. Meanwhile, the remaining energy is endowed as Ei to prepare stored energy for the next pulse during pump time τp, and the second pulse reaches its amplification with energy being extracted. Such an iteration process is repeated continuously within the burst envelope until output pulses obey convergence distribution featured with stable tendency. As for double-pass or multistage amplification, an additional process is supplemented here such that the output from the first pass is the input of the second pass and output of the previous stage becomes the input for next stage. Therefore, a model suitable for pulsed pumped amplification could be established to investigate the intensity variation within the burst envelope in diverse burst-mode amplification configurations.
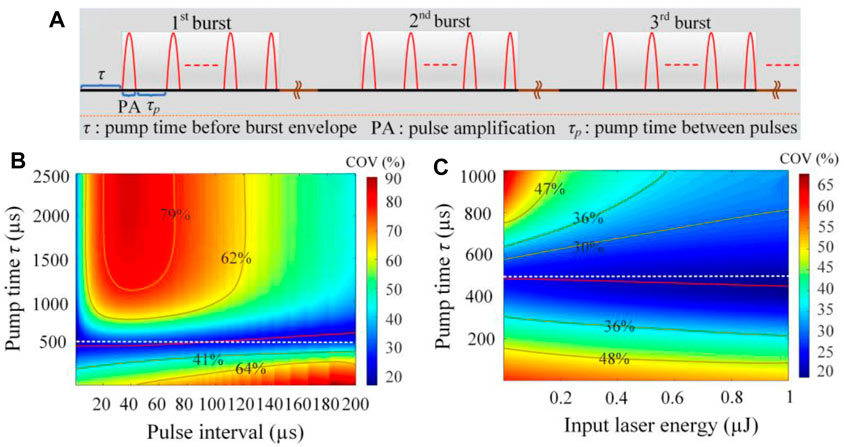
FIGURE 1. (A) Schematic of the pump and amplification cycle for the pulse burst laser; (B) COV versus pump time τ and pulse interval; (C) COV versus pump time τ and input seed energy.
Figure 1B illustrates the dependence of COV (defined as the ratio of standard deviation within the burst envelope into the mean) on pump time τ and pulse interval in the double-pass, three-stage amplification system over 2 ms burst duration based on the aforementioned model. In this simulation, the adopted basic parameter values are given in Table 1, and amplifiers are provided with pump areas of 0.071, 0.071, and 0.283. With increasing pump time τ from 1 μs and decreasing from 2,500 µs, the variation of the COV exerts a gradual upward and downward trend, respectively and then finally possesses relatively stable distribution at approximately 500 µs (dashed white line) in the range of the pulse interval from 1 to 200 µs(5 kHz–1 MHz) toward the amplification system with pump peak power of 900 W, 900 W, and 2800 W for constant energy transfer factors. At higher pump time τ, the first few pulses could obtain more stored energy due to high gain in active medium, resulting in less energy for subsequent amplification. Moreover, the opposite could occur in burst-mode amplification with lower pump time τ. The obvious COV variation for different pump time τ, at a specific repetition rate, is mainly due to the lack of dynamic equilibrium in pumping and amplification. Typically, it is conducive to reach high-energy pulse amplification for a low repetition rate. In that case, relatively high pump time τ is required to compensate for the excessive energy extraction to sustain dynamic equilibrium between pumping and amplification within the burst envelope at the low repetition rate compared with high frequency. Hence, there is an increasing trend of pump time τ at stable COV distribution (red line) based on simulated results, with respect to a pump interval range of 1–200 µs (5 kHz–1 MHz).
The COV versus pump time τ and input seed energy is presented in Figure 1C at a 100-kHz repetition rate. The COV variation also shows a trend of decreasing first and then increasing in the case of increasing pump time τ from 1 to 1,000 μs for different input laser energy (1 nJ–1 μJ), induced by non-equilibrium for pumping and amplification. At stable COV distribution, pump time τ versus input seed energy is indicated with a red line. With increasing of input laser energy from 1 nJ–1 μJ, the pump time τ for achieving a stable envelope shows a decreasing trend, moving away from the white dashed line gradually (τ = 500 µs). Due to increase of input laser energy, the saturation effect tends to come into formation in pulse amplification, resulting in the burst envelope close to steady-state distribution. Consequently, lower pump time τ is required to compensate for weaker variation within the burst envelope at higher input laser energy. In addition, the variation of the COV is endowed with approximately decreasing tendency at specific pump time τ for increasing the input laser energy in the range of 1 nJ–1 μJ, which might also be attributed to saturation effect.
3 Experimental Setup
The schematic of the fiber-bulk MOPA burst-mode laser system is presented in Figure 2. The fiber laser seed is provided with 24-mW continuous wave (CW) laser centered at 1,064.201 nm with spectral linewidth of less than 10 kHz. The spectral wavelength is tunable over a spanning of 30 GHz by adjusting the voltage imposed on a piezoelectric transducer (PZT) to match the seed laser wavelength. Both the 975-nm laser diodes (LDs) are coupled into two Yb-doped fiber amplification stages to scale CW seed power up to the watt level. A fiber-coupled acousto-optic modulator (AOM) is introduced into the optical path for the slicing-amplified CW laser into a pulse train with arbitrary duration, which is directly controlled by an AOM driver that is dependent on an external SRS DG645 delay generator. The AOM is preferred in enhancing the contrast ratio of laser intensity to the background due to its faster falling edge than the electro-optic modulator (EOM) can do. For an all-fiber system, the used gain fiber and transmission fiber are featured with single longitudinal mode and polarization maintenance, which is with respect to the fiber size of 5/130 μm and a numerical aperture (NA) of 0.12 for gain fiber and 6/125 μm and 0.1 in transmission fiber.
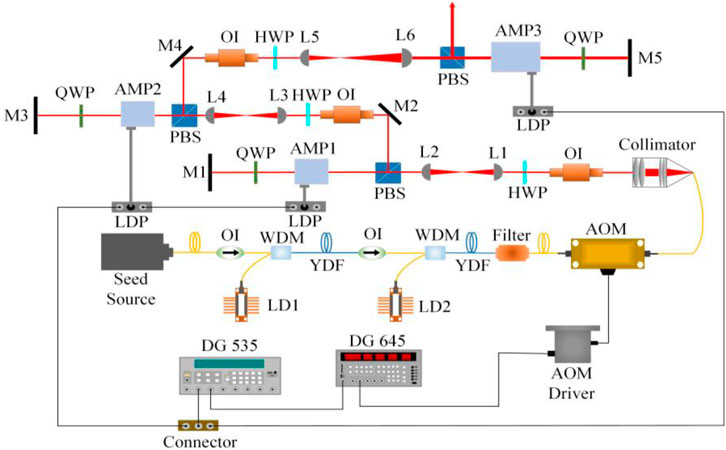
FIGURE 2. Optical layout of the burst-mode laser system. OI: optical isolator, LD: laser diode, WDM: wavelength division multiplex, YDF: Ytterbium-doped fiber, AOM: acousto-optic modulator, HWP: half-wave plate, PBS: polarizing beam splitter, QWP: quarter-wave plate, AMP: amplifier module, DG: delay generator, and LDP: laser diode power supply.
The pulse amplification system consists of three LD side-pumped Nd:YAG modules, with Nd3+ doping concentration and rod dimensions of 1 at% and Φ3 × 67 mm2 (AMP1 and AMP2), 1 at% and Φ6 × 85 mm2 (AMP3), respectively. First, two amplifier modules are involved with three diode arrays distributed at an angle of 120o for each other, and the third contains seven diode arrays arranged symmetrically in different directions. All the amplification stages are designed in double-pass configurations for realizing the high-gain pulsed laser. Two pairs of plano-convex lenses (fL1 = +50 mm and fL2 = +50 mm; fL3 = +50 mm and fL4 = +50 mm) are responsible for delivering excellent beam characteristics for pulses amplification, while another one (fL5 = +100 mm, fL6 = +200 mm) is used for matching the pulsed laser with AMP3. The optical isolator (OI) is placed in front of each amplifier so as to prevent feedback of backward beam propagation. Amplified pulses are returned through a 0o reflector with high reflectivity (HR) coated at 1,064 nm and then passed through a quarter-wave plate (QWP) the second time and are eventually reflected by a polarizing beam splitter (PBS), close to AMP3, with the maximum polarization extinction ratio (PER) of more than 30 dB. The operation temperature was set to 25°C for the burst-mode laser amplification system.
For time-sequence controlling of the burst-mode laser system, an SRS DG535 is utilized to offer two channels with a delay time, one is first connected with laser diode power supplies (LDP) for synchronous triggering of pumping, and another one is applied to DG645 for AOM modulation after a delay time. The time controlling on the whole is accomplished using the SRS DG535 delay generator combined with an SRS DG645 delay generator.
4 Results and Discussion
4.1 Seed Characterization
Output single-pulse energy was measured and plotted in Figure 3 for different repetition rates over 2 ms burst duration. From the measured results, the obtained pulse energy was provided with an approximately linear increase with the increasing of absorbed pump power and possessed similar distribution at different repetition rates. In Figure 3A, the maximum output pulse energy was expressed as 8.61, 8.47, 8.67, and 8.64 nJ for absorbed pump power of 2.53 W at the injected modulation signal with single-pulse duration of 10 ns, with respect to the repetition rate of 10 kHz, 20 kHz, 50 kHz, and 100 kHz, respectively. In the case of injected electric signal varying into 100 ns, the corresponding maximum output pulse energy reached 116.75, 115.92, 116.94, and 116.41 nJ as exhibited in Figure 3B, from which the enlarged resulted from the higher-duty cycle in the injected modulation signal.
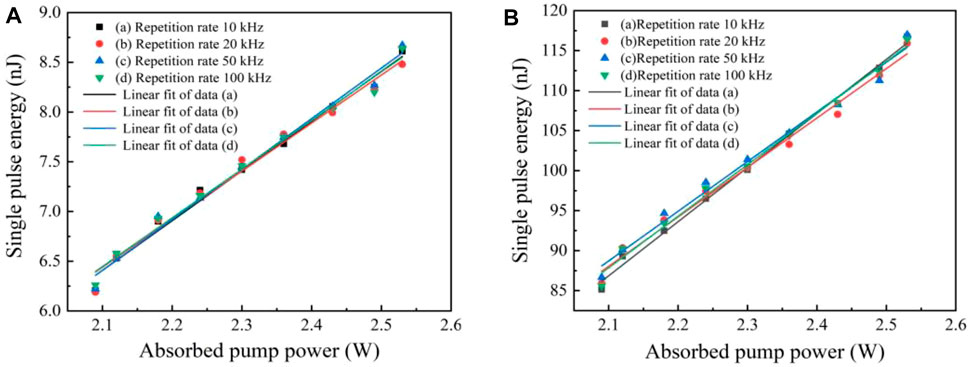
FIGURE 3. Output single-pulse energy versus absorbed pump power. (A) For electric signal input with single-pulse duration of 10 ns. (B) At modulation signal input with a single pulse width of 100 ns.
Figure 4 presented the recorded output burst envelope with 2 ms duration in the range of repetition rates from 10 to 100 kHz, consisting of pulses counts with 21–201. It could be seen that there was no obvious emergence of pulses loss in burst train distribution. As shown in Figures 4A–D, the output burst envelope was uniformly distributed with a COV of 0.91%, 0.89%, 0.82%, and 0.86% for the electric signal input of 10 ns, corresponding to 10 kHz, 20 kHz, 50 kHz, and 100 kHz repetition rates, respectively. In terms of the input modulation signal changing into 100 ns, the relevant burst train with a COV of 1.04%, 0.84%, 0.97%, and 0.95% was further formed and exhibited in Figures 4E–H, respectively. The recorded output burst envelope was possessed with uniform and flat distribution at the repetition rate of 10–100 kHz, indicating the stable modulation characteristics for the external electric signal input with arbitrary duration.
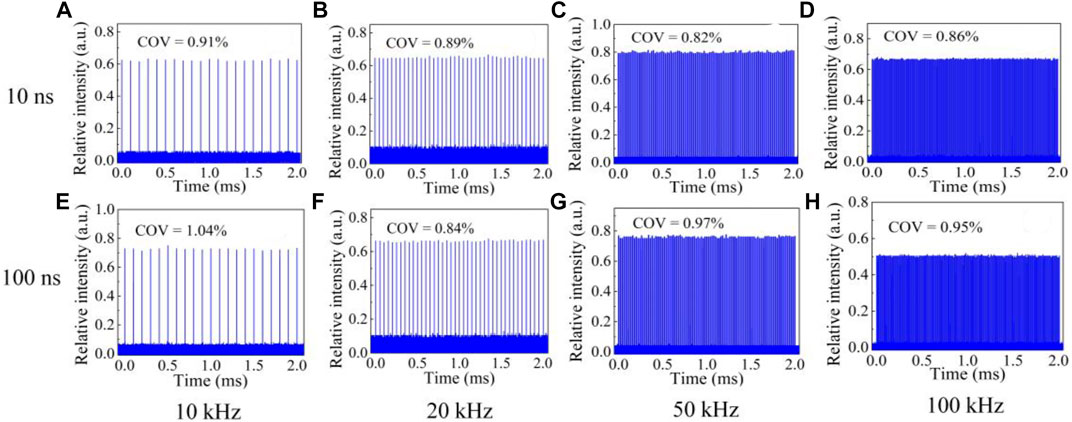
FIGURE 4. Recorded output pulse-burst profile at different repetition rates in terms of electric signal input with duration of 10 and 100 ns, respectively. (A) At 10 kHz repletion rate for 10 ns electric signal input. (B) At 20 kHz repletion rate for 10 ns electric signal input. (C) At 50 kHz repletion rate for 10 ns electric signal input. (D) At 100 kHz repletion rate for 10 ns electric signal input. (E) At 10 kHz repletion rate for 100 ns electric signal input. (F) At 20 kHz repletion rate for 100 ns electric signal input. (G) At 50 kHz repletion rate for 100 ns electric signal input. (H) At 100 kHz repletion rate for 100 ns electric signal input.
At the 100-kHz repetition rate, the output individual pulse waveform approximately exerted Gaussian-like distribution as shown in Figure 5C due to the faster rising/falling time of 10 ns for the AOM in the case of the external square wave signal input with 10 ns in Figure 5A. Moreover, the nearly flat-top pulse profile distribution is presented in Figure 5D for an external electric signal input of 100 ns shown in Figure 5B. The output pulse laser duration was measured as 10.8 and 98 ns, with respect to the output pulse energy of 8.64 and 116.41 nJ, respectively.
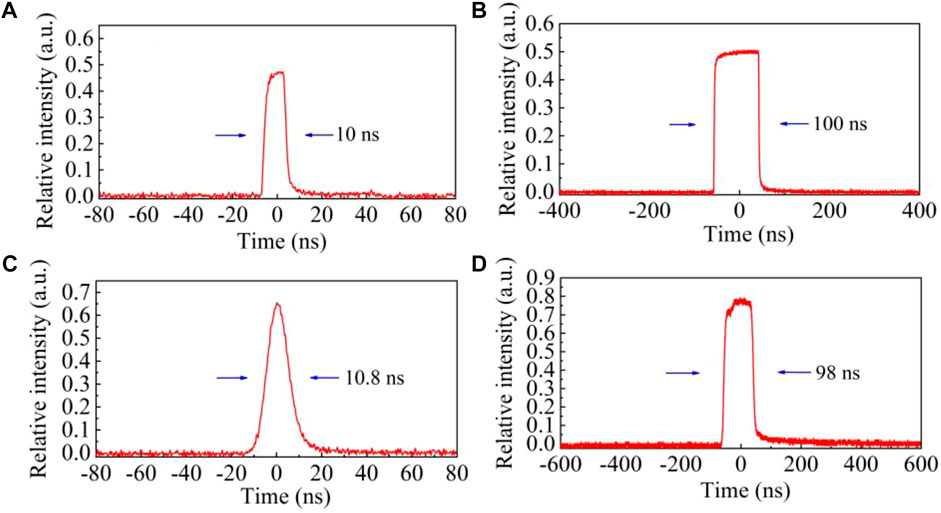
FIGURE 5. Recorded input electric signal waveform and the output single-pulse laser profile at the 100 kHz repetition rate. (A) Input electric signal waveform with duration of 10 ns. (B) Input electric signal profile with duration of 100 ns. (C) Output single pulse laser with pulse duration of 10.8 ns. (D) Output single pulse laser with a pulse width of 98 ns.
4.2 Free-Space Operation
The output burst envelope during 2 ms duration, through a double-pass, three-stage amplification construction, was recorded and presented in Figure 6 at different pump time τ (pump time before burst envelope), with the average input pulse energy of 116.51 nJ for the repetition rate of 10 kHz, 20 kHz, 50 kHz, and 100 kHz. In the first few pulse distribution, it was exerted with gradually increasing intensity distribution at pump time τ of 0.2 ms as shown in Figures 6A–D, which was induced by weaker amplification of the initial pulse to accumulate more stored energy for subsequent pulses. However, the relatively higher intensity dispersion occurred in the first several pulses due to excessive compensation brought by higher pump time τ of 1 ms, resulting in a convex burst envelope with the triangle-like distribution. For a horizontal comparison at pump time τ of 0.5 ms, the pulse burst distribution in Figure 6E was different and induced by inadequate compensation, while the excessive compensation occurred in Figures 6F–H. Compared with pump time τ of 0.2 and 1 ms, it yielded decreasing variation of the COV within the burst envelope for different repetition rates at a pump time τ of 0.5 ms. Such a variation trend of COV was consistent with the simulated results. Also, it was found in later experiments that the dispersion of the recorded burst envelope was provided with similar variation tendency for input pulse energy varying into 8.6 nJ.
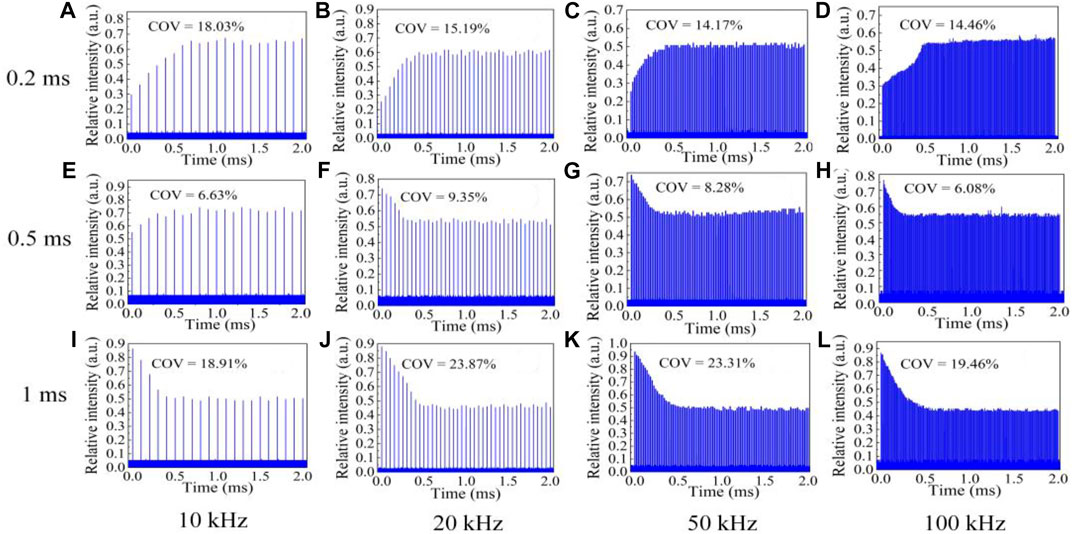
FIGURE 6. Recorded pulse-burst distribution at different pump time τ for different repetition rates. (A) At 10 kHz repetition rate for pump time τ with 0.2 ms. (B) At 20 kHz repetition rate for pump time τ with 0.2 ms. (C) At 50 kHz repetition rate for pump time τ with 0.2 ms. (D) At 100 kHz repetition rate for pump time τ with 0.2 ms. (E) At 10 kHz repetition rate for pump time τ with 0.5 ms. (F) At 20 kHz repetition rate for pump time τ with 0.5 ms. (G) At 50 kHz repetition rate for pump time τ with 0.5 ms. (H) At 100 kHz repetition rate for pump time τ with 0.5 ms. (I) At 10 kHz repetition rate for pump time τ with 1 ms. (J) At 20 kHz repetition rate for pump time τ with 1 ms. (K) At 50 kHz repetition rate for pump time τ with 1 ms. (L) At 100 kHz repetition rate for pump time τ with 1 ms.
For stable pulse burst profile output, it is exhibited in Figure 7 at repetition rates of 10 kHz, 20 kHz, 50 kHz, and 100 kHz in terms of the input pulse energy of 8.6 and 116.51 nJ. The COV of recorded burst train, from Figures 7A–D, was measured to be 2.69%, 2.75%, 2.38%, and 2.72% at 8.6 nJ pulse energy input, corresponding to a COV with 2.53%, 2.29%, 2.33%, and 2.93% presented in Figures 7E–H for 116.51 nJ pulse energy input. At stable burst envelope distribution, the required pump time τ versus the repetition rate was investigated and given in Figure 8A, with respect to different pulse energy input. There was a decreasing trend for pump time τ with increasing of the repetition rate from 10 to 100 kHz, also shown was endowed with decreasing tendency of pump time τ for higher pulse-energy input, indicating the consistent trend with the simulated ones in the abovementioned section. At the 100 kHz repetition rate, the output single-pulse profile with a duration of 10.6 and 96.1 ns is recorded in Figures 8B, C, respectively. Here, it could be seen that relatively steep distribution emerged for leading edge compared with the trailing edge at the output pulse temporal waveform with 96.1 ns duration, resulting from consumption of more inversion particles in leading edge during approximately flat-top pulse amplification.
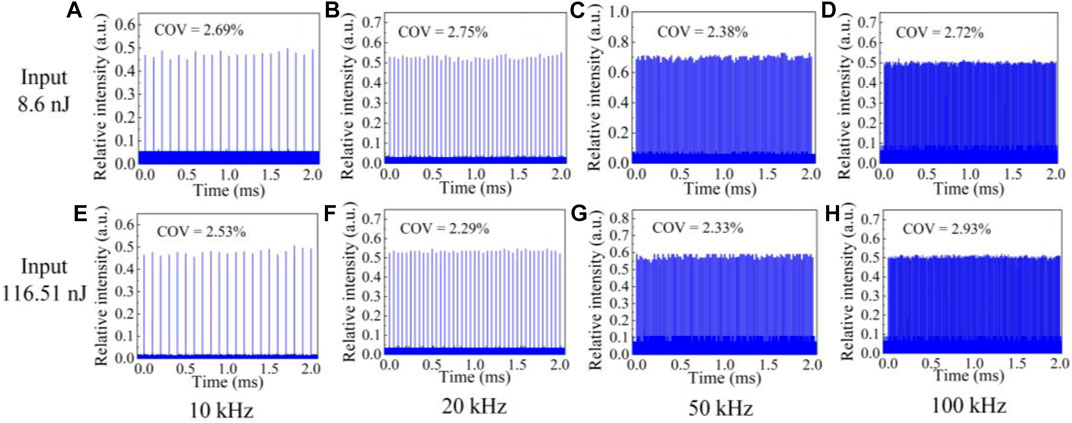
FIGURE 7. Recorded stable burst envelope output at different repetition rates for different input energy. (A) At 10 kHz repetition rate for 8.6 nJ input. (B) At 20 kHz repetition rate for 8.6 nJ input. (C) At 50 kHz repetition rate for 8.6 nJ input. (D) At 100 kHz repetition rate for 8.6 nJ input. (E) At 10 kHz repetition rate for 116.51 nJ input. (F) At 20 kHz repetition rate for 116.51 nJ input. (G) At 50 kHz repetition rate for 116.51 nJ input. (H) At 100 kHz repetition rate for 116.51 nJ input.
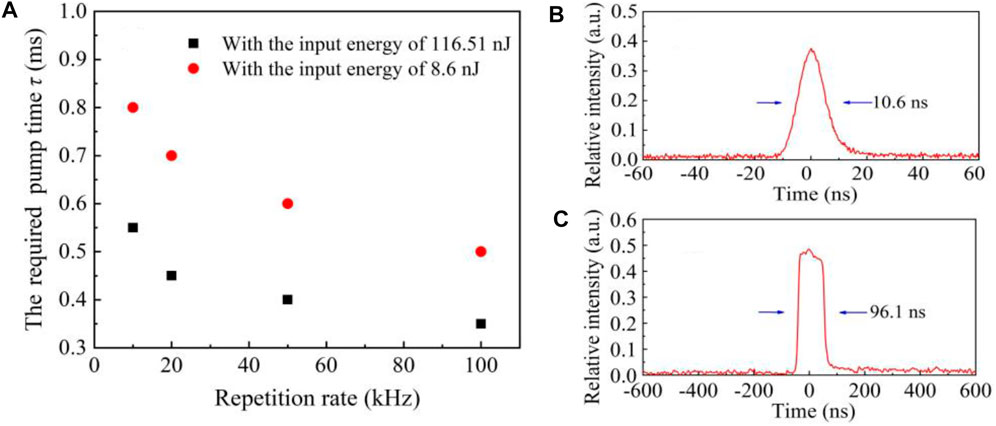
FIGURE 8. (A) Pump time τ versus repetition rate at stable burst profile distribution for different input energy. (B) Recorded output single-pulse profile at the 100 kHz repetition rate with a pulse width of 10.6 ns. (C) Recorded output single-pulse waveform at the 100-kHz repetition rate for pulse duration with 96.1 ns.
The double-pass output laser energy was measured and plotted in Figures 9A, B at different repetition rates for the stable burst envelope distribution, in terms of the input single-pulse energy of 8.6 and 116.51 nJ respectively. The amplified single-pulse energy at a lower repetition rate was provided with obvious advantages over a higher repetition rate with the increasing of input pump peak power, while the contrary tendency occurred in variation of burst envelope energy. In the case of the input single-pulse energy of 8.6 nJ, the maximum output single-pulse energy, at total input pump peak power with 4600 W, was measured to be 1.52 and 1.43 mJ for repetition rates of 10 and 20 kHz, 1.22 and 1.08 mJ at a repetition rate of 50 and 100 kHz, which corresponded to the burst envelope energy of 31.92, 58.63, 123.22, and 217.08 mJ, respectively. Moreover, it was scaled up to as high as 10.1, 7.08, 5.92, and 4.38 mJ due to the higher input single-pulse energy of 116.51 nJ, respectively, resulting in burst envelope energy with 212.1, 290.28, 597.92, and 880.38 mJ. At the 100 kHz repetition rate, the resulting amplification factor (the ratio of output pulse energy into input pulse energy) was endowed with 1.26 × 10⁵ (51 dB) at the input single-pulse energy of 8.6 nJ and 3.76 × 10⁴ (45.75 dB) was provided for 116.51 nJ single-pulse energy input.

FIGURE 9. Output burst energy and single-pulse energy versus input pump peak power at different repetition rates during double-pass amplification. (A) At the input single-pulse energy of 8.6 nJ. (B) For the input single-pulse energy of 116.51 nJ.
The spectral profile of the MOPA output, at the 100 kHz repetition rate, was measured by means of the scanning Fabry–Perot interferometer with a free spectral range (FSR) of 10 GHz and resolution of 67 MHz. From Figure 10A, the measured spectral linewidth, FWHM of Lorentz fit, was expressed as 83.1 MHz for 1.08 mJ pulse energy output, operating with 10.3 ns pulse width. At the output pulse energy of 4.38 mJ, the measured spectral linewidth with 67.9 MHz, approximately the spectral resolution, is shown in Figure 10B, with respect to pulse duration of 96.1 ns In fact, the obtained spectral profile could be regarded as the convolution between the Fabry–Perot resonator mode and Fourier transform of relevant pulse duration from the actual MOPA output, resulting in the broadened spectral profile. Hence, the actual spectral linewidth was less than the measured ones for the 100-kHz repetition rate at maximum MOPA output.
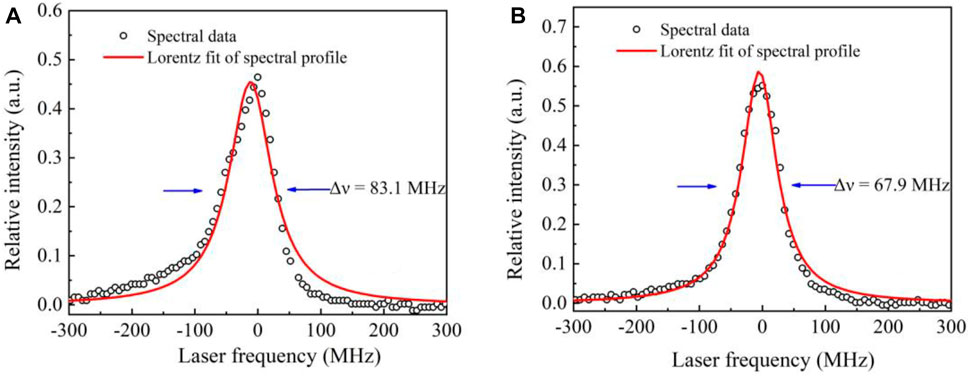
FIGURE 10. Spectral profile of MOPA output at the 100-kHz repetition rate. (A) For 1.08 mJ single-pulse energy output with a pulse width of 10.3 ns. (B) At 4.38 mJ single-pulse energy output with pulse duration of 96.1 ns.
Utilizing the 90/10 knife-edge method [31–33], the obtained M2 curves of the output beam on the different directions are presented in Figure 11A and Figure 11B at the 100 kHz repetition rate for different output laser energy, respectively. As shown in Figure 11A, the measured M2 values, on the x and y directions, were expressed as 2.2 and 2.4 at a maximum output 1.08 mJ single-pulse energy with a pulse duration of 10.3 ns Moreover, the M2 values were measured to be 2.7 and 2.1 with the maximum output single pulse energy of 4.38 mJ for a pulse width of 96.1 ns in Figure 11B, respectively. The inter-burst interval was set as 100 ms to allow for the release of thermal loading. There was no emergence of serious beam distortion for recorded two-dimensional (2D) beam profiles with approximately smooth mode distribution.
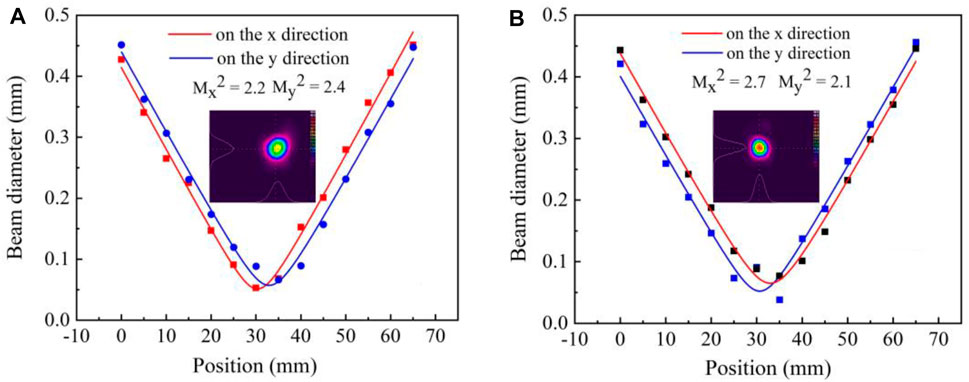
FIGURE 11. Output beam diameter versus beam position on different directions for the 100-kHz repetition rate. (A) At output 1.08 mJ single-pulse energy with a pulse width of 10.3 ns. (B) At output 4.38 mJ single- pulse energy with a pulse width of 96.1 ns.
5 Conclusion
In summary, a burst-mode MOPA laser system was characterized with excellent output characteristics in this study. Relevant characteristics for burst envelope distribution were simulated and discussed in detail under the action of multiple parameters (input pulse energy, repetition rate, and pump time τ), indicating the steady-state distribution approximately approaching 0.5 ms pump time τ. A double-pass, three-stage amplified burst envelope over 2 ms duration, at different pump time τ, was investigated in the experiment for the repetition rate from 10 to 100 kHz, corresponding to the input pulse energy of 8.6 and 116.51 nJ, respectively. Here, it could be illustrated that the COV variation tendency was consistent with that of the simulated ones. Maximum output pulse energy reached 10.1, 7.08, 5.92, and 4.38 mJ at the repetition rate of 10 kHz, 20 kHz, 50 kHz, and 100 kHz, respectively. In terms of the 100-kHz repetition rate, the output beam was endowed with uniform mode distribution with Mx2 and My2 of 2.2 and 2.4 at 1.08 mJ pulse energy and 2.7 and 2.1 for 4.38 mJ pulse energy output. The relevant spectral linewidth was less than 83.1 and 67.9 MHz, with respect to output pulse duration of 10.3 and 96.1 ns respectively. It was believed that such a burst-mode laser system could possess great potential for its application in high-speed field diagnosis based on the FRS technique.
Data Availability Statement
The original contributions presented in the study are included in the article/Supplementary Material; further inquiries can be directed to the corresponding author.
Author Contributions
XY: experimental guidance and writing. SZ: theoretical analysis, experimental investigation, and writing. JP: theoretical guidance and experimental guidance. ZC: experimental operation, writing, and data analysis. LG: experimental operation, data process, and writing. WL: experimental operation and data recording. All authors involved could make significant contributions to this manuscript.
Funding
This research was funded by the National Natural Science Foundation of China (Grant No. 62175053).
Conflict of Interest
The authors declare that the research was conducted in the absence of any commercial or financial relationships that could be construed as a potential conflict of interest.
Publisher’s Note
All claims expressed in this article are solely those of the authors and do not necessarily represent those of their affiliated organizations, or those of the publisher, the editors, and the reviewers. Any product that may be evaluated in this article, or claim that may be made by its manufacturer, is not guaranteed or endorsed by the publisher.
References
1. Krishna Y, Mahuthannan AM, Luo X, Lacoste DA, Magnotti G. High-speed Filtered Rayleigh Scattering Thermometry in Premixed Flames through Narrow Channels. Combustion and Flame (2021) 225:329–39. doi:10.1016/j.combustflame.2020.10.053
2. Fugger CA, Hsu PS, Jiang N, Yi T, Slipchenko MN, Felver JJ, et al. 10-kHz Simultaneous Dual-Plane Stereo-PIV and OH-PLIF Imaging. Appl Phys B (2020) 126:1–9. doi:10.1007/s00340-020-07522-4
3. Papageorge MJ, Arndt C, Fuest F, Meier W, Sutton JA. High-speed Mixture Fraction and Temperature Imaging of Pulsed, Turbulent Fuel Jets Auto-Igniting in High-Temperature, Vitiated Co-flows. Exp Fluids (2014) 55:1–20. doi:10.1007/s00348-014-1763-z
4. Ma Y, He Y, Tong Y, Yu X, Tittel FK. Quartz-tuning-fork Enhanced Photothermal Spectroscopy for Ultra-high Sensitive Trace Gas Detection. Opt Express (2018) 26:32103–10. doi:10.1364/OE.26.032103
5. Lang Z, Qiao S, Ma Y. Acoustic Microresonator Based In-Plane Quartz-Enhanced Photoacoustic Spectroscopy Sensor with a Line Interaction Mode. Opt Lett (2022) 47:1295–8. doi:10.1364/OL.452085
6. Liu X, Ma Y. Sensitive Carbon Monoxide Detection Based on Light-Induced Thermoelastic Spectroscopy with a Fiber-Coupled Multipass Cell [Invited]. Opt Lett (2022) 20:031201. doi:10.3788/col202220.031201
7. Ma Y, Yu X, Li X, Fan R, Yu J. Comparison on Performance of Passively Q-Switched Laser Properties of Continuous-Grown Composite GdVO_4/Nd:GdVO_4 and YVO_4/Nd:YVO_4crystals under Direct Pumping. Appl Opt (2011) 50:3854–9. doi:10.1364/AO.50.003854
8. Ma YF, Zhang JW, Li H, Yu X. High Stable Electro-Optical Cavity-Dumped Nd:YAG Laser. Laser Phys Lett (2012) 9:561–3. doi:10.7452/lapl.201210041
9. Ma Y, Yu X, Li X. Performance Improvement in a Directly 879 Nm Dual-End-π-Polarized-Pumped CW and Pulsed GdVO4/Nd:GdVO4 Laser. Appl Opt (2012) 51:600–3. doi:10.1364/AO.51.000600
10. Zha S, Chen Y, Li B, Lin Y, Liao W, Zou Y, et al. High-repetition-rate 1.5 Μm Passively Q-Switched Er:Yb:YAl3(BO3)4 Microchip Laser. China Opt Express (2021) 19:071402. doi:10.3788/COL202119.071402
11. Liu X, Tan C, Cheng Y, Wei J, Zhu M, Chen X, et al. 7 kHz Sub-nanosecond Microchip Laser Amplified by a Grazing Incidence Double Pass Slab Amplifier. China Opt Express (2021) 19:021403. doi:10.3788/COL202119.021403
12. Peng J, Cao Z, Yu X, Yang S, Yu Y, Ren H, et al. Analysis of Combustion Instability of Hydrogen Fueled Scramjet Combustor on High-Speed OH-PLIF Measurements and Dynamic Mode Decomposition. Int J Hydrogen Energ (2020) 45:13108–18. doi:10.1016/j.ijhydene.2020.02.216
13. Peng J, Cao Z, Yu X, Qi H, Sun R, Yu Y, et al. Oscillation Characterization of Volatile Combustion of Single Coal Particles with Multi-Species Optical Diagnostic Techniques. Fuel (2020) 282:118845. doi:10.1016/j.fuel.2020.118845
14. Peng J, Gao L, Yu X, Qin F, Liu B, Cao Z, et al. Combustion Oscillation Characteristics of a Supersonic Ethylene Jet Flame Using High-Speed Planar Laser-Induced Fluorescence and Dynamic Mode Decomposition. Energy (2022) 239:122330. doi:10.1016/j.energy.2021.122330
15. Miller JD, Jiang N, Slipchenko MN, Mance JG, Meyer TR, Roy S, et al. Spatiotemporal Analysis of Turbulent Jets Enabled by 100-kHz, 100-ms Burst-Mode Particle Image Velocimetry. Exp Fluids (2016) 57:1–17. doi:10.1007/s00348-016-2279-5
16. Smyser ME, Rahman KA, Slipchenko MN, Roy S, Meyer TR. Compact Burst-Mode Nd:YAG Laser for kHz-MHz Bandwidth Velocity and Species Measurements. Opt Lett (2018) 43:735–8. doi:10.1364/OL.43.000735
17. Wu PP, Miles RB. High-energy Pulse-Burst Laser System for Megahertz-Rate Flow Visualization. Opt Lett (2000) 25:1639–41. doi:10.1364/OL.25.001639
18. Krishna Y, Mahuthannan AM, Lacoste DA, Magnotti G. 50-kHz-rate Rayleigh and Filtered Rayleigh Scattering Thermometry Using a Pulse-Burst Laser. AIAA Scitech 2021 Forum (2021). doi:10.2514/6.2021-0724
19. Thurow B, Jiang N, Samimy M, Lempert W. Narrow-linewidth Megahertz-Rate Pulse-Burst Laser for High-Speed Flow Diagnostics. Appl Opt (2004) 43:5064–73. doi:10.1364/AO.43.005064
20. Zhao M, Zhang Z, Feng X, Zong M, Liu J, Xu X, et al. High Repetition Rate Passively Q-Switched Laser on Nd:SRA at 1049 Nm with MXene Ti3C2Tx. China Opt Express (2020) 18:041401. doi:10.3788/col202018.041401
21. Tang T, Zhang F, Wang M, Wang Z, Xu X. Two-dimensional Tellurene Nanosheets as Saturable Absorber of Passively Q-Switched Nd:YAG Solid-State Laser. China Opt Express (2020) 18:041403. doi:10.3788/col202018.041403
22. Slipchenko MN, Miller JD, Roy S, Meyer TR, Mance JG, Gord JR. 100 kHz, 100 Ms, 400 J Burst-Mode Laser with Dual-Wavelength Diode-Pumped Amplifiers. Opt Lett (2014) 39:4735–8. doi:10.1364/OL.39.004735
23. Wu W, Li X, Yan R, Zhou Y, Ma Y, Fan R, et al. 100 kHz, 31 Ns, 189 J Cavity-Dumped Burst-Mode Nd:YAG MOPA Laser. Opt Express (2017) 25:26875–84. doi:10.1364/OE.25.026875
24. Smyser ME, Slipchenko MN, Meyer TR, Caswell AW, Roy S. Burst-mode Laser Architecture for the Generation of High-Peak-Power MHz-Rate Femtosecond Pulses. OSA Continuum (2019) 2:3490–8. doi:10.1364/OSAC.2.003490
25. Yan R, Li X, Zhou Y, Wu W, Liu Z, Wen X, et al. 2.5 MW, 2.0 Ns MOPA Burst Mode Laser at 86 kHz. Optik (2019) 185:418–22. doi:10.1016/j.ijleo.2018.12.119
26. Yan R, Li X, Zhang Y, Liu Z, Wen X, Chen D, et al. High-repetition-rate, High-Peak-Power Burst Mode Laser with YAG/Nd:YAG/Cr4+:YAG Composite crystal. Optik (2018) 175:263–7. doi:10.1016/j.ijleo.2018.09.016
27. Feng D, Goldberg BM, Naphade M, Shneider MN, Miles RB. A Model Study of Filtered Rayleigh Scattering Sensitivity to Pressure and Temperature. AIAA Scitech (2018). doi:10.2514/6.2018-2042
28. Mance JG, Slipchenko MN, Roy S. Regenerative Amplification and Bifurcations in a Burst-Mode Nd:YAG Laser. Opt Lett (2015) 40:5093–6. doi:10.1364/OL.40.005093
29. Wu P, Lempert WR, Miles RB. Megahertz Pulse-Burst Laser and Visualization of Shock-Wave/boundary-Layer Interaction. AIAA J (2000) 38:672–9. doi:10.2514/3.14459
30. Frantz LM, Nodvik JS. Theory of Pulse Propagation in a Laser Amplifier. J Appl Phys (1963) 34:2346–9. doi:10.1063/1.1702744
31. Zhang S, Ma Y, Liu X, Ding S, Yu X, Zhang Q. Continuous Wave and Rhenium Disulfide Passively Q-Switched Nd:GdLaNbO4 Laser under Direct Pumping. Opt Commun (2020) 473:125977. doi:10.1016/j.optcom.2020.125977
32. Ma Y, Zhang S, Peng Z, Ding S, Sun H, Peng F, et al. Investigation on 1065 Nm Laser Performance with Nd:GdLaNbO4 Mixed crystal and Molybdenum Disulfide. Opt Laser Technol (2019) 120:105715. doi:10.1016/j.optlastec.2019.105715
Keywords: burst-mode, narrow-linewidth, double-pass amplification, MOPA, COV
Citation: Yu X, Zhang S, Peng J, Cao Z, Gao L and Liu W (2022) 100 kHz Narrow-Linewidth Burst-Mode MOPA Laser System With Uniform Envelope. Front. Phys. 10:914970. doi: 10.3389/fphy.2022.914970
Received: 07 April 2022; Accepted: 22 April 2022;
Published: 25 May 2022.
Edited by:
Qun Hao, Beijing Institute of Technology, ChinaReviewed by:
Xinzhong LI, Henan University of Science and Technology, ChinaLifa Hu, Jiangnan University, China
Fei Chen, Changchun Institute of Optics, Fine Mechanics and Physics (CAS), China
Copyright © 2022 Yu, Zhang, Peng, Cao, Gao and Liu. This is an open-access article distributed under the terms of the Creative Commons Attribution License (CC BY). The use, distribution or reproduction in other forums is permitted, provided the original author(s) and the copyright owner(s) are credited and that the original publication in this journal is cited, in accordance with accepted academic practice. No use, distribution or reproduction is permitted which does not comply with these terms.
*Correspondence: Jiangbo Peng, cGVuZ2ppYW5nYm9AaGl0LmVkdS5jbg==
 Xin Yu
 Shanchun Zhang1,2
 Jiangbo Peng