
95% of researchers rate our articles as excellent or good
Learn more about the work of our research integrity team to safeguard the quality of each article we publish.
Find out more
ORIGINAL RESEARCH article
Front. Phys. , 04 July 2022
Sec. Optics and Photonics
Volume 10 - 2022 | https://doi.org/10.3389/fphy.2022.914135
This article is part of the Research Topic Advanced Nonlinear Optical Materials and Devices View all 5 articles
 Md Soif Ahmed1
 Chinmoy Biswas1
 Dipanjan Banerjee2
 Prabhakar Chetti3
 Jye-Shane Yang4
 Venugopal Rao Soma2*
 Sai Santosh Kumar Raavi1*
We report herein results on the third-order non-linear optical (NLO) properties of four structurally unconstrained green fluorescence protein (GFP) chromophores, namely, 1, 2, 3, and 4. Using experimental techniques and theoretical calculations such as UV–visible spectroscopy, density functional theory (DFT), time-dependent density functional theory (TDDFT), and Z-scan techniques, we have investigated the linear absorption, ultrafast non-resonant third-order optical non-linearities, and the onset of optical-limiting thresholds of these benzylidenedimethylimidazolinone (BDI) dyes. The Z-scan measurements were performed at a wavelength of 800 nm with ∼70 femtosecond (fs) pulses. We have witnessed a strong reverse saturable absorption (fitted to three-photon absorption) for all of the molecules with fs pulse excitation. The valley–peak curves obtained from the closed-aperture Z-scan technique revealed the positive non-linear refractive index (self-focusing) nature of these molecules. We have evaluated the various third-order NLO coefficients (second hyperpolarizability, γ ∼10–33 esu), which were found to be larger than those of similar molecules reported in the recent literature.
Fluorescent proteins (FPs) have been omnipresent in biomedical research for the past decades because of their genetically encoded nature which enables researchers to covalently and uniquely label one specific protein with one specific color (1–3). In particular, succeeding the discovery of wild-type green fluorescent protein (WT-GFP) (4), WT-GFP and the subsequent GFP variants are readily cloned in other organisms. FPs have been recognized as an excellent two-photon absorber, which has been widely used in two-photon excitation fluorescence microscopy for their increased specimen penetration, reduced photo-toxicity, and negligible background fluorescence (5, 6). Even multi-photon fluorescence from these protein markers has been applied in the fields of cellular non-linear optical spectroscopy and microscopy. Thus, the non-linear optical (NLO) properties of the FPs have emerged to be very exciting in the photonics research world. The field of NLO deals with the interaction of applied intense laser light with various materials to produce new electromagnetic fields changed in phase, frequency, or other physical properties (7–15). This field has received ample attention not only because of the several applications in dynamic holography, optical data storage, telecommunications, frequency mixing, etc. but also because of the fundamental sciences associated with polarization, charge transfer, conjugation, diradical character, etc. (16–19).
Besides their use in fluorescence imaging, FPs have been used for second-harmonic generation imaging. Second-harmonic imaging microscopy (SHIM) (20, 21) is a new NLO imaging technique where two photons at a fundamental frequency are converted into a single photon at the harmonic frequency. SHIM is correlative to the two-photon excitation fluorescence imaging method that is being used in microscopy to enhance the resolution (22). Recently, a few research articles have reported the second-order non-linear optical properties, particularly second-harmonic generation, and first hyperpolarizability values of green fluorescent proteins (1, 23, 24). However, there is a paucity of reports on third-order NLO responses of such kinds of GFP chromophores, although the GFP chromophores have been gradually characterized and become the subject of interest in cell imaging (25). In this article, we discuss the second hyperpolarizability values of four structurally unconstrained GFP chromophore analogs (uGFPc, Figure 1A) (26) associated with their third-order NLO properties. Tsai et al. (26) have reported that uGFPc have high fluorescence quantum yields, unlike the nearly non-fluorescent p-hydrdoxybenzylidenedimethylimidazolinone (p-HBDI) dye (a naturally occurring GFP chromophore). These uGFPc also differ from the structurally constrained analogs of p-HBDI, in which there exists covalent or non-covalent bridging of the two rings to instantaneously prevent the
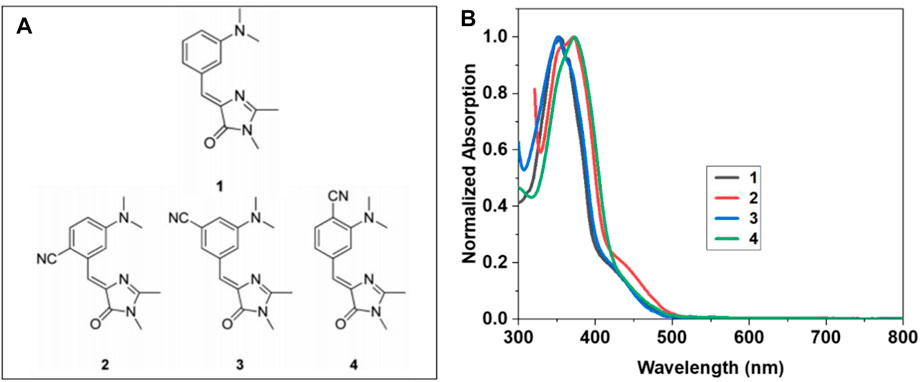
FIGURE 1. (A) Structures of the four molecules uGFPc 1–4 investigated in the present study. (B) UV-visible absorption spectra of uGFPc 1–4 in DMF.
The structures of the uGFPc studied here are shown in Figure 1A. The details of the molecular design, synthesis process, and electronic spectroscopic studies of these molecules are reported elsewhere (26). The design concept relies on the fact that the τ-torsion [i.e., the Z* → 1p* reaction in the Z → E photoisomerization coordinate of the one-bond-flip mechanism (31)] is the principal non-radiative decay pathway for 1. Destabilizing the reactive intermediate can raise the reaction barrier and slow down the process (32). By adding an electron-withdrawing group to the places in the resonance structures that bear a positive charge, it was claimed that the 1p* state may be destabilized to further enhance the τ-torsion barrier in favor of fluorescence emission. In this context, the strong electron-withdrawing and linear-shaped CN groups were chosen, and for the synthetic feasibility, the CN substituent was designed to locate on the aniline moiety rather than on the exocyclic carbon. We have used the spectroscopy-grade anhydrous DMF solvent to prepare its dilute solution samples of concentration ∼0.05 mM. UV–visible absorption spectra of the solutions were measured using a commercial UV–Vis spectrometer.
The conventional Z-scan setup (33–35) was used to execute the fs Z-scan studies. A Ti:sapphire laser amplifier (LIBRA, Coherent, Inc.) seeded by an oscillator was used as a light source. A part of the laser output from the amplifier having a central wavelength of 800 nm, ∼70 fs pulse duration, and 1 kHz repetition rate was used for the measurements. The laser beam was focused over the sample by using a plano-convex lens of focal length ∼ 15 cm. At the focus, the estimated beam waist was ∼32 µM, and the estimated peak intensity was ∼300 GW/cm2. The corresponding Rayleigh range (Z0) was calculated and found to be ∼4 mm. The solution samples were placed in a quartz cuvette with a path length of ∼1 mm, and the cuvette was placed on a motorized stage (for scanning the sample) using a sample holder. The stage was translated along the Z direction, and the sample was scanned to the positive and negative sides of the Z = 0 position. The transmitted signal through the samples was collected by a silicon photodiode (PD-Thorlabs) which was connected to the lock-in amplifier. The motorized stage was functioned using a motion controller (Newport-ESP 300), and the lock-in amplifier was integrated with this motion controller via the LabVIEW interface. One can measure the multi-photon absorption of the samples by scanning the samples in the focal plane of the lens without placing an aperture or by placing an open aperture at the photodiode (OA). The aperture at the far-field position before the photodiode was closed to make the transmitted signal sensitive to the central part of the beam profile for the closed-aperture (CA) Z-scan study. Important parameters such as the intensity-dependent non-linear refraction (n2) and the real part of third-order non-linear susceptibility [χ (3)] are determined by the CA Z-scan studies. The input peak intensity was selected such that the impact of pure solvent was negligible and it was confirmed from the Z-scan measurements of pure solvent alone, which exhibited negligible NLO transmittance. During the measurements of all the samples, a linear transmittance of 90–96% at 800 nm was noted. An estimated error of ±5% due to the backlash error of the stage, estimation of intensity as a function of distance Z, and input laser energy fluctuations is expected in the NLO coefficients obtained from these measurements.
All the reported molecules were optimized at the B3LYP/6-31G (d, p) level of theory. The frequencies of the optimized geometries were evaluated at the same level, and it was found that the structures were minima on the potential energy surface. Each molecule existed in four stable conformers named as E1, E2, Z1, and Z2 (two in the E isomer and two in the Z isomer) on the potential energy surface. Out of the four conformers, the Z1 isomer was the most stable one for all the molecules, and the detailed molecular structures along with its relative energies are summarized in Table 1. Further calculations such as electronic excitations and NLO properties are reported for the most stable structure Z1. All the calculations were carried out using G 16 W software (36).
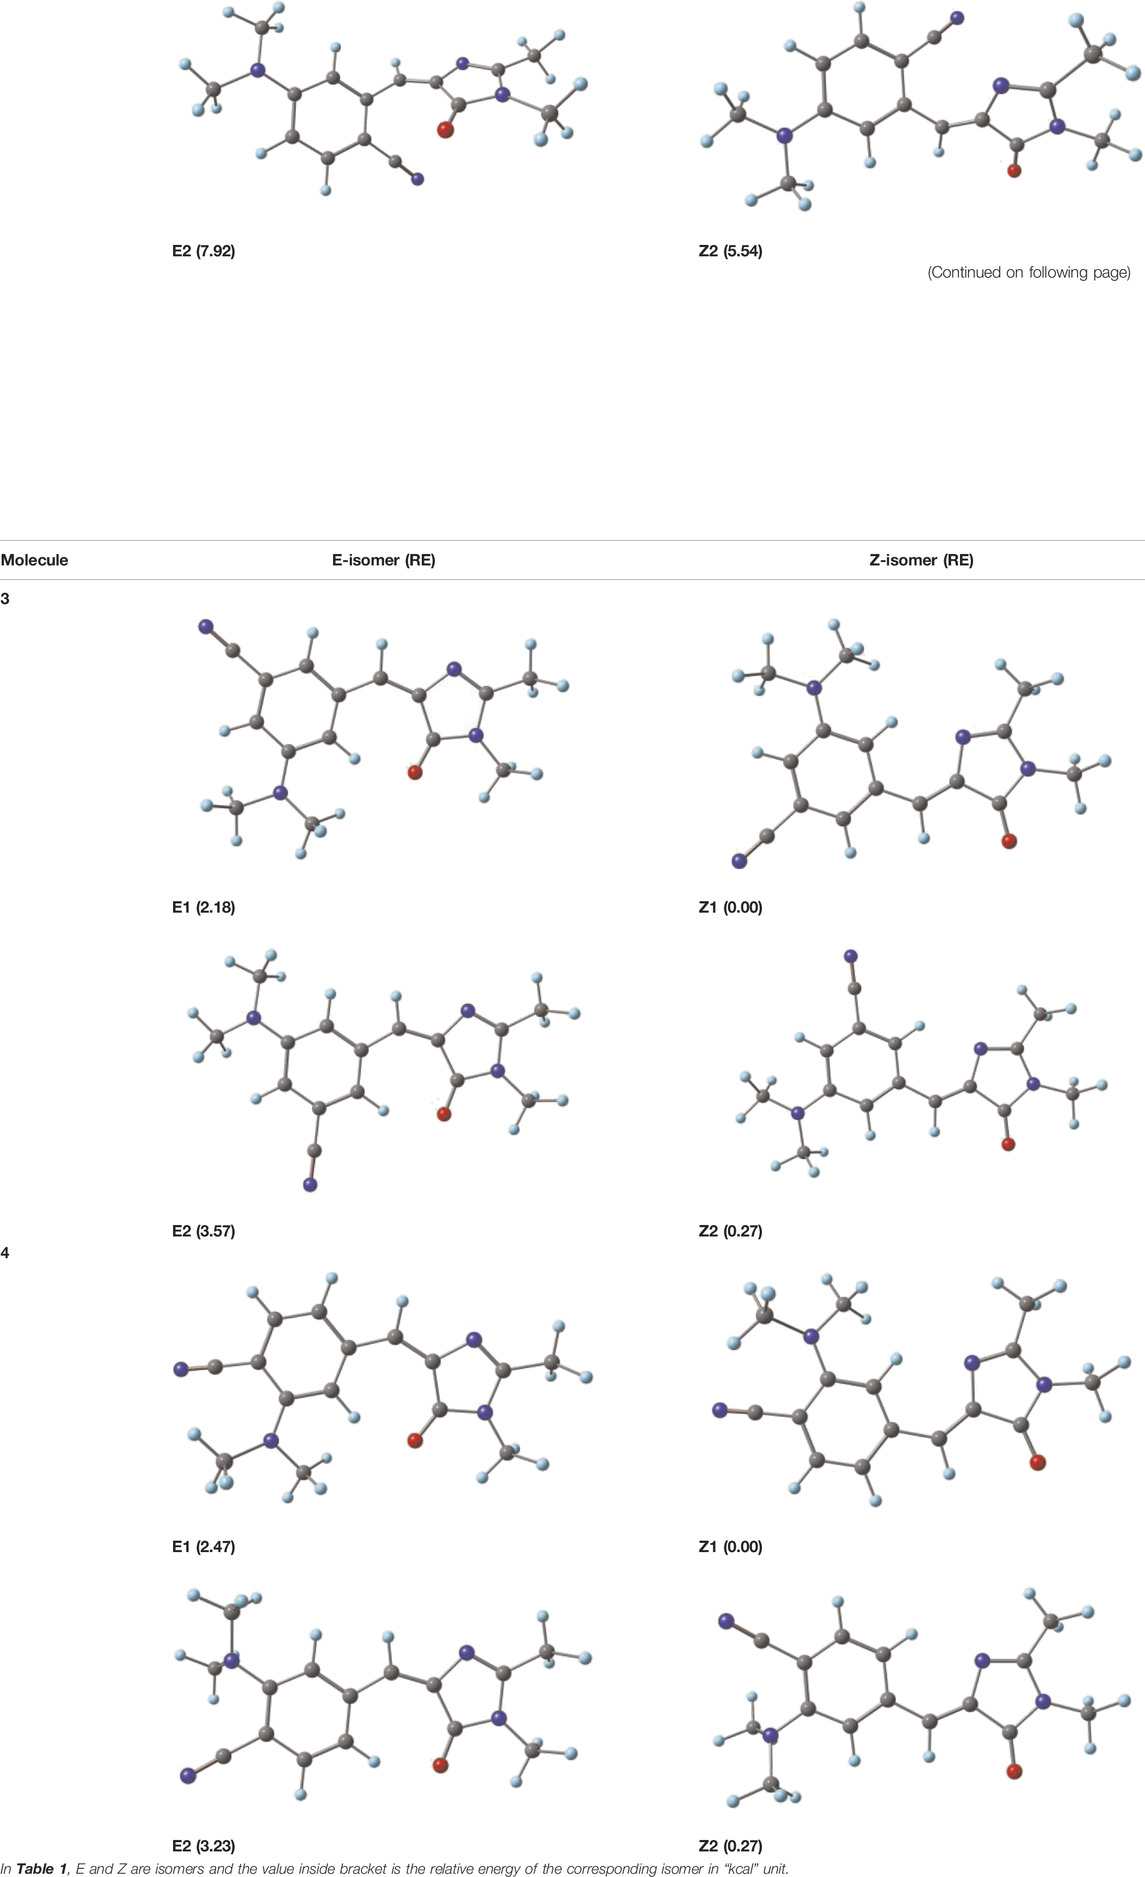
TABLE 1. Optimized geometry and relative energies (REs, kcal) of all the possible isomers at B3LYP/6-31G (d, p).
Figure 1B presents the absorption spectra of the molecules 1, 2, 3, and 4, in solution of DMF, depicting peaks near 354 nm, 367 nm, 355 nm, and 370 nm, respectively. The absorption profiles for all the samples were found to be similar, and each consisted of a BDI-based locally excited (LE)
To gain an understanding of the observed absorption energies, TDDFT calculations were performed at TD-CAMB3LYP/6-311+G (d, p) with the inclusion of solvent DMF. The TDDFT-derived transitions along with contributions (in %Ci) are summarized in Table 2. It is clear from Table 2 that all the molecules’ parameters obtained are in good agreement with the experimental observations. The major transitions are from HOMO to LUMO in its first excitation (S1), whereas the second (S2) and third (S3) excitations are from HOMO-1 to LUMO and from HOMO-3 to LUMO, respectively. The electron density is mainly localized on the benzene part in the HOMO and on the acceptor imidazolinone part in the LUMO. The stabilization in HOMO and LUMO levels was observed from the unsubstituted molecule 1 to substituted molecules 2, 3, and 4 (Figure 2). Molecule 4 (ortho-substituted) has deeper HOMO and LUMO levels with a smaller HOMO–LUMO gap (HLG) of 3.24 eV among the four molecules.
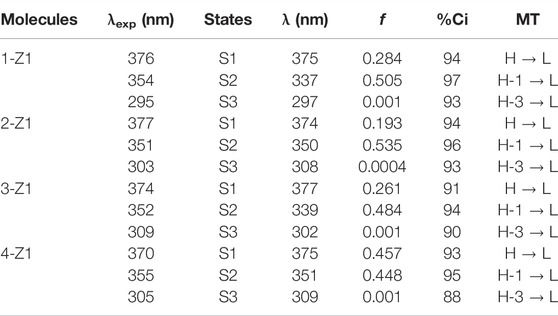
TABLE 2. Absorption energies (λ in nm), oscillator strength (f), % contribution (%Ci), and major transitions (MTs) obtained at the TD-CAMB3LYP/6-311+G (d, p) level.
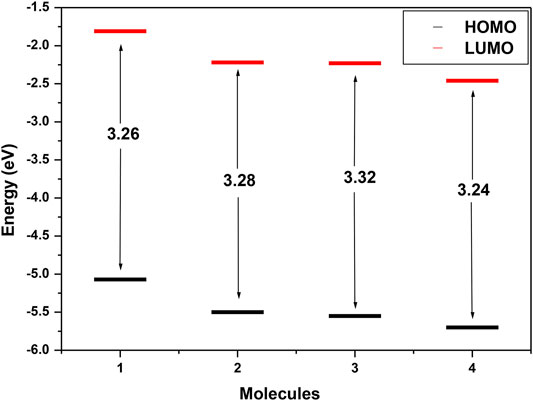
FIGURE 2. DFT-derived HOMO, LUMO, and HLG energies of molecules 1–4.
Symmetric transmission plots, shown in Figure 3, are the OA Z-scan curves measured at the wavelength of 800 nm. Since the intensity of the input beam increased toward Z = 0 position, the transmission through the sample declined and finally saturated with higher input intensities. The data found for all the samples at different input intensities stipulate a reverse saturable absorption (RSA) behavior. Generally, in any molecule, if the excited-state absorption is larger than the ground-state absorption, it allows them to exhibit prominent RSA response. A photon is absorbed from a singlet level (S1) or a triplet level (T1) to a higher level in this condition. A reverse saturation phenomenon occurs when the cross section of either the S1–S2 or T1–T2 transition is bigger than that of the ground state (37). RSA can result in strong absorption by the non-linear absorber at high input intensities/energy densities of the incident laser (38) and low absorption at low input intensities/energy densities of the incident laser. However, transparency at low input energy but a very strong absorption at high input energy can be achieved with multi-photon absorption (MPA) in which “n” photons are absorbed simultaneously. In the present case, the incident, laser intensities were optimized to avoid supercontinuum generation.
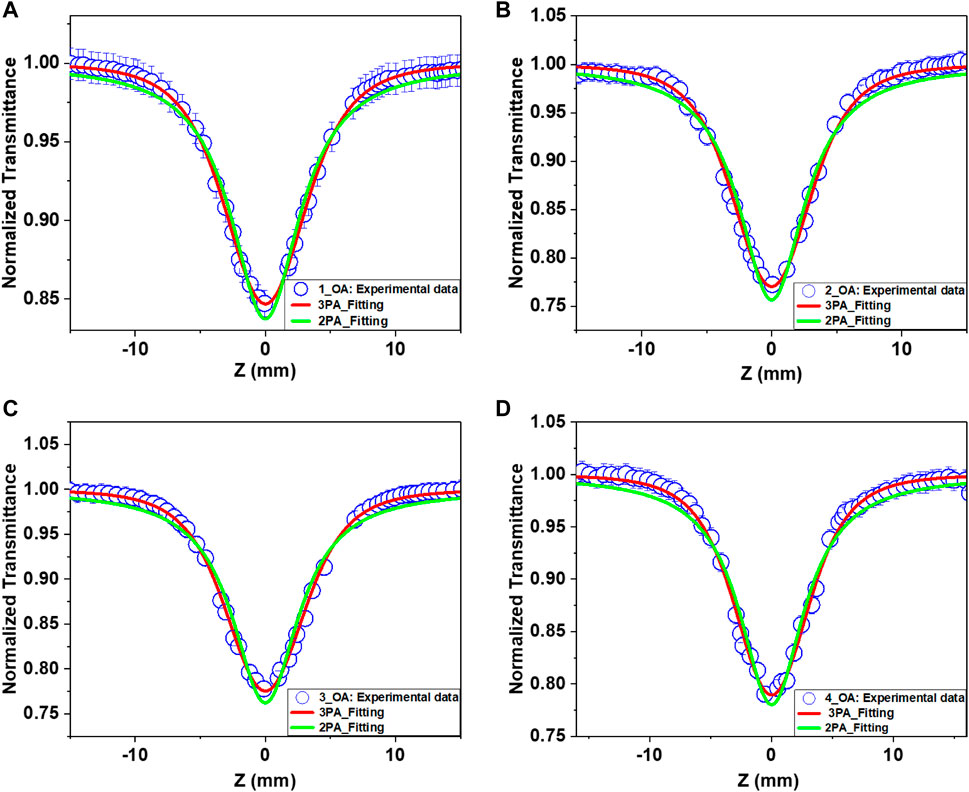
FIGURE 3. Open-aperture (OA) Z-scan curves for the samples (A) 1, (B) 2, (C) 3, and (D) 4 obtained with 800 nm, 70 fs pulses. Open symbols represent the experimental data points, while solid lines are theoretical fits. The solid red line is for the fit with 3PA, and the solid green line is for 2PA.
It is not possible to trigger a direct electronic transition from the ground state to the excited state via one-photon absorption under our experimental conditions because the energy of the excitation light (1.55 eV) is shorter than the energy gap (Eg) of these uGFPc (Figure 2). More specifically, we have seen a negligible one-photon absorption at the excitation wavelength of 800 nm for all the molecules. Thus, the only possibility for electrons to reach the excited state is via MPA. Due to the large peak intensities at the focus with fs laser pulses, either two-photon absorption (2PA) or three-photon absorption (3PA) can be expected as the possible non-linear absorption mechanism. The condition for the 3PA is described as 2 hν <Eg <3 hν (39). The photon energy 3 hν corresponding to 800 nm (4.65 eV) is sufficient for population transition by the ground-state absorption. Therefore, it is an indication that the optical non-linearity observed at non-resonant excitation could be attributed to the generation of free or bound carriers via most likely the 3PA process.
Assuming the Gaussian beam profile, the general equation for normalized energy transmittance given by Sutherland et al. (33, 34, 40) using the open-aperture Z-scan theory for multi-photon absorption is described as
where
We employed the following analytical equations for fitting the 2PA and 3PA to OA Z-scan data by choosing n = 2 and n = 3:
Here,
Next, we employed the closed-aperture (CA) Z-scan measurements on the uGFPc. To extract the non-linear parameters, the CA Z-scan data were fitted by the following acknowledged formula (46):
where
where
where S is the linear transmittance of the aperture:
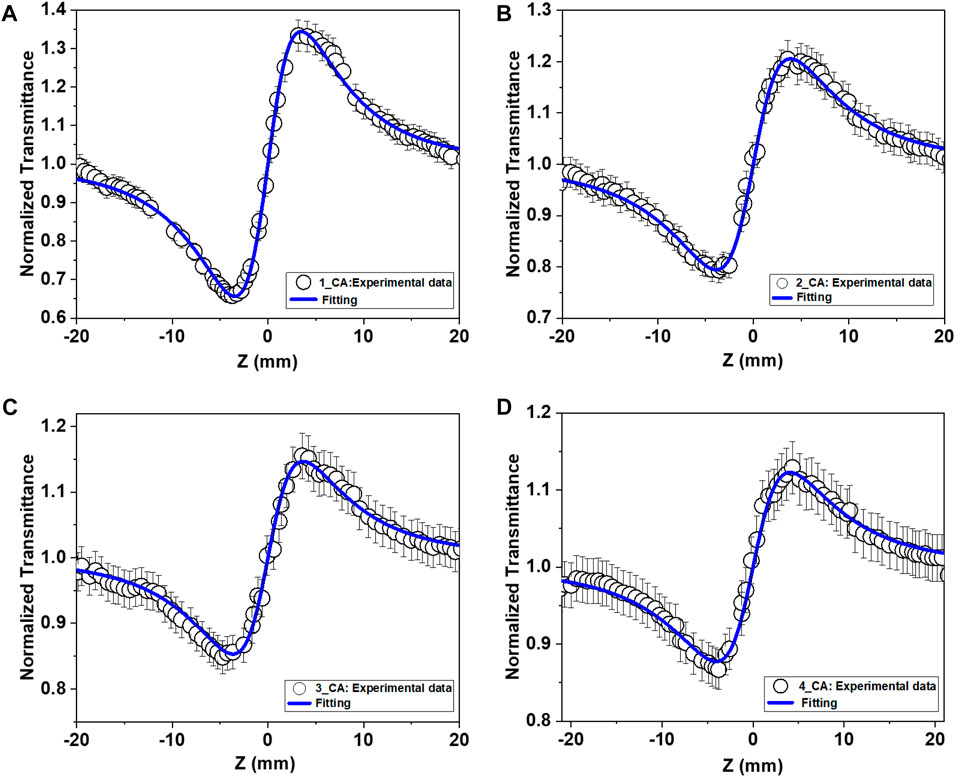
FIGURE 4. Closed-aperture (CA) Z-scan curves for the samples (A) 1, (B) 2, (C) 3, and (D) 4 obtained with 800 nm, 70 fs pulses. Open symbols are the experimental data points, while solid lines are theoretical fits.
The third-order non-linear susceptibility is a complex quantity (14):
Here, c is the speed of the light and
in which
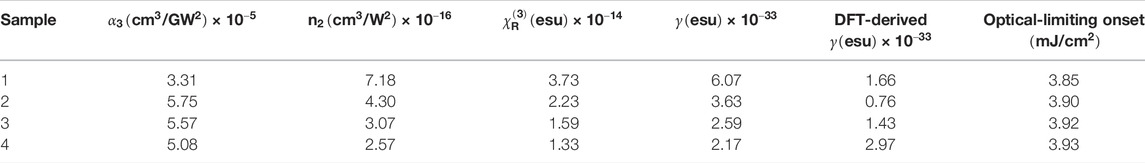
TABLE 3. NLO parameters of the investigated molecules obtained from OA, CA Z-scan, and DFT studies.
The average second hyperpolarizability values γ are obtained for all the molecules using various DFT functionals (TD-CAMB3LYP) based on B3LYP/6-31G (d, p) optimized geometries. The γ values were calculated using two-state models (52), and the γ was evaluated for each molecule using the transition dipole moment and the excitation energy obtained in DMF by TD-CAMB3LYP. The calculated results are in good agreement with the experimental findings (Table 3). All the molecules have demonstrated magnitude of
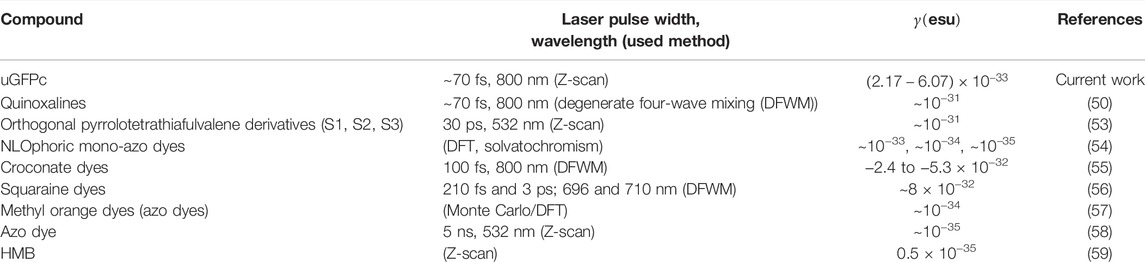
TABLE 4. Comparison of the values of obtained second hyperpolarizability with those in the published works.
An excellent optical limiter behaves as a transparent medium at low input intensities and an opaque medium for high input fluence. The transmittance of the medium decreases with the increasing input laser intensity or fluence in the optical-limiting medium. The intensity-dependent transmission is utilized in this way to keep the transmitted light intensity below a certain level. Optical limiters are used to protect the human eyes, light-sensitive optical elements, and optical sensors from damages induced by intense laser pulse fluence (60). The normalized transmittance of the molecules in DMF solution as a function of input laser fluence is illustrated in Figure 5. The input laser fluence was calculated from the OA Z-scan data since for a Gaussian beam, each Z location of the sample corresponds to an input beam fluence following the relation (40, 60):
where
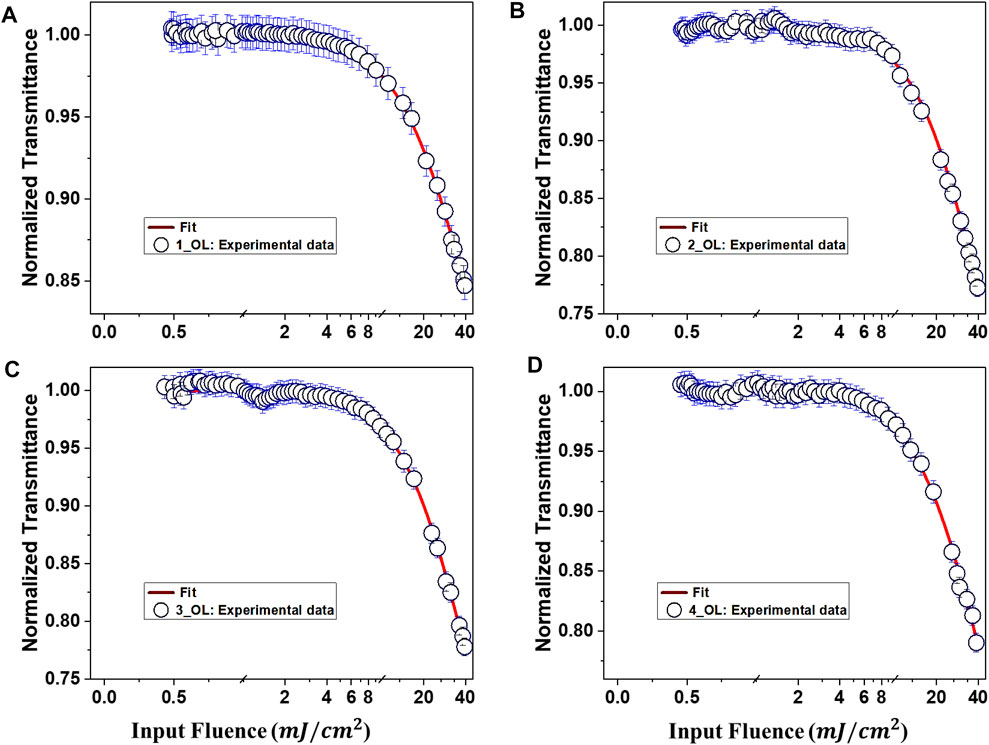
FIGURE 5. Optical-limiting behavior of uGFPc (A) 1, (B) 2, (C) 3, and (D) 4 and in DMF solution as a function of input laser fluence with fs pulse excitation. Theoretical fits to the experimental data (open symbols) are indicated by solid lines.
From Figure 5, it is noticed that the deviation from linear transmittance for 1, 2, 3, and 4 is happening at an input fluence of

TABLE 5. Optical-limiting onset threshold of different molecules studied.
The non-resonant NLO properties of the four uGFPc 1–4 have been investigated by the femtosecond Z-scan technique. We performed the open-aperture and closed-aperture Z-scan studies with 800 nm, 100 fs pulses to characterize the ultrafast third-order optical non-linearity in detail. From the HOMO–LUMO gap (DFT calculations) and OA Z-scan curves of the molecules, we conclude that these molecules exhibit three-photon absorption and reverse saturable absorption behavior. These features indicated the application of these molecules in three-photon microscopy in the future. In addition, the optical-limiting properties, third-order non-linear absorption coefficients, and non-linear refractive indices were estimated. We evaluated third-order non-linear susceptibilities and second hyperpolarizability and verified these values with theoretical calculations. We conclude that, with a non-centrosymmetric structure, visible-light absorption, and larger
The original contributions presented in the study are included in the article/Supplementary Material, and further inquiries can be directed to the corresponding authors.
MA and CB measured and analyzed steady-state photophysics and NLO measurements. DB supported with femtosecond laser setup and data collection. PC performed DFT calculations. J-SY provided the molecules for study. VS provided the laser support and was involved in data analysis. SR supervised the entire project in terms of data curation and analysis and project funding. All authors contributed equally in writing and reviewing the manuscript.
MA and SR acknowledge the financial support of BRICS/PilotCall2/IEEE-OSC/2018 (G) and CRG/2019/003197, respectively, and J-SY thanks the financial support of MOST of Taiwan (MOST 110-2113-M-002-011-MY3).
The authors declare that the research was conducted in the absence of any commercial or financial relationships that could be construed as a potential conflict of interest.
All claims expressed in this article are solely those of the authors and do not necessarily represent those of their affiliated organizations, or those of the publisher, the editors, and the reviewers. Any product that may be evaluated in this article, or claim that may be made by its manufacturer, is not guaranteed or endorsed by the publisher.
1. De Meulenaere E, de Coene Y, Russier-Antoine I, Vanpraet L, Van den Haute C, Thevissen K, et al. Fluorescence-free First Hyperpolarizability Values of Fluorescent Proteins and Channel Rhodopsins. J Photochem Photobiol A: Chem (2020) 400:112658.doi:10.1016/j.jphotochem.2020.112658
2. Dedecker P, De Schryver FC, Hofkens J. Fluorescent Proteins: Shine on, You Crazy diamond. J Am Chem Soc (2013) 135(7):2387–402. doi:10.1021/ja309768d
3. Shaner NC, Steinbach PA, Tsien RY. A Guide to Choosing Fluorescent Proteins. Nat Methods (2005) 2(12):905–9. doi:10.1038/nmeth819
4. Shimomura O, Johnson FH, Saiga Y. Extraction, Purification and Properties of Aequorin, a Bioluminescent Protein from the Luminous Hydromedusan, Aequorea. J Cell Comp Physiol (1962) 59(3):223–39. doi:10.1002/jcp.1030590302
5. Potter SM, Wang C-M, Garrity PA, Fraser SE. Intravital Imaging of green Fluorescent Protein Using Two-Photon Laser-Scanning Microscopy. Gene (1996) 173(1):25–31. doi:10.1016/0378-1119(95)00681-8
6. Volkmer A, Subramaniam V, Birch DJ, Jovin TM. One-and Two-Photon Excited Fluorescence Lifetimes and Anisotropy Decays of green Fluorescent Proteins. Biophysical J (2000) 78(3):1589–98. doi:10.1016/s0006-3495(00)76711-7
7. Prasad PN, Williams DJ. Introduction to Nonlinear Optical Effects in Molecules and Polymers. New York: Wiley (1991).
8. Williams DJ. Organic Polymeric and Non‐polymeric Materials with Large Optical Nonlinearities. Angew Chem Int Edition English (1984) 23(9):690–703. doi:10.1002/anie.198406901
9. Zyss J, Ledoux I. Nonlinear Optics in Multipolar media: Theory and Experiments. Chem Rev (1994) 94(1):77–105. doi:10.1021/cr00025a003
10. Karna SP, Yeates AT. Nonlinear Optical Materials: Theory and Modeling. Washington, DC: ACS Publications (1996).
11. Zyss J. Molecular Nonlinear Optics: Materials, Physics, and Devices. Massachusetts(United States): Academic Press (2013).
13. Verbiest T, Houbrechts S, Kauranen M, Clays K, Persoons A. Second-order Nonlinear Optical Materials: Recent Advances in Chromophore Design. J Mater Chem (1997) 7(11):2175–89. doi:10.1039/a703434b
15. Bredas J-L, Adant C, Tackx P, Persoons A, Pierce B. Third-order Nonlinear Optical Response in Organic Materials: Theoretical and Experimental Aspects. Chem Rev (1994) 94(1):243–78. doi:10.1021/cr00025a008
16. Nakano M, Kishi R, Ohta S, Takebe A, Takahashi H, Furukawa S, et al. Origin of the Enhancement of the Second Hyperpolarizability of Singlet Diradical Systems with Intermediate Diradical Character. J Chem Phys (2006) 125(7):074113. doi:10.1063/1.2213974
17. Nakano M, Kubo T, Kamada K, Ohta K, Kishi R, Ohta S, et al. Second Hyperpolarizabilities of Polycyclic Aromatic Hydrocarbons Involving Phenalenyl Radical Units. Chem Phys Lett (2006) 418(1-3):142–7. doi:10.1016/j.cplett.2005.10.109
18. Ohta S, Nakano M, Kubo T, Kamada K, Ohta K, Kishi R, et al. Second Hyperpolarizability of Phenalenyl Radical System Involving Acetylene π-conjugated Bridge. Chem Phys Lett (2006) 420(4-6):432–7. doi:10.1016/j.cplett.2006.01.022
19. Srinivas K, Prabhakar C, Devi CL, Yesudas K, Bhanuprakash K, Rao VJ. Enhanced Diradical Nature in Oxyallyl Derivatives Leads to Near Infra Red Absorption: A Comparative Study of the Squaraine and Croconate Dyes Using Computational Techniques. The J Phys Chem A (2007) 111(17):3378–86. doi:10.1021/jp067410f
20. De Meulenaere E, Asselberghs I, De Wergifosse M, Botek E, Spaepen S, Champagne B, et al. Second-order Nonlinear Optical Properties of Fluorescent Proteins for Second-Harmonic Imaging. J Mater Chem (2009) 19(40):7514–9. doi:10.1039/b907789h
21. De Meulenaere E, Nguyen Bich N, de Wergifosse M, Van Hecke K, Van Meervelt L, Vanderleyden J, et al. Improving the Second-Order Nonlinear Optical Response of Fluorescent Proteins: the Symmetry Argument. J Am Chem Soc (2013) 135(10):4061–9. doi:10.1021/ja400098b
22. Reeve JE, Collins HA, Mey KD, Kohl MM, Thorley KJ, Paulsen O, et al. Amphiphilic Porphyrins for Second Harmonic Generation Imaging. J Am Chem Soc (2009) 131(8):2758–9. doi:10.1021/ja8061369
23. De Wergifosse M, Botek E, De Meulenaere E, Clays K, Champagne B. ONIOM Investigation of the Second-Order Nonlinear Optical Responses of Fluorescent Proteins. The J Phys Chem B (2018) 122(19):4993–5005. doi:10.1021/acs.jpcb.8b01430
24. Asselberghs I, Flors C, Ferrighi L, Botek E, Champagne B, Mizuno H, et al. Second-harmonic Generation in GFP-like Proteins. J Am Chem Soc (2008) 130(46):15713–9. doi:10.1021/ja805171q
25. Tsai M-S, Lee C-H, Hsiao J-C, Sun S-S, Yang J-S. Solvatochromic Fluorescence of a GFP Chromophore-Containing Organogelator in Solutions and Organogels. J Org Chem (2021) 87:1723–31. doi:10.1021/acs.joc.1c01911
26. Tsai M-S, Ou C-L, Tsai C-J, Huang Y-C, Cheng Y-C, Sun S-S, et al. Fluorescence Enhancement of Unconstrained GFP Chromophore Analogues Based on the Push–Pull Substituent Effect. J Org Chem (2017) 82(15):8031–9. doi:10.1021/acs.joc.7b01260
27. Wu L, Burgess K. Syntheses of Highly Fluorescent GFP-Chromophore Analogues. J Am Chem Soc (2008) 130(12):4089–96. doi:10.1021/ja710388h
28. Chuang W-T, Hsieh C-C, Lai C-H, Lai C-H, Shih C-W, Chen K-Y, et al. Excited-state Intramolecular Proton Transfer Molecules Bearing O-Hydroxy Analogues of green Fluorescent Protein Chromophore. J Org Chem (2011) 76(20):8189–202. doi:10.1021/jo2012384
29. Hsu Y-H, Chen Y-A, Tseng H-W, Zhang Z, Shen J-Y, Chuang W-T, et al. Locked Ortho-And Para-Core Chromophores of green Fluorescent Protein; Dramatic Emission Enhancement via Structural Constraint. J Am Chem Soc (2014) 136(33):11805–12. doi:10.1021/ja5062856
30. Huang G-J, Ho J-H, Prabhakar C, Liu Y-H, Peng S-M, Yang J-S. Site-selective Hydrogen-Bonding-Induced Fluorescence Quenching of Highly Solvatofluorochromic GFP-like Chromophores. Org Lett (2012) 14(19):5034–7. doi:10.1021/ol302237k
31. Dugave C. cis-trans Isomerization in Biochemistry. New Jersey(United States): John Wiley & Sons (2006).
32. Hammond GS. A Correlation of Reaction Rates. J Am Chem Soc (1955) 77(2):334–8. doi:10.1021/ja01607a027
33. Sheik-Bahae M, Said AA, Wei T-H, Hagan DJ, Van Stryland EW. Sensitive Measurement of Optical Nonlinearities Using a Single Beam. IEEE J Quan Electron (1990) 26(4):760–9. doi:10.1109/3.53394
34. Kumar RSS, Rao SV, Giribabu L, Rao DN. Femtosecond and Nanosecond Nonlinear Optical Properties of Alkyl Phthalocyanines Studied Using Z-Scan Technique. Chem Phys Lett (2007) 447(4-6):274–8. doi:10.1016/j.cplett.2007.09.028
35. Biswas C, Katturi NK, Duvva N, Giribabu L, Soma VR, Raavi SSK. Multistep Electron Injection Dynamics and Optical Nonlinearity Investigations of π-Extended Thioalkyl-Substituted Tetrathiafulvalene Sensitizers. The J Phys Chem C (2020) 124(44):24039–51. doi:10.1021/acs.jpcc.0c06010
36.Gaussian09 RA 1 Frisch MJ, Trucks GW, Schlegel HB, Scuseria GE, Robb MA, et al. Gaussian, 121. Wallingford CT: gaussian. Inc (2009). p. 150–66.
37. De La Torre G, Nicolau M, Torres T. Phthalocyanines: Synthesis, Supramolecular Organization, and Physical Properties. Supramolecular Photosensitive and Electroactive Materials. Amsterdam(Netherlands): Elsevier (2001). p. 1–111. doi:10.1016/b978-012513904-5/50003-x
38. Rao SV, Krishnakanth KN, Indumathi C, Girisun TS. Non-linear Optical Properties of Novel Nanomaterials. Handbook Laser Techn Appl Lasers Appl Mater Process Spectrosc (2021) 3:255. (Volume Three). doi:10.1201/9781315310855-21
39. Banerjee D, Moram SSB, Byram C, Rathod J, Jena T, Podagatlapalli GK, et al. Plasmon-enhanced Ultrafast and Tunable Thermo-Optic Nonlinear Optical Properties of Femtosecond Laser Ablated TiO2 and Silver-Doped TiO2 Nanoparticles. Appl Surf Sci (2021) 569:151070. doi:10.1016/j.apsusc.2021.151070
41. Mushtaq A, Pradhan B, Kushavah D, Zhang Y, Wolf M, Schrenker N, et al. Third-Order Nonlinear Optical Properties and Saturation of Two-Photon Absorption in Lead-Free Double Perovskite Nanocrystals under Femtosecond Excitation. Acs Photon (2021) 8(11):3365–74. doi:10.1021/acsphotonics.1c01351
42. Hegde PK, Vasudeva Adhikari A, Manjunatha MG, Suchand Sandeep C, Philip R. Novel Poly (3, 4‐dialkoxythiophene) S Carrying 1, 3, 4‐oxadiazolyl‐biphenyl Moieties: Synthesis and Nonlinear Optical Studies. Polym Int (2011) 60(1):112–8. doi:10.1002/pi.2919
43. Chen B, Huang X, Gou D, Zeng J, Chen G, Pang M, et al. Rapid Volumetric Imaging with Bessel-Beam Three-Photon Microscopy. Biomed Opt express (2018) 9(4):1992–2000. doi:10.1364/boe.9.001992
44. Williams RM, Shear JB, Zipfel WR, Maiti S, Webb WW. Mucosal Mast Cell Secretion Processes Imaged Using Three-Photon Microscopy of 5-hydroxytryptamine Autofluorescence. Biophysical J (1999) 76(4):1835–46. doi:10.1016/s0006-3495(99)77343-1
45. Horton NG, Wang K, Kobat D, Clark CG, Wise FW, Schaffer CB, et al. In Vivo three-photon Microscopy of Subcortical Structures within an Intact Mouse Brain. Nat Photon (2013) 7(3):205–9. doi:10.1038/nphoton.2012.336
46. Moreels I, Hens Z, Kockaert P, Loicq J, Van Thourhout D. Spectroscopy of the Nonlinear Refractive index of Colloidal PbSe Nanocrystals. Appl Phys Lett (2006) 89(19):193106. doi:10.1063/1.2385658
47. Ahmed MS, Biswas C, Miranda PB, Raavi SSK. Nonlinear Optical Techniques for Characterization of Organic Electronic and Photonic Devices. Eur Phys J Spec Top (2021) 231:1–17. doi:10.1140/epjs/s11734-021-00391-8
48. Venkatram N, Rao DN, Giribabu L, Rao SV. Nonlinear Optical and Optical Limiting Studies of Alkoxy Phthalocyanines in Solutions Studied at 532 Nm with Nanosecond Pulse Excitation. Appl Phys B (2008) 91(1):149–56. doi:10.1007/s00340-008-2934-5
49. Ekbote A, Patil P, Maidur SR, Chia TS, Quah CK. Structural, Third-Order Optical Nonlinearities and Figures of merit of (E)-1-(3-substituted Phenyl)-3-(4-Fluorophenyl) Prop-2-En-1-One under CW Regime: New Chalcone Derivatives for Optical Limiting Applications. Dyes Pigm (2017) 139:720–9. doi:10.1016/j.dyepig.2017.01.002
50. Biswas C, Krishnakanth K, Lade J, Chaskar A, Tripathi A, Chetti P, et al. Linear and Femtosecond Nonlinear Optical Properties of Soluble Pyrrolo [1, 2-a] Quinoxalines. Chem Phys Lett (2019) 730:638–42. doi:10.1016/j.cplett.2019.06.062
51. Rao SV, Srinivas NN, Rao DN, Giribabu L, Maiya BG, Philip R, et al. Studies of Third-Order Optical Nonlinearity and Nonlinear Absorption in Tetra Tolyl Porphyrins Using Degenerate Four Wave Mixing and Z-Scan. Opt Commun (2000) 182(1-3):255–64. doi:10.1016/s0030-4018(00)00808-7
52. Zadrożna I, Kaczorowska E. Relationship between Structure and Nonlinear Optical Properties of New Bisazo Chromophores. Theoretical and Experimental Study. Struct Chem (2008) 19(1):131–5. doi:10.1007/s11224-007-9262-y
53. Iliopoulos K, Czaplicki R, El Ouazzani H, Balandier J-Y, Chas M, Goeb S, et al. Physical Origin of the Third Order Nonlinear Optical Response of Orthogonal Pyrrolo-Tetrathiafulvalene Derivatives. Appl Phys Lett (2010) 97(10):101104. doi:10.1063/1.3482943
54. Warde U, Sekar N. NLOphoric Mono-Azo Dyes with Negative Solvatochromism and In-Built ESIPT Unit from Ethyl 1, 3-Dihydroxy-2-Naphthoate: Estimation of Excited State Dipole Moment and pH Study. Dyes Pigm (2017) 137:384–94. doi:10.1016/j.dyepig.2016.10.032
55. Prabhakar C, Yesudas K, Bhanuprakash K, Rao VJ, Santosh Kumar RS, Rao DN. Linear and Nonlinear Optical Properties of Mesoionic Oxyallyl Derivatives: Enhanced Non-resonant Third Order Optical Nonlinearity in Croconate Dyes. J Phys Chem C (2008) 112(34):13272–80. doi:10.1021/jp803025v
56. Tran K, Scott GW, Funk DJ, Moore DS. Resonantly Enhanced, Degenerate Four-Wave Mixing Measurement of the Cubic Molecular Hyperpolarizability of Squaraine Dyes at 700 Nm. J Phys Chem (1996) 100(29):11863–9. doi:10.1021/jp960447n
57. Manzoni V, Modesto-Costa L, Del Nero J, Andrade-Filho T, Gester R. Strong Enhancement of NLO Response of Methyl orange Dyes through Solvent Effects: A Sequential Monte Carlo/DFT Investigation. Opt Mater (2019) 94:152–9. doi:10.1016/j.optmat.2019.05.018
58. Sreenath M, Joe IH, Rastogi V. Experimental and Theoretical Investigation of Third-Order Nonlinear Optical Properties of Azo Dye 1-(2, 5-Dimethoxy-Phenylazo)-Naphthalen-2-Ol by Z-Scan Technique and Quantum Chemical Computations. Dyes Pigm (2018) 157:163–78. doi:10.1016/j.dyepig.2018.04.044
59. Jayareshmi D, Robert HM, Aruldhas D. Elucidation of the Structure, Spectroscopic Techniques and Quantum Chemical Investigations on Nonlinear Optical Material 2-Hydroxy-5-Methylbenzaldehyde. J Mol Struct (2021) 1238:130426. doi:10.1016/j.molstruc.2021.130426
60. Patil P, Maidur SR, Rao SV, Dharmaprakash S. Crystalline Perfection, Third-Order Nonlinear Optical Properties and Optical Limiting Studies of 3, 4-Dimethoxy-4′-Methoxychalcone Single crystal. Opt Laser Techn (2016) 81:70–6. doi:10.1016/j.optlastec.2016.01.033
61. Polavarapu L, Venkatram N, Ji W, Xu Q-H. Optical-limiting Properties of Oleylamine-Capped Gold Nanoparticles for Both Femtosecond and Nanosecond Laser Pulses. ACS Appl Mater Inter (2009) 1(10):2298–303. doi:10.1021/am900442u
62. Rao SV, Anusha PT, Prashant TS, Swain D, Tewari SP. Ultrafast Nonlinear Optical and Optical Limiting Properties of Phthalocyanine Thin Films Studied Using Z-Scan. Mater Sci Appl (2011) 2(05):299. doi:10.4236/msa.2011.25039
Keywords: green fluorescent protein, Z-scan technique, DFT, femtosecond, second hyperpolarizability, optical limiting
Citation: Ahmed MS, Biswas C, Banerjee D, Chetti P, Yang J-S, Soma VR and Raavi SSK (2022) Femtosecond Third-Order Non-Linear Optical Properties of Unconstrained Green Fluorescence Protein Chromophores. Front. Phys. 10:914135. doi: 10.3389/fphy.2022.914135
Received: 06 April 2022; Accepted: 24 May 2022;
Published: 04 July 2022.
Edited by:
Gagan Kumar, Indian Institute of Technology Guwahati, IndiaCopyright © 2022 Ahmed, Biswas, Banerjee, Chetti, Yang, Soma and Raavi. This is an open-access article distributed under the terms of the Creative Commons Attribution License (CC BY). The use, distribution or reproduction in other forums is permitted, provided the original author(s) and the copyright owner(s) are credited and that the original publication in this journal is cited, in accordance with accepted academic practice. No use, distribution or reproduction is permitted which does not comply with these terms.
*Correspondence: Venugopal Rao Soma, c29tYV92ZW51QHVvaHlkLmFjLmlu; Sai Santosh Kumar Raavi, c3NrcmFhdmlAcGh5LmlpdGguYWMuaW4=
Disclaimer: All claims expressed in this article are solely those of the authors and do not necessarily represent those of their affiliated organizations, or those of the publisher, the editors and the reviewers. Any product that may be evaluated in this article or claim that may be made by its manufacturer is not guaranteed or endorsed by the publisher.
Research integrity at Frontiers
Learn more about the work of our research integrity team to safeguard the quality of each article we publish.