 Yaqiao Wu
 Saini Yang
 Jingyan Wu
 Fuyu Hu
95% of researchers rate our articles as excellent or good
Learn more about the work of our research integrity team to safeguard the quality of each article we publish.
Find out more
ORIGINAL RESEARCH article
Front. Phys. , 11 July 2022
Sec. Interdisciplinary Physics
Volume 10 - 2022 | https://doi.org/10.3389/fphy.2022.912569
Extreme weather has long been a threat to human life and critical infrastructures. Previous studies have focused on the reliability and vulnerability of single or interdependent infrastructures under extreme weather threats. However, knowledge of the interactions between coupled real-world complex systems, especially the cascading failure process induced by external shocks, is essential, but the interactions receive less attention. Here, we took the historical winter storm of Texas that occurred in February 2021 as a case study and collected multisource data to explore the interaction between humans and the power system affected by extreme weather. A connectivity-based network was proposed to analyze the connectivity robustness and simulate the cascade of overload failures under random and malicious attacks. Results showed that this network presents higher robustness under random attacks in terms of network connectivity. However, a highly heterogeneous distribution of load was shown in this network, making it particularly vulnerable to attacks and easier to trigger cascading failures. An interacting negative feedback mechanism was discovered in this coupled extreme weather–humans–infrastructure system. Extreme weather events directly caused physical failure in infrastructures, while their impact on individuals stimulated the power demand for heat. An increase in demand further intensified the load on the power network, which induced functional failure in infrastructure systems and finally aggravated the adverse impact on people as end-users in return. This feedback loop inspired us to reconsider the relationship among natural disasters, critical infrastructure, and humans. Furthermore, even under the background of climate change, the impact of extremely cold weather on electric infrastructures is still worthy of attention since the fluctuation of yearly minimum temperature outstood in eastern Texas, where the majority of the population and electric transmission facilities are located. Thus, it is noteworthy to integrate the interaction between systems in the vulnerability assessment of infrastructure systems or the impact prediction of intense external shocks in future research.
Extreme weather has been recognized as the top global risk in terms of likelihood by the World Economic Forum’s Global Risks Report since 2017 and as one among the top 4 global risks ranked by impact in 2020, following climate action failures, weapons of mass destruction, and biodiversity loss [1]. The newly published Sixth Assessment Report [2] by the Intergovernmental Panel on Climate Change (IPCC) stressed that the intensity and frequency of extreme events generally scale with global warming and that even a small increase in global warming will cause significant changes in extremes on the regional and global scales with high confidence.
Extreme weather, as a typical external shock, has caused widespread failure of power systems [3]. Electric grid, as a vital component of critical infrastructures and the backbone of modern life, has long been subject to extreme weather conditions. Severe weather has been recognized as the leading cause of power outages in the United States. Extreme weather events caused approximately 679 widespread power outages, affecting at least 50,000 customers each year from 2003 to 2012 [4]. In the Nordic region, from 2003 to 2012, the European Network of Transmission System Operators for Electricity reported that 36–43% of grid disturbances resulted from environmental factors in five countries, including Denmark, Finland, Iceland, Norway, and Sweden [5]. Among the major weather-related power outages worldwide, in the period 2011–2016, the outage due to Super Typhoon Rammasun in 2014 affected the largest number of people, as 13,000,000 customers suffered in Luzon, the Philippines [6].
From the perspective of an isolated complex network, research on the impact of natural disasters on electric power systems has explored how to increase the resilience of a grid [7]. Reliability analysis (to obtain a picture of a system’s likely behavior) and vulnerability analysis (to estimate the magnitude of the negative consequences that arise, given that a strain is imposed on the system) are two main approaches [8]. Reliability of an electric power system generally refers to the continuity and quality of electric power supply to customers. Methods based on Monte–Carlo simulation are currently the most effective and widely used techniques to assess the reliability of power systems [9, 10]. For instance, Zhou assessed the overhead distribution line failure rates based on the Poisson regression model and the Bayesian network model, which predicted the yearly weather-related failure events on overhead lines and determined the prediction bounds with a Monte–Carlo analysis [11]. Reference [12] summarized the approaches to evaluate the network vulnerability, including scenario-specific, strategy-specific, simulation, and mathematical modeling assessments.
New trends discuss the cascading effects of power networks, since the integration of critical infrastructures contributes to increasing complexity and heterogeneity due to their interdependence at multiple levels [13, 14]. Agent-based modeling [15, 16], network-based modeling (topology-based methods and flow-based methods) [17], economic-based modeling [18], and Bayesian networks [19] are popular methodologies for modeling cascading failures of electric power outages in interconnected systems. Reference [20] divided the research on cascading failure blackouts of modern power systems into two branches. One branch is based on power flow and stability analysis, and the other branch is based on network topology analysis. Small-world network models and scale-free network models are commonly applied in network topology analysis. However, a power grid, in reality, is usually not a typical type of network. The cascading effect of power outages in a particular electric network could be different.
Moreover, the impact of power outages could be expanded if the extreme weather coincides with social activities. For instance, in January 2008, an unprecedented magnitude of frozen rain and snow storms knocked down a sizable segment of the electric grid in southern China, resulting in large-scale blackouts and road and railway closures during the annual travel peak [21]. Since this freeze occurred during the Spring Festival, which is the most important traditional festival in China that marks the beginning of a year, a large number of people needed to return to their hometowns, which further aggravated the impact of this extreme event on the public. In similar, ref. [22] examined the demand-side responses of industrial, commercial, and residential sectors’ effect on the reliability of the power grid electricity after seismic hazards and suggested improving community resilience by regulating electricity consumption. In this context, limitations arose due to the geographic scope of analysis and in terms of handling case-specific variables.
Our study investigates the interactions between the power system and humans affected by extreme weather events, in particular the February 2021 historical winter storm in Texas. Figure 1 shows the framework of this study. First, an electric network using the complex network theory based on infrastructure data in Texas is conducted; then, the network connectivity-based critical components and areas are analyzed. Random and malicious attacks are simulated to understand the robustness of network connectivity. Then, cascading failures in the network are simulated considering different tolerance parameters of nodes. A correlation analysis is conducted to explore variables related to power outages at the county level, including socioeconomic, infrastructure, environmental, and meteorological factors. An interacting negative feedback mechanism in coupled human–infrastructure systems and the long-term spatiotemporal distribution of extremely cold days in Texas are discussed. An intersystem impact mechanism of the connectivity and function of complex systems is concluded from this case study. The interaction between systems is found to amplify the impact of external shocks on both humans and electric infrastructure systems.
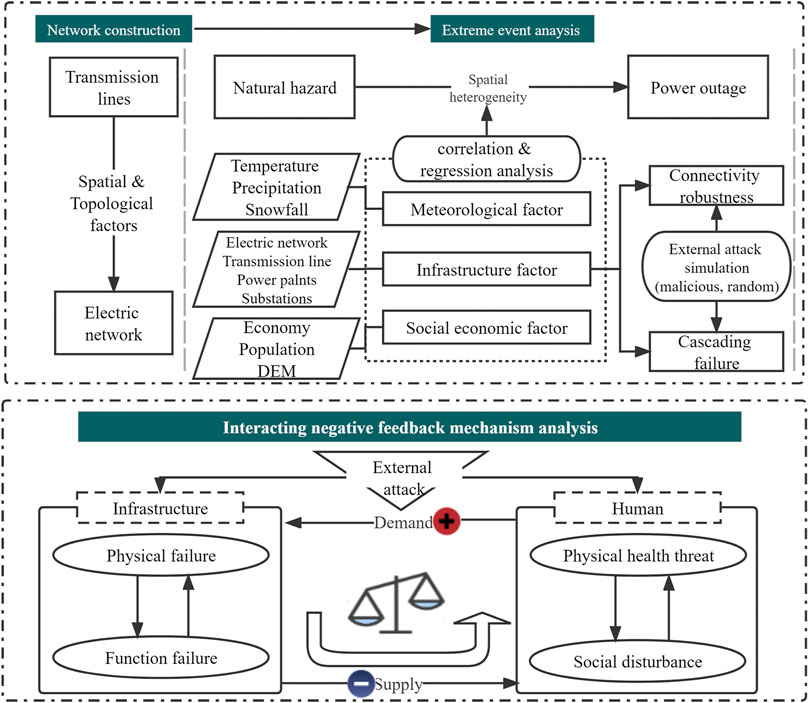
FIGURE 1. Framework of this study.
In February 2021, a historical 9-day period of winter weather brought snow, sleet, freezing rain, and extremely cold temperatures to southeastern Texas. According to the National Weather Service, this record-breaking Arctic air moved through the region on 15 February as a strong upper-level low-pressure system with snow. Temperatures quickly fell into the teens and single digits. All climate sites saw 5–6 consecutive days of temperature records, as well as multiple days of record-breaking snowfall. This historical event had catastrophic impacts on the entire state of Texas, including South Central Texas, with failed power grids, burst water pipes, limited road and air travel, and other social impacts on the region [23, 24]. More than 111 people died during the freeze, which was estimated to cause $130 billion loss in Texas alone and $155 billion for the country as a whole [25, 26]. More than 4.5 million households were left without electricity at its peak, some for several days [27].
This study primarily involves three types of data, including meteorological data, electric system data, and socioeconomic data. Two types of meteorological data are utilized. Station meteorological data collected from the Global Historical Climatology Network-Daily (GHCN-Daily) dataset Version 3 [28], including daily maximum and minimum temperature (Celsius), precipitation (mm), snowfall (mm), and snow depth (mm), are used to analyze meteorological factors during the extreme event in this research. This dataset is provided by the National Centers for Environmental Information of National Oceanic and Atmospheric Administration. In addition, historical temperature data (K) from GFDL-CM4 with 100 km resolution from 1850 to 2019 are obtained and used for trend analysis [29]. The data for electric transmission lines, substations, and power plants are collected from the Homeland Infrastructure Foundation-Level Data1. Data on power outages across the state of Texas on 16th and 17th February at the county level are obtained from the USA Today, to verify the critical component results of this research2. Moreover, the hourly electric system operating data, including demand and net generation by energy source for Texas, are obtained from the U.S. Energy Information Administration3. The SRTM 30 m Digital Elevation Data4 is utilized in spatial correlation and regression analysis. The census data are obtained from the demographic center of Texas5, and GDP at the county level is collected from the Bureau of Economic Analysis6.
Since Texas’s electric grid is largely self-contained, a network that represented Texas’s main grid based on the transmission lines is constructed. Considering that the transmission lines of EI Paso and Hudspeth are not connected with the other counties in Texas, both counties are excluded. In this network, nodes (
Considering that the network topology determines heterogeneity of the node’s importance to network connectivity, critical analysis is utilized to quantify this character of nodes in an electric network. Critical node identification aims to determine a set of nodes whose removal minimizes the network connectivity. In this research, the size of the largest connected components (
where
where
In real-world electric power systems, the power flow under external attack can be a very complex issue and refers to relevant theories, technologies, and data support. Since this research focuses on the interactions between humans and the electric system under the external shock of extreme weather based on spatial heterogeneity analysis, the complex network analysis method can be used to simulate load distribution. For the constructed network, it is assumed that the energy is exchanged between each pair of nodes and transmitted along the shortest path connecting them from the perspective of reducing energy loss. The load at a node can be measured using the total number of shortest paths passing through the node [31–34], which is computed as:
where
A single node failure changes the energy redistribution in the network as well as the shortest paths. If the redistributed load exceeds the capacity of a node, the node fails. The failure of every single node may lead to a new redistribution and result in subsequent failure until a new balance is reached in the network. However, the initial load and capacity of each node in reality are unknown. Thus, in this research, it is assumed that the tolerance rates of nodes in this network are homogeneous. The capacity of node V (
The complex network theory is applied to electric network analysis. The results show that the constructed network contains 6,413 nodes and 17,652 edges in total, and it is not fully connected. The size of the largest connected components (
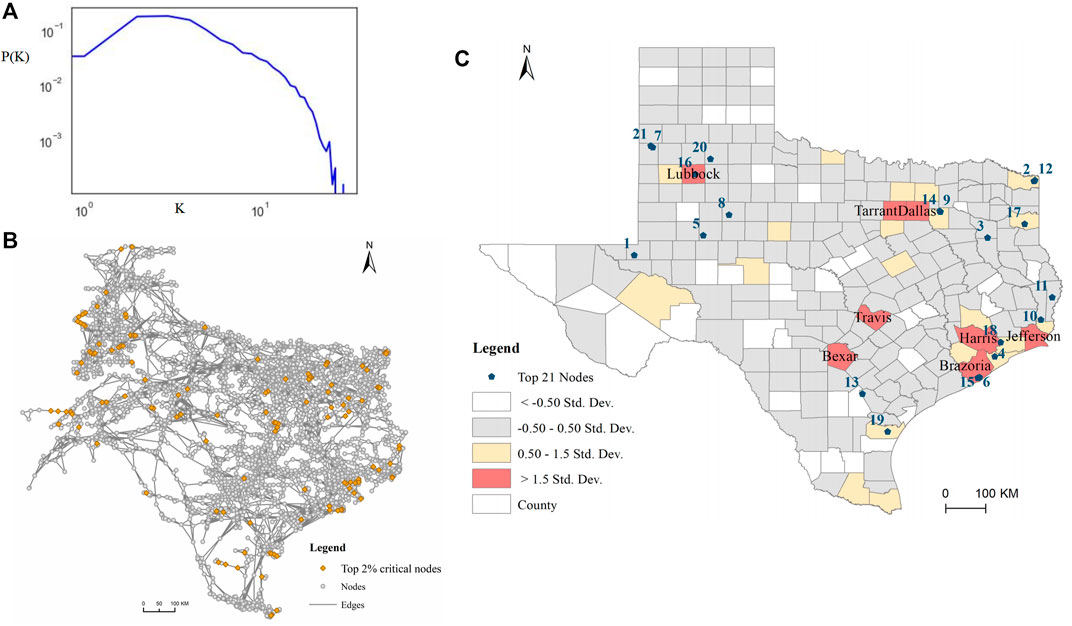
FIGURE 2. (A) Degree distribution of nodes in Texas's electric power network. P(K) is the probability that a randomly chosen node will have degree K. (B) Topology of the constructed network. The top 2% critical nodes are highlighted. (C) Spatial distribution of the top critical components and critical index at the county level. Numbers are the critical importance ranking of the top 21 nodes.
From the perspective of the spatial distribution of critical nodes, Figure 2C shows the top 21 key nodes and critical index of each county. In general, the top 21 critical components are mainly located in the northwest and southeast regions of Texas. The critical index values of counties including Lubbock, Tarrant, Dallas, Travis, Bexar, Harris, Jefferson, and Brazoria are above 1.5 standard deviations. The majority of critical areas are located in eastern Texas, which indicates that these counties are essential for maintaining this network performance.
To evaluate the connectivity robustness of this network, random attacks and two strategies of malicious attacks are simulated. The network connectivity is measured by the size of the largest subgraph in the network. As demonstrated in Figure 3, this network shows higher connectivity robustness under random attacks compared to malicious attacks. In terms of malicious attacks, target nodes are selected from those with the highest loads (in violet) and the largest degrees (in yellow). A discontinuous change is observed in the network connectivity when 13–25% of nodes with the largest degree are removed. The threshold of this phenomenon decreased to below 5% when nodes with the highest load are attacked. This indicates that from the perspective of network connectivity, nodes with the highest load are of high importance. To maintain the majority of components connected, it is essential that these nodes are protected and are in a high priority for repair.
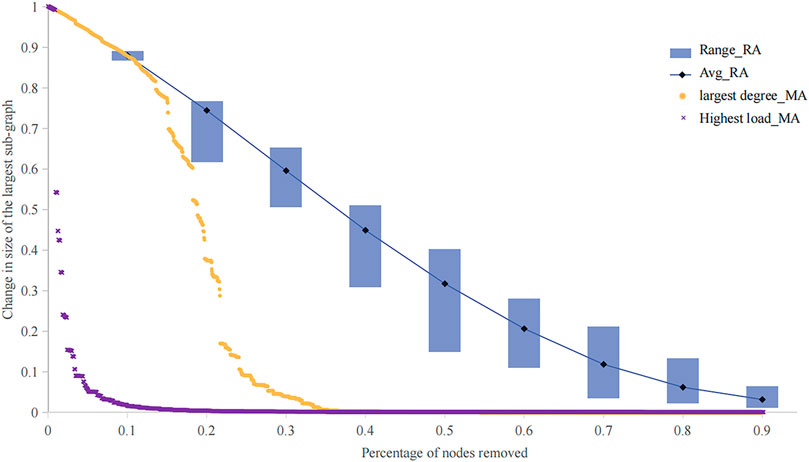
FIGURE 3. Connectivity robustness of the electric network under random attacks (RA) and malicious attacks (MA). The random attack is simulated by randomly removing 10%, 20%, 30%, 40%, 50%, 60%, 70%, 80%, and 90% of nodes from the network. The range shows the results of 100 simulations, and the black point represents the average value of changes in the size of the largest components under RA. MA are simulated by removing the node with the largest degree (yellow) and the highest load (violet) until 90% of the nodes are removed from the network.
In a real power transmission grid, each node handles a certain load. Failure of a node changes the balance of flows that can trigger cascading failure across the whole network due to reloading. The shortest paths connecting each pair of nodes may change with a node failure, resulting in changes in the load of connected nodes. If the newly allocated load exceeds the maximum capacity of a particular node, the node is regarded as a failure and removed from the network. In converse, if the newly allocated load is smaller than the maximum capacity of a node, it is a “survived” node. The maximum capacity of a node is determined by its current load and tolerance rate (α), which is defined as the ratio of additional load that a node could handle to its initial load (refer to Section 2.5).
Figure 4 shows the cascading failure of removing a single node of the network by a random breakdown and malicious attack. This network exhibits a highly heterogeneous distribution of load, since a homogeneous network does not experience cascading failures due to either malicious (always attack the node with the highest load) or random (attach each node with the same probability) attacks for tolerance rates as small as 0.05. For a small value of tolerance rate, the failure of a node with the highest load can reduce the size of the largest connected component to less than 10%. If the tolerance rate of nodes increases to 0.2, it could effectively protect this network collapse from the cascading failure caused by random failure of a single node. In general, malicious attacks on nodes are considered effective strategies to destroy network connectivity rather than random attacks. In this research, the load redistributed to other nodes may be higher after a malicious attack, and other nodes are highly likely to be overloaded. Therefore, in this electric network, the size of the largest connected components is smaller than 90% of the initial size after a malicious attack, even if the nodes in this network can deal with twice the initial load. All these indicate that if the load of nodes in the electric network is close to its critical tolerance rate, a disturbance of a single node could lead to collapse of the whole network.
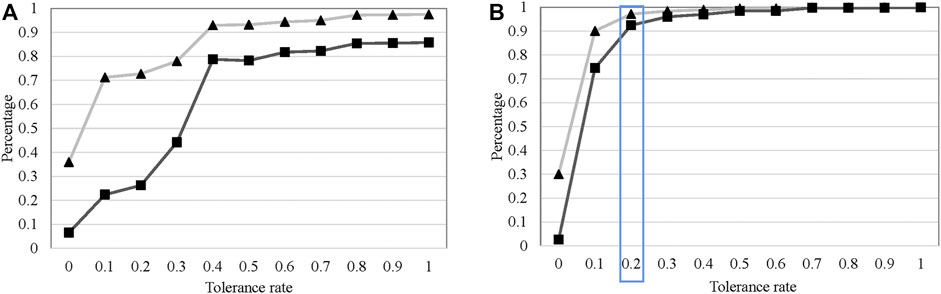
FIGURE 4. Cascading failure in the electric network in Texas, triggered by the removal of a single node chosen among those with (A) the highest load and (B) at random (remove one node randomly and repeat as many times as the number of 1% of total nodes). The curve shows changes in the size of the largest connected components (
In February 2021, a historical winter storm event hit Texas, causing a large number of Texans to suffer power outages. The spatial distribution of customers experiencing power outages on 16–17 February at the county level is shown in Figure 5. More than 7.7 million customers experienced power outages on these 2 days. Tarrant, Dallas, Bexar, Harris, and Brazoria all had more than 300 thousand customers without power on February 16th. According to meteorological data provided by the National Centers for Environmental Information of the National Oceanic and Atmospheric Administration, the daily maximum and minimum temperature in the majority of counties in Texas dipped below 0°C (see Supplementary Figure S1). It is interesting that the six highly impacted counties during the research period are all included in the critical areas shown in Figure 2.
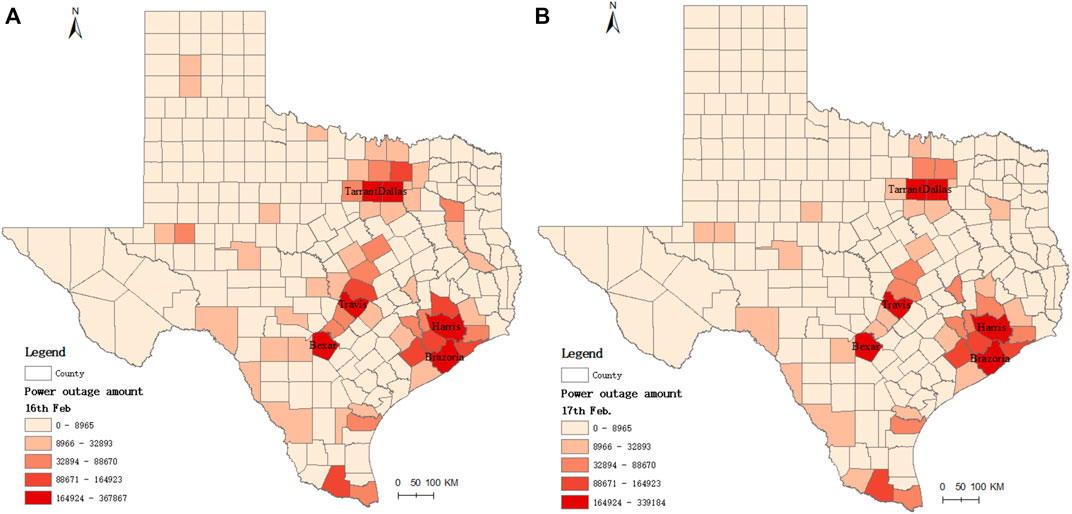
FIGURE 5. Power outage amount in Texas on (A) 16th February and (B) 17th February, 2021.
To further explore the potential key factors influencing the number of power outages, a correlation analysis is conducted, taking into consideration meteorological factors, infrastructure factors, environmental factors, and socioeconomic factors, as shown in Table 1. At the county level, the number of customers experiencing power outages is significantly positively correlated with population, GDP, critical index of electric infrastructure, length of transmission lines, and the number of substations and power plants in the county. Meanwhile, to exclude the effect of population, population density, GDP per capita, and infrastructure index (calculated by dividing the critical index value by the county population) are examined. The results show that there is still a significant correlation with population density, but for the GDP per capita and infrastructure index, the correlation is not significant. In addition, there seems to be little correlation between meteorological factors and power outage amount, even though this outage is clearly caused by the extreme weather.
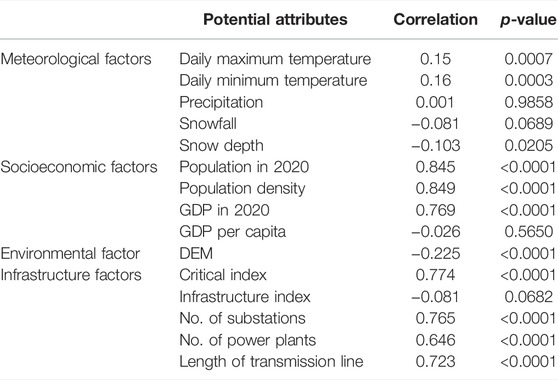
TABLE 1. Correlation analysis of the 2021 Texas power outages with potential attributes.
The results of the case study show that socioeconomic factors and infrastructure factors are more relevant to the number of local customers suffering from electric power outages. However, the meteorological data do not show a significant association with power outages (Table 1). This means that the direct impact of extreme weather on the electric system may not be the immediate cause of a large number of power outages. Meanwhile, a strong positive correlation is observed between the county population and density and power outages. Population size is probably a more intermediate variable than the impact of extreme weather events on power systems.
To further explore the hidden factors amplifying the impact of extreme weather on the electric system, the correlation between six meteorological factors and electric power net supply and demand in Texas is analyzed (see Supplementary Figure S2), including precipitation, snowfall, daily minimum and maximum temperature, the fastest 5-s wind speed, and the fastest 2-min wind speed. A highly negative relation is shown between temperature and energy demand. The correlation between daily electric power demand and temperature in Texas from a longer time scale is examined (Figure 6A). In general, as the temperature dropped down in February, the demand for electric power tends to increase. From the perspective of power supply, according to the U.S. Energy Information Administration, the absolute amount of net generation noticeably increased together with the increase in demand during this winter storm, as shown in Figure 6B. An increase in power supply during this extreme event indicates that the majority of facilities were able to provide an excess amount of power, even though clean energies were seriously affected. From the perspective of demand, a significant increase in the gap between demand and supply is demonstrated in Figure 6C. Demand seems to be an essential factor in this large-scale power outage and is mainly determined by the population size. This also explains why the population is found to be the most relevant factor in power outages.
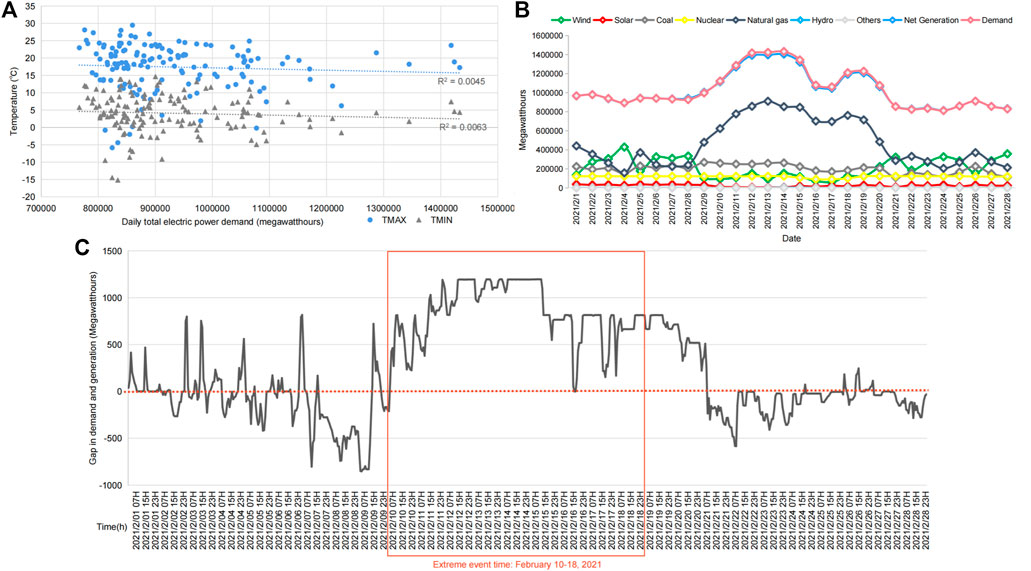
FIGURE 6. (A) Relationship between daily electric power demand and temperature in February in Texas from 2017 to 2021; (B) demand and net generation by energy source for Texas in February 2021; and (C) gap between demand and net generation in February 2021.
These results indicate that the path of this catastrophic event is different from the common pattern, which generally considers direct failure and cascading failure within a single system. In this event, extreme cold weather increased people’s demand for electricity to keep warm. The increased demand leads to a higher load of nodes in the electric network and even close to some of their maximum capacity. A small disruption could lead to the collapse of the whole network. In this case, rolling power outages was the necessary action taken by local entities to avoid greater risk. However, as many local people rely on electricity for heat, power outages impact people’s physical health and daily life, which is difficult to quantify. If the service interruption of other critical infrastructure caused by the power outages is taken into consideration, such as road closures and water outages, the negative feedback on humans is even worse.
Therefore, an interacting negative feedback mechanism is discovered in this real-world case, as demonstrated in Figure 7. Extreme weather as a typical external attack causes physical failure of infrastructure facilities and threatens the physical health of humans. In response to this threat, the actions taken by local people increase the demand for the power system and lead to functional failure of the electric infrastructure. Functional failure further induces disturbance in human life, even social disturbance, considering the negative impacts transmitted from other interconnected critical infrastructures. Thus, integrating negative feedback between infrastructure and humans is essential in assessing the vulnerability of infrastructure systems or predicting the impact of extreme weather especially in the context of climate change.
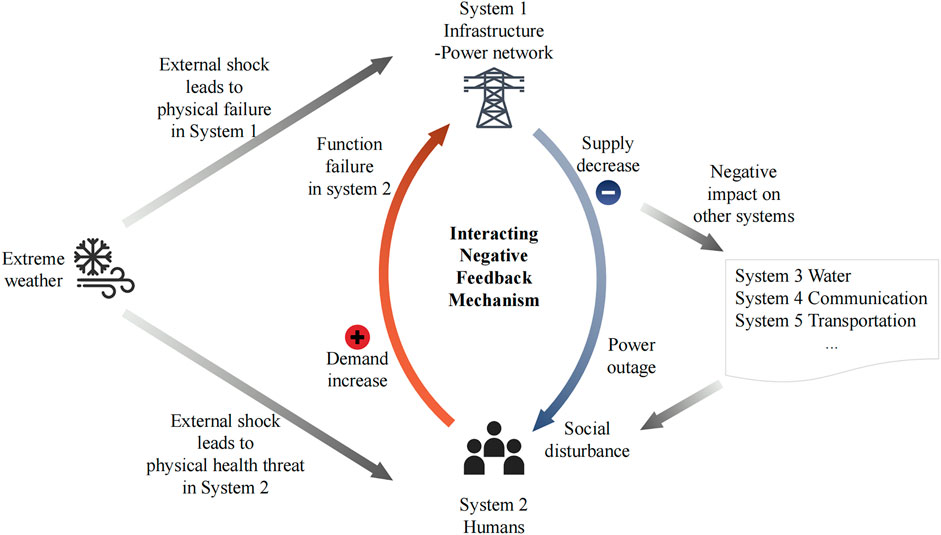
FIGURE 7. An interacting negative feedback mechanism.
In addition to the interacting negative feedback mechanism analyzed above, a multiple linear regression model is utilized to discuss weights for power outage attributes in this case study. Power outages in this case are modeled as a linear function of other attributes, including the abovementioned factors in Table 1. The results show that GDP, population, snow depth, the number of power plants, and DEM are most relevant to power outages. This model has a coefficient of determination (R-squared) of 0.74 (see Supplementary Tables S2A,S2B). Snow depth, as an indicator of the intensity of natural hazards, shows a negative correlation with the number of power outages. In addition, a negative correlation is also observed in DEM. This is because the population is mainly located in counties with lower DEM and the snow depth decreases with lower DEM (see Supplementary Table S2C). The number of power plants and population both display a positive correlation with power outages. This may be due to the exposure increases with population and then results in an increase in power outages. Moreover, a county with a higher level of GDP means residents and local entities are more likely to invest in disaster mitigation and risk reduction, which can decrease the impact of external shocks caused by extreme weather. These results are in accordance with the basic theoretical frameworks of disaster systems in which the impact of natural disaster is a coupling effect between multiple elements, consisting of hazards, exposures (hazard-affected body), and environments (hazard-formative environment) [35].
Furthermore, power consumption is another important element that needs to be discussed. The Texas power market design normally allows for price discovery between buyers and sellers, which means prices rise with demand. During the extreme weather event in February 2021, the Public Utility Commission of Texas set a $9,000 per MW hour (MWh) price cap, while pre-storm spot prices were about $30/MWh [36]. Previous evidence indicates that the household electrical consumption scales linearly with the population [37]. In terms of extreme temperatures, residential electricity consumption was found to be significantly increased on days with extreme temperatures in previous research [38]. The electric power consumption of different groups of the population may be affected by socioeconomic factors, i.e., the pricing rules, purchasing power, and electric facilities utilized in the house. Also, the population is dynamic in cities [39, 40], and when extreme weather hits, the power consumption and power outages may vary with the population dynamic.
Climate change has been widely studied. Models project increases in the frequency and magnitude of warm daily temperature extremes and decreases in cold extremes by the end of the 21st century [41]. To explore the long-term trend in Texas, the extreme cold weather temperatures (95th percentile) in Texas from 1850 to 2019 are analyzed. The results show that the average number of extreme days from 1935 to 2019 is 0.13 higher than that from 1850 to 1934 (see Supplementary Figure S3). In this case, the extreme cold weather seems to have increased over the past 170 years. Furthermore, the extreme cold weather in Texas shows spatial variation. Comparing the variance in the yearly minimum temperature in Texas (see Supplementary Figure S4), it is found that the eastern area of Texas is more likely to experience more intense extreme cold weather. In current, the majority of inhabitants and electrical transmission lines in Texas are located in the eastern area. The findings imply that the compound effect of extreme cold weather and population density might be more challenging in eastern Texas. This indicates an urgency to enhance electric infrastructure resilience to reduce the influence of extreme cold weather in the future.
The impact of the 2021 winter storm on human and power systems is a complex question. Due to data limitations, in this study, only power outages data are considered to illustrate the impact of the extreme weather event. Data on the direct physical damage of this extreme event on facilities in Texas’ electric grid, such as damage to power plants, substations, and transmission lines, are unavailable. In this case, the number of power plants, substations, and the length of transmission lines located in the county are used in correlation analysis. Thus, the internal interactions within the infrastructure system caused by this extreme weather event are not quantified which limits the implication of this work in power outage prediction. Besides, we employed the complex network analysis method to simulate cascading failure in the electric network. The load at a node was measured by the total number of shortest paths passing through the node which did not take the physical laws into account. The duration of power outages as another indicator of severe consequences is not included due to the limitation of the temporal revolution of outage data. Instead, the intensity of function failure is mainly measured by the amount and percentage of customers suffering power outages in each county. In addition, the analysis results could be affected by emergency actions taken by the local authorities to avoid a larger-scale failure. In reality, the power outage data reflect the severe consequence of the interacting negative feedback in this coupled extreme weather–humans–infrastructure system at a certain time.
This study used the 2021 winter storm in Texas as a case study, whereby the electric network was constructed, with the critical components and areas analyzed using the complex network theory. Compared to malicious attacks, this network showed high connectivity robustness under random attacks. Meanwhile, in terms of the strategy taken by malicious attacks, if targeted nodes are selected from those with the highest load, the network connectivity is more vulnerable. The removal of a node leads to energy redistribution in an electric network, which could trigger cascading failure in the whole network. Random attacks and intentional attacks were simulated to determine the cascading failure in this network, considering different tolerance rates of nodes. The load capacity of nodes, network topology, and types of attacks could affect the impact of cascading failure. In general, the network exhibited a highly heterogeneous distribution of load. Under malicious attacks, the network connectivity could not maintain 90% of the initial state, even if each node could deal with double the load. In particular, if the load of nodes in an electric network is close to its capacity, a disturbance of a single node could lead to the collapse of the whole network. These results readdress the importance of system redundancy subject to various disturbances. With a higher level of redundancy, a new balance of load distribution could be quickly achieved in the absence of one or several nodes, avoiding a large-scale cascading failure in a system.
The proposed framework is the main contribution of this study, in which a regression model explores the causal relationship among meteorological factors, infrastructure factors, socioeconomic factors, environmental factors, and power outages. An interacting negative feedback mechanism was discovered in this real-world case study. The outage caused by extreme weather in Texas in February 2021 demonstrated that electric network topology and capacity, meteorological factors, and socioeconomic factors correlated. However, extreme weather events not only physically damage the infrastructure, but also stimulate an increase in power demand (load) via response actions taken by the public. As the load intensified, functional failure occurred in the power network, which, in return, aggravated the negative effect on people as end-users. This negative feedback loop contributed to the amplification of the negative impact of extreme events on the social-economic system. Reducing dependence on electricity through alternative ways to heat the house might be an option to cut off the feedback loop. In the face of climate change and frequent extreme weather events, the analysis of extremely cold days in Texas presented a slight upward trend from 1850 to 2019. The variance in the yearly minimum temperature in the eastern area increased, which means that the majority of the population and power networks might be threatened by extremely cold weather. Thus, even under the background of global warming, the risk of extremely cold weather is still worthy of attention. Overall, with case-based analysis, this study provides a new perspective to understand the relationship between extreme events and critical infrastructures, revealing the importance of synthesizing the interactions among natural disasters, critical infrastructure, and human beings in risk and impact assessments, especially within the context of climate change.
The original contributions presented in the study are included in the article/Supplementary Material, and further inquiries can be directed to the corresponding author.
All authors listed have made a substantial, direct, and intellectual contribution to the work and approved it for publication.
This study has received funding from the National Key Research and Development Program of China, grant number 2018YFC1508903, the Chinese Academy of Sciences Strategic Priority A Program “CAS Big Earth Data Science Engineering” (No. XDA19000000), Project SDG11, and the Key Laboratory of Environmental Change and Natural Disaster, Ministry of Education, Beijing Normal University.
The authors declare that the research was conducted in the absence of any commercial or financial relationships that could be construed as a potential conflict of interest.
All claims expressed in this article are solely those of the authors and do not necessarily represent those of their affiliated organizations, or those of the publisher, the editors, and the reviewers. Any product that may be evaluated in this article, or claim that may be made by its manufacturer, is not guaranteed or endorsed by the publisher.
The Supplementary Material for this article can be found online at: https://www.frontiersin.org/articles/10.3389/fphy.2022.912569/full#supplementary-material
1Homeland Infrastructure Foundation-Level Data. Electric Power Transmission Lines (2021). https://hifld-geoplatform.opendata.arcgis.com [Accessed 22 April 2021].
2United States today, Miller R. W (2021), ‘Massive failure’: Why are millions of people in Texas still without power? https://www.usatoday.com/in-depth/news/nation/2021/02/16/texas-weather-power-outage-rolling-blackouts-leave-millions-dark/6764764002/ [Accessed 26 July 2021].
3U.S. Energy Information Administration (2021). https://www.eia.gov/opendata/qb.php?category=3390033&sdid=EBA.TEX-ALL.NG.H [ Accessed 10 June 2021].
4Jarvis A., Reuter H.I., Nelson A., Guevara E. (2008). Hole-filled seamless SRTM data V4, International Centre for Tropical Agriculture (CIAT). https://srtm.csi.cgiar.org [Accessed 7 January 2022].
5Texas Demographic Center. 2020 Census Data Releases (2022). https://demographics.texas.gov/Data/Decennial/2020/[Accessed 6 January 2022].
6Bureau of Economic Analysis. GDP by County, Metro, and Other Areas (2022). https://www.bea.gov/data/gdp/gdp-county-metro-and-other-areas [Accessed 1 April 2022].
1.World Economic Forum. World Economic Forum, the Global Risks Report 2020- 15th Edition (2020). World Economic Forum. Geneva, Available at: http://www3.weforum.org/docs/WEF_Global_Risk_Report_2020.pdf (Accessed 5th Mar, 2020).
2.IPCC. Climate Change 2021: The Physical Science Basis. Contribution of Working Group I to the Sixth Assessment Report of the Intergovernmental Panel on Climate Change (2021). Cambridge University Press. Cambridge, United Kingdom. In Press.
3.Executive Office of the President. Economic Benefits of Increasing Electric Grid Resilience to Weather Outages (2013). Washington DC: President’s Council of Economic Advisers and the U.S. Department of Energy’s Office of Electricity Delivery and Energy Reliability. Technical Report. Available at: https://www.energy.gov/sites/default/files/2013/08/f2/Grid%20Resiliency%20Report_FINAL.pdf (Accessed March 15, 2020).
4. Kenward A., Raja U. Blackout: Extreme Weather, Climate Change and Power Outages. Princeton: Climate Central (2014).
5.European Network of Transmission System Operators for Electricity. Nordic Grid Disturbance Statistics 2012 (2013). Brussels, Belgium: ENTSO-E. p. 1–92.
6. Jufri F. H., Widiputra V., Jung J. State-of-the-art Review on Power Grid Resilience to Extreme Weather Events: Definitions, Frameworks, Quantitative Assessment Methodologies, and Enhancement Strategies. Appl Energ (2019) 239(APR.1):1049–65. doi:10.1016/j.apenergy.2019.02.017
7. Huang Y., Li P., Zhang X., Mu B., Mao X., Li Z. A Power Dispatch Optimization Method to Enhance the Resilience of Renewable Energy Penetrated Power Networks. Front Phys-lausanne (2021) 9:743670–9. doi:10.3389/fphy.2021.743670
8. Johansson J., Hassel H., Zio E. Reliability and Vulnerability Analyses of Critical Infrastructures: Comparing Two Approaches in the Context of Power Systems. Reliability Eng Syst Saf (2013) 120:27–38. doi:10.1016/j.ress.2013.02.027
9. Krupenev D., Boyarkin D., Iakubovskii D. Improvement in the Computational Efficiency of a Technique for Assessing the Reliability of Electric Power Systems Based on the Monte Carlo Method, Reliability Eng Syst Saf, 204 (2020). p. 107171. doi:10.1016/j.ress.2020.107171
10. Stern R. E., Song J., Work D. B. Accelerated Monte Carlo System Reliability Analysis through Machine-Learning-Based Surrogate Models of Network Connectivity. Reliability Eng Syst Saf (2017) 164:1–9. doi:10.1016/j.ress.2017.01.021
11. Zhou Y., Pahwa A., Yang S.-S. Modeling Weather-Related Failures of Overhead Distribution Lines. IEEE Trans Power Syst (2006) 21(4):1683–90. doi:10.1109/TPWRS.2006.881131
12. Murray A. T., Matisziw T. C., Grubesic T. H. A Methodological Overview of Network Vulnerability Analysis. Growth and Change (2008) 39(4):573–92. doi:10.1111/j.1468-2257.2008.00447.x
13. Chen Y., Milanovic J. V. Critical Appraisal of Tools and Methodologies for Studies of Cascading Failures in Coupled Critical Infrastructure Systems. In IEEE EUROCON 2017 -17th International Conference on Smart Technologies (2017). Ohrid, Macedonia: Institute of Electrical and Electronics Engineers. doi:10.1109/EUROCON.2017.8011182
14. Fotouhi H., Moryadee S., Miller-Hooks E. Quantifying the Resilience of an Urban Traffic-Electric Power Coupled System. Reliability Eng Syst Saf (2017) 163:79–94. doi:10.1016/j.ress.2017.01.026
15. Brown T., Beyeler W., Barton D. Assessing Infrastructure Interdependencies: the challenge of Risk Analysis for Complex Adaptive Systems. Int J Crit Infrastructures (2004) 1(1):108–17. doi:10.1504/ijcis.2004.003800
16. Rieger C. G., Moore K. L., Baldwin T. L. Resilient Control Systems: A Multi-Agent Dynamic Systems Perspective, In IEEE International Conference on Electro-Information Technology (2013) (2013). Rapid City, South Dakota, United States: EIT. 1–16. doi:10.1109/EIT.2013.6632721
17. Ouyang M. Review on Modeling and Simulation of Interdependent Critical Infrastructure Systems. Reliability Eng Syst Saf (2014) 121:43–60. doi:10.1016/j.ress.2013.06.040
18. Hasan S., Foliente G. Modeling Infrastructure System Interdependencies and Socioeconomic Impacts of Failure in Extreme Events: Emerging R&D Challenges. Nat Hazards (2015) 78:2143–68. doi:10.1007/s11069-015-1814-7
19. Di Giorgio A., Liberati F. A Bayesian Network-Based Approach to the Critical Infrastructure Interdependencies Analysis. IEEE Syst J (2012) 6(3):510–9. doi:10.1109/JSYST.2012.2190695
20. Shi L. B., Shi Z. Y., Yao L. Z., Ni Y. X., Bazargan M. A Review of Mechanism of Large Cascading Failure Blackouts of Modern Power System. Power Syst Tech (2010) 34(3):48–54. In Chinese. doi:10.13335/j.1000-3673.pst.2010.03.026
21. Wu X., Zhang G. Ice and Snow Disaster on the Electric Power Grid and Preventive Measures. (2008) 41(12): 14–8. In Chinese. doi:10.3969/j.issn.1004-9649.2008.12.004
22. Lee S., Park M., Lee H.-S., Ham Y. Impact of Demand-Side Response on Community Resilience: Focusing on a Power Grid after Seismic Hazards. J Manage Eng (2020) 36(6):04020071. doi:10.1061/(ASCE)ME.1943-5479.0000844
23.Austin/San Antonio Weather Forecast Office. February 2021 Historical Winter Storm Event South-Central Texas. Weather Event Summary (2021). Texas, United States: Weather Event Summary. Available at: https://www.weather.gov/media/ewx/wxevents/ewx-20210218.pdf (Accessed March 01, 2021).
24.Houston/Galveston Weather Forecast Office. Valentine's Week Winter Outbreak 2021: Snow, Ice, & Record Cold (2021). National Weather Service. Silver Spring, Maryland, United States, https://www.weather.gov/hgx/2021ValentineStorm (Accessed July 26, 2021).
25. Mulcahy S. At Least 111 People Died in Texas during winter Storm, Most from Hypothermia (2021). The Texas Tribune, Austin, Texas, United States, Available at: https://www.texastribune.org/2021/03/25/texas-deaths-winter-storm/ (Accessed March 26, 2021).
26. Puleo M. Damages from Feb. winter Storms Could Be as High as $155 Billion (2021). AccuWeather, State College, Pennsylvania, United States, Available at: https://www.accuweather.com/en/winter-weather/damages-from-feb-snowstorms-could-be-as-high-as-155b/909620 (Accessed March 19, 2021).
27. Gov P. C. Greg Abbott Says Power Is Almost Fully Restored Statewide and Grocery Stores Will Soon Be Restocked (2021). The Texas Tribune, Austin, Texas, United States. https://www.texastribune.org/2021/02/21/texas-power-outage-grocery-stores-greg-abbott/ (Accessed March 17, 2021).
28. Menne M. J., Durre I., Vose R. S., Gleason B. E., Houston T. G. An Overview of the Global Historical Climatology Network-Daily Database. J Atmos Oceanic Tech (2012) 29:897–910. doi:10.1175/JTECH-D-11-00103.1
29. Ploshay J., Hurlin W., John J. G., Blanton C., McHugh C., Radhakrishnan A., et al. NOAA-GFDL GFDL-CM4 Model Output Prepared for CMIP6 DAMIP Hist-Nat. Earth Syst Grid Fed (2018). Version 20180701. doi:10.22033/ESGF/CMIP6.11330
30. Birnbaum Z. W. On the Importance of Different Components in a Multicomponent System. In: PR Krishnaiah, editor. Multivariate Analysis-II. New York, NY, USA: Academic Press (1969). p. 581–92.
31. Motter A. E., Lai Y.-C. Cascade-based Attacks on Complex Networks. Phys Rev E Stat Nonlin Soft Matter Phys (2002) 66:065102. R. doi:10.1103/PhysRevE.66.065102
32. Holme P., Kim B. J. Vertex Overload Breakdown in Evolving Networks. Phys Rev E Stat Nonlin Soft Matter Phys (2002) 65:066109. doi:10.1103/PhysRevE.65.066109
33. Zhu X., Yu B., Zhang W., Gong W. Identification of Vulnerable Lines in Power Grid Based on Complex Network Theory, 2011 International Conference on Mechatronic Science, Electric Engineering and Computer MEC, Vancouver, Canada (2011). p. 118–21. doi:10.1109/MEC.2011.6025414
34. Saleh M., Esa Y., Mohamed A. Applications of Complex Network Analysis in Electric Power Systems. Energies (2018) 11(6):1381. doi:10.3390/en11061381
35. Shi P. Disaster Measurement, Statistics, and Assessment. Singapore: Springer (2019). p. 165–224. doi:10.1007/978-981-13-6689-5_4
36. Busby J. W., Baker K., Bazilian M. D., Gilbert A. Q., Grubert E., Rai V., et al. Cascading Risks: Understanding the 2021 winter Blackout in Texas. Energ Res Soc Sci (2021) 77:102106. doi:10.1016/j.erss.2021.102106
37. Bettencourt L. M. A., Lobo J., Helbing D., Kühnert C., West G. B. Growth, Innovation, Scaling, and the Pace of Life in Cities. Proc Natl Acad Sci U.S.A (2007) 104(17):7301–6. doi:10.1073/pnas.0610172104
38. Zhang S., Guo Q., Smyth R., Yao Y. Extreme Temperatures and Residential Electricity Consumption: Evidence from Chinese Households. Energ Econ (2022) 107:105890. doi:10.1016/j.eneco.2022.105890
39. Li R., Dong L., Zhang J., Wang X., Wang W.-X., Di Z., et al. Simple Spatial Scaling Rules behind Complex Cities. Nat Commun (2017) 8(1):1841. doi:10.1038/s41467-017-01882-w
40. Liu C., Yang Y., Chen B., Cui T., Shang F., Li R. Revealing Spatio-Temporal Interaction Patterns behind Complex Cities (2017). arXiv preprint arXiv:2201.02117.
41. Seneviratne S. I., Nicholls N., Easterling D., Goodess C. M., Kanae S., Kossin J., et al. Changes in Climate Extremes and Their Impacts on the Natural Physical Environment. In: Managing the Risks of Extreme Events and Disasters to Advance Climate Change Adaptation (2012). Cambridge, United Kingdom and New York, NY, United States: Cambridge University Press.
Keywords: extreme weather, power network, feedback mechanism, cascading failure, Texas
Citation: Wu Y, Yang S, Wu J and Hu F (2022) An Interacting Negative Feedback Mechanism in a Coupled Extreme Weather–Humans–Infrastructure System: A Case Study of the 2021 Winter Storm in Texas. Front. Phys. 10:912569. doi: 10.3389/fphy.2022.912569
Received: 04 April 2022; Accepted: 01 June 2022;
Published: 11 July 2022.
Edited by:
Naiming Yuan, Sun Yat-sen University, ChinaReviewed by:
Ruiqi Li, Beijing University of Chemical Technology, ChinaCopyright © 2022 Wu, Yang, Wu and Hu. This is an open-access article distributed under the terms of the Creative Commons Attribution License (CC BY). The use, distribution or reproduction in other forums is permitted, provided the original author(s) and the copyright owner(s) are credited and that the original publication in this journal is cited, in accordance with accepted academic practice. No use, distribution or reproduction is permitted which does not comply with these terms.
*Correspondence: Saini Yang, eWFuZ3NhaW5pQGJudS5lZHUuY24=
Disclaimer: All claims expressed in this article are solely those of the authors and do not necessarily represent those of their affiliated organizations, or those of the publisher, the editors and the reviewers. Any product that may be evaluated in this article or claim that may be made by its manufacturer is not guaranteed or endorsed by the publisher.
Research integrity at Frontiers
Learn more about the work of our research integrity team to safeguard the quality of each article we publish.