- School of Physics and Optoelectronic Engineering, Yangtze University, Jingzhou, China
We theoretically propose a scheme to measure the topological charge (TC) of a mid-infrared vortex beam via observing the intensity distribution of the four-wave mixing (FWM) field in an asymmetric semiconductor double quantum well. Due to the existence of Fano-type interferences, the special inherent interference takes place, and thus generates the interference-type phase and intensity patterns for the FWM field. Furthermore, it is demonstrated that the intensity and visibility of the interference-type intensity pattern can be drastically manipulated by adjusting the intensity and detuning the control field. Subsequently, we perform the TC measurement of the vortex driving field via directly monitoring the number of light spots of the FWM field. By choosing the suitable control parameters, the detectable value of the TC can reach to 120 with the visibility exceeding 0.97. Our scheme may provide the possibility for the realization of a mid-infrared OAM detector in a compact solid-state system.
1 Introduction
In the past several decades, the study of optical vortices carrying an orbital angular momentum (OAM) of lℏ per photon has been an active area in the field of optics since it was first proposed and experimentally observed by Allen et al. in 1992 [1]. As a structured light beam, the vortex beam contains a helical phase term eilϕ, where l is the topological charge (TC) [2]. The exchange and manipulation of optical vortices have been extensively investigated in a variety of structures and materials, such as liquid crystal films [3], metamaterials [4, 5], Dammann vortex grating [6], cold atomic ensembles [7–11], quantum dots [12, 13], molecular magnets [14], and graphene [15]. Meanwhile, optical vortices have been widely used in optical tweezers [16, 17], optical communication [18, 19], microscopic imaging [20, 21], quantum entanglement [22, 23], quantum teleportation [24, 25], and quantum information processing [26]. For most of these applications, it is of great importance to accurately measure the TCs of optical vortices. Until now, numerous approaches have been proposed to realize the TC measurement, such as using the torque measurement [27, 28], rotational Doppler effect [29], the diffractive optical elements including apertures [30, 31] and gratings [32, 33], the interference mechanisms of oblique plane waves [34], spherical waves [35, 36], Young’s double-slit [37, 38] and Mach–Zehnder [39, 40]. However, these approaches mostly require some specialized optical components or a good number of optical elements with fine alignment. Therefore, realizing the TC measurement of a vortex beam in a simple and efficient optical system still remains to be explored.
On the other hand, as a solid-state material working in the mid-infrared band, semiconductor quantum wells (SQWs) provide a promising platform for the coherent control of mid-infrared light transmission due to their advantages of high nonlinear optical coefficients, large electric dipole moments, and a flexible structure design. Until now, a host of breakthroughs have been made such as electromagnetically induced transparency (EIT) [41, 42], electromagnetically induced grating [43, 44], all-optical switching [45], optical solutions [46, 47], Goos–Hänchen shift [48, 49], and four-wave mixing (FWM) [50–52]. Recently, the transfer and modulation of mid-infrared optical vortices have been realized via the high-efficient FWM process in SQWs [53–55]. Thus, it reminds us of one question: Can we realize the TC measurement of a mid-infrared vortex beam in a SQW system?
To answer this question, a scheme is proposed in this article for measuring the TC of a mid-infrared vortex beam via observing the intensity distribution of the generated FWM field in an asymmetric semiconductor double quantum well (SDQW). In this SDQW, Fano-type interference exists, which arises from the absorption paths of two states coupled to an electronic continuum [52, 56, 57]. Different from previous studies, the distinguishing features of this scheme are given as follows: First and foremost, with the help of the Fano-type interference, the special inherent interference leads to the interference-type phase and intensity patterns for the generated FWM field. This is a significant advantage of our proposed scheme compared with Refs. [53, 54]. Second, by adjusting the intensity and detuning of the control field, the interference-type intensity pattern of the FWM field can be drastically manipulated. In particular, by an appropriate choice of the intensity Ωc and detuning Δc, a high-visibility interference-type pattern accompanied by an appropriate intensity can be achieved. Third, by monitoring the number of light spots of the FWM field, the measurable TC value can reach up to 120 in our scheme, which is a great improvement compared with previous schemes [38, 58].
2 Models and Equations
As shown in Figure 1A, we consider an asymmetric SDQW with four-subband configurations, which can be grown by molecular-beam epitaxy [56]. In this designed SDQW, an 8.3-nm thick Al0.07Ga0.93As layer and a 6.9-nm GaAs layer are separated by an Al0.32Ga0.68As potential barrier with the thickness of 4.75 nm. On the right side of the right well is a thin barrier with a thickness of 3.8 nm, which is followed by a thick Al0.16Ga0.84As layer [52, 59, 60]. The eigenenergies and wave functions for the four conduction subbands can be obtained by solving the effective mass Schrödinger equation [61]. In the proposed SDQW, the eigenenergies of the four subbands |1⟩, |2⟩, |3⟩, and |4⟩ are ω1 = 51.53 meV, ω2 = 97.78 meV, ω3 = 191.3 meV, and ω4 = 233.23 meV, respectively [52]. Owing to the existence of resonant tunneling, the two closely spaced delocalized subbands |3⟩ and |4⟩ can be represented by a coherent superposition of the first excited subband in the shallow well |se⟩ and deep well |de⟩, that is,
where r and ϕ are the radial radius and azimuthal angle, respectively. Ωd0 and w0 represent the initial Rabi frequency and beam waist, respectively. The radial index and TC are labeled by p and l, respectively. Here,
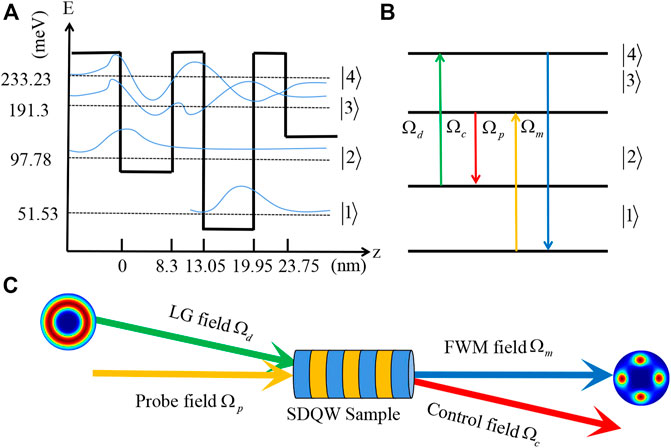
FIGURE 1. (A) Schematic energy-band diagram of a single period of the asymmetric SDQW. (B) The corresponding energy-level arrangement. (C) Geometry of the four applied fields. In the FWM process, control field Ωc, vortex driving field Ωd, and probe field Ωp interact with the SDQW and generate FWM field Ωm under the phase-matching condition
It can be seen from Eqs 1, 2 that the Laguerre polynomial
where Δp = (ω3 − ω1) − ωp, Δc = (ω3 − ω2) − ωc, and Δd = (ω4 − ω2) − ωd are the probe field, control field, and vortex field detunings, respectively.
where Aj (j = 1, 2, 3, 4) stands for the time-dependent probability amplitude for finding particles in the corresponding subband. Substituting Eqs 3, 4 into the Schrödinger equation
in which
where
where ω is the Fourier transform variable.
In the limit of weak probe and FWM fields, most electrons remain in the ground subband |1⟩, that is, |A1|2 ≈ 1. Therefore, we can obtain
By analytically solving Eqs 13–15, one can obtain aj (j = 2, 3, and 4) as
where
Considering the initial conditions for the pulse probe and FWM fields, that is, Λp (0, ω) ≠ 0, and Λm (0, ω) = 0, we obtain the analytical solution of the FWM field as follows:
where
with
where the group velocities Vg± are determined by
where Vg = Vg− and K = K−(0). By using
where the intensity of the FWM field is
3 Results and Discussions
We first explore the influence of the Fano-type interference on the phase and intensity distribution of the generated FWM field in Figure 2. Here, the mode of the vortex driving field Ωd is
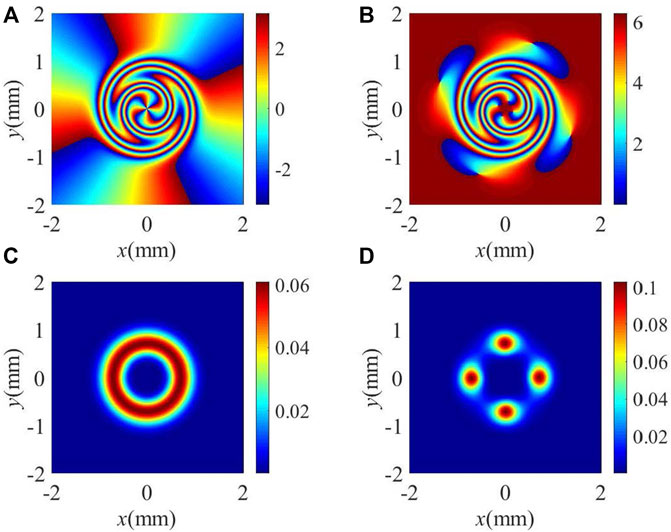
FIGURE 2. (A,B) Phase and (C,D) intensity patterns of the FWM field without and with including electronic continuum, (A,C) without including electronic continuum: γ3l = γ4l = 1 meV and p = 0, (B,D) with including electronic continuum: γ3l = 1.58 meV and γ4l = 1.50 meV and p = 0.83. Other parameters used are γ2 = 2.36 × 10–−6 μeV, γ3d = 0.32 meV, γ4d = 0.30 meV, |Ωc| = 25 meV, |Ωd0| = 30 meV, Δc = 5 meV, Δp = Δd = 0, and κm = κp = 9.6 × 103μm−1meV, l = 4, p = 0, w0 = 500 μm, and L = 1 μm.
In order to have a deeper understanding for the effect of the Fano-type interference, we plot the spatial distribution of the real and imaginary parts of the dispersion relation K in Figure 3. Note that the phase shift Re(K) per unit length determines the phase wavefront distribution of the FWM field, while the absorption coefficient Im(K) determines the distribution of the intensity [55]. Without the Fano-type interference, the phase shift Re(K) per unit length displays an inverted crater-like pattern with a radius r = 0.71 mm and leads to the helical phase twisting in the anticlockwise direction (Figure 3A). Meanwhile, the absorption coefficient Im(K) also exhibits an inverted crater-like pattern at r = 0.71mm, where the low absorption ring results in the appearance of an intensity ring (Figure 3C). With the Fano-type interference, the inverted crater-like pattern of Re(K) also makes the phase twist in the anticlockwise direction (Figure 3B), while the existence of four independent low-absorption regions along the angular direction leads to a discrete intensity distribution with four light spots (Figure 3D).
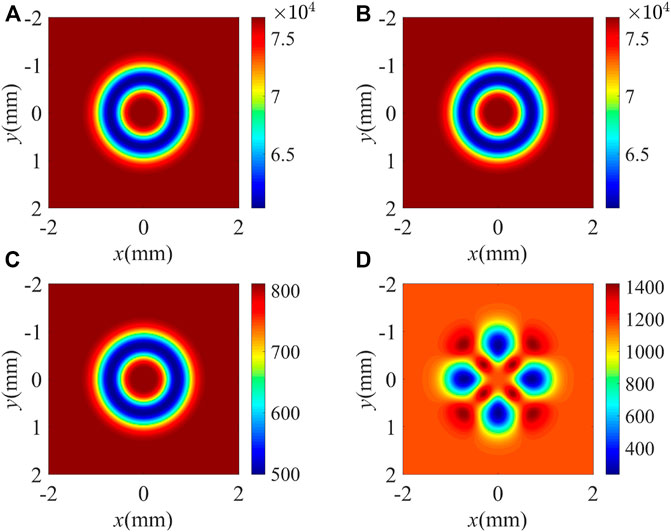
FIGURE 3. (A,B) Real and (C,D) imaginary parts of the dispersion relation K. (A,C) without including electronic continuum: γ3l = γ4l = 1 meV and p = 0; (B,D) with including electronic continuum: γ3l = 1.58 meV and γ4l = 1.50 meV and p = 0.83. Other parameters are the same as in Figure 2.
A previous study [36] has demonstrated that the number of light spots in the interference spectrum is determined by the TC of the involved optical vortex. Therefore, the inherent interference mechanism in the proposed SDQW allows us to measure the TC of the vortex driving field via directly monitoring the number of light spots of the FWM field. It is worth noting that the precision of the TC measurement would be limited by the intensity and visibility of the inherent interference. To achieve a high-quality interference-type pattern, we explore the influence of the intensity and detuning of the control field based on Eq. 26. Figures 4A–C show the intensity patterns of the FWM field for different values of the control intensity Ωc. When Ωc = 10 meV, the FWM field shows a clear four petal-like intensity pattern, but the intensities of the four light spots are very small (Figure 4A). As we adjust Ωc to 25 meV and then to 40meV, as shown in Figures 4B,C, the intensity of the FWM field becomes more and more stronger, while the visibility of the light spots becomes more and more worse. In order to evaluate the quality of the interference-type intensity pattern, we defined interference visibility η as [63].
where Imax and Imin represent the maximal and minimal light intensities along the angular direction in the interference-type intensity pattern of the FWM field, respectively. We can set
where Δα = αmax − αmin stands for the difference between the maximal and minimal absorption coefficients. It can be seen that Δα determines the interference visibility of the output FWM field. Saying concretely, the increase (decrease) of Δα would lead to the increase (decrease) of interference visibility η. Here, the absorption coefficient difference Δα and interference visibility η versus the azimuthal angle ϕ at radius r = 0.71 mm are plotted in Figure 4D. It is found that Δα decreases from 32,720.0 μm−1 to 350.6 μm−1 when Ωc increases from 10 to 40 meV. Thus, interference visibility η shows a decreasing trend. It is worth noting that η is almost kept to 1 for 10 meV
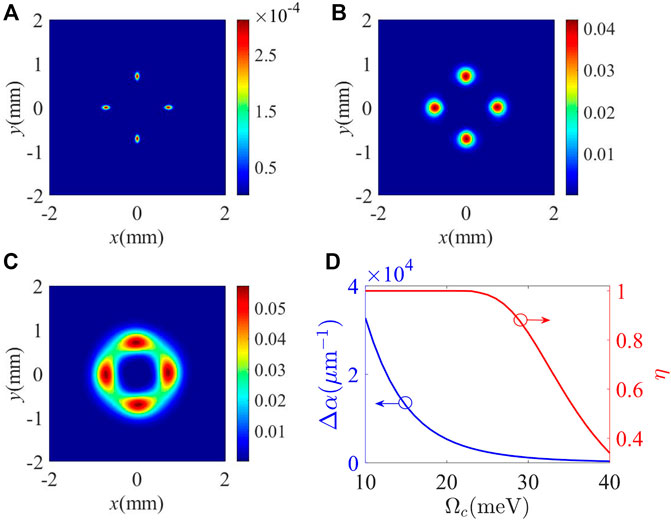
FIGURE 4. (A–C) Intensity patterns of the FWM field for different intensities of the control field. (A) Ωc = 10 meV, (B) Ωc = 25 meV, and (C) Ωc = 40 meV. (D) Absorption coefficient difference Δα and interference visibility η as a function of intensity Ωc of the control field. Other parameters are the same as in Figure 2B except for Δc = 8 meV.
We also investigate the influence of control detuning Δc on the intensity pattern of the FWM field in Figures 5A–C. It can be seen that the intensity of the FWM field decreases monotonically as Δc increases from 2 to 14 meV (Figures 5A–C). Different from the results shown in Figure 4, Δα increases from 735.8 μm−1 to 42,871 μ m−1 as Δc increases from 2 to 14 meV (Figure 5D). In this sense, interference visibility η increases from 0.63 to 1. As Δc exceeds 5.2 meV, the value of Δα is extremely high so that interference visibility η ≈ 1. According to the aforementioned discussions, one can conclude that the intensity and detuning of the control field play different roles in modifying the intensity and visibility of the interference-type pattern. Therefore, a high-visibility interference-type pattern accompanied by an appropriate intensity can be achieved via choosing the suitable values of the intensity and detuning of the control field.
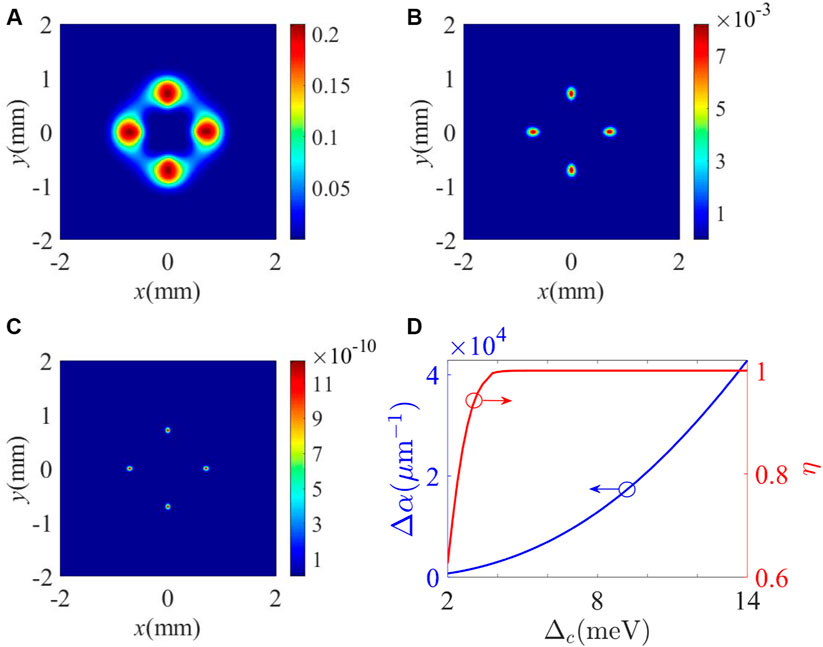
FIGURE 5. (A–C) Intensity patterns of the FWM field for different detunings of the control field. (A) Δc = 2 meV, (B) Δc = 8 meV, (C) and Δc = 14 meV. (D) Absorption coefficient difference Δα and interference visibility η as a function of detuning Δc of the control field. Other parameters are the same as in Figure 2B except for Ωc = 15 meV.
Based on the aforementioned discussions, we perform the TC measurement of the vortex driving field via monitoring the number of light spots in the intensity pattern of the generated FWM field. The intensity patterns of the FWM field for different TCs of the vortex driving field are displayed in Figure 6, and the corresponding curves for absorption coefficient difference Δα and interference visibility η are shown in Figure 7. It is worth noting that the waist radius of the vortex driving field is always kept to 500 μm for the selected TCs. In the measurement of the low-order TC (i.e., l ≤ 10), Ωc = 25 meV and Δc = 8 meV are selected. We can clearly observe two, four, and six light spots in the intensity patterns of the FWM field when l = 2, 4, and 6 (Figures 6A–C). As shown in Figure 7A, Δα increases from 2,263.6 μm−1 to 2,436.1 μm−1 as l increases from 2 to 6. Therefore, interference visibility η would increase from 0.9786 to 0.9848 for the low-order TC case. Although the overall output intensity decreases in some degree due to the dependence of the Laguerre polynomial on the TC, the visibility of the interference-type pattern always exceeds 0.97. That is to say, we can realize a high-precision measurement for the low-order TC of a mid-infrared optical vortex. In the measurement of the high-order TC, Ωc = 13 meV and Δc = 2 meV are chosen. When l = 100, 110, and 120, the same number of light spots can be observed in the interference-type pattern of the FWM field (Figures 6D–F). The overall output intensity of the FWM field only decreases slightly with the increase of l from 100 to 120. Δα first slightly increases from 2,126.7 μm−1 to 2,127.1 μm−1 as l increases from 100 to 105 and then decreases to 2,125.6 μm−1 as l increases to 120 (see the blue line in Figure 7B). Therefore, interference visibility η would slightly increase from 0.97197 to 0.97207 and then decrease to 0.97191 with the increase of l from 100 to 120 (see the red line in Figure 7B). The change of Δα is so small that interference visibility η is kept at the level of 0.9719. Therefore, our scheme is suitable for measuring both the low-order and high-order TC. More importantly, the measurable TC value is greatly improved compared with previous schemes [38, 58].
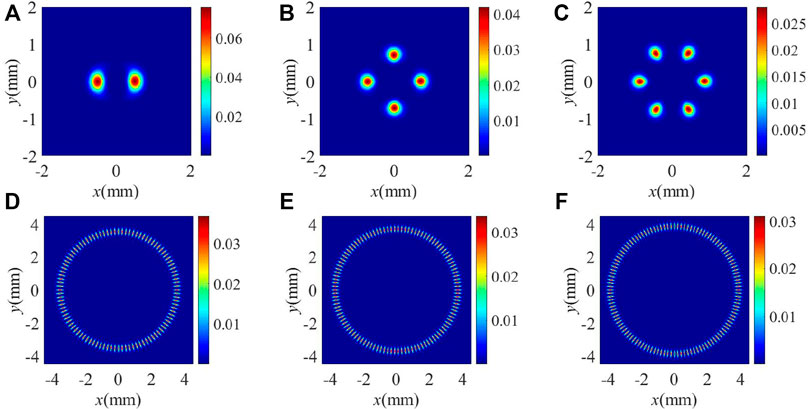
FIGURE 6. (A–F) Intensity patterns of the FWM field for different TCs of the vortex driving field. (A) l = 2, (B) l = 4, (C) l = 6, (D) l = 100, (E) l = 110, and (F) l = 120. Ωc = 25 meV and Δc = 8 meV for (A–C) and Ωc = 13 meV and Δc = 2 meV for (D–F). Other parameters are the same as in Figure 2B.
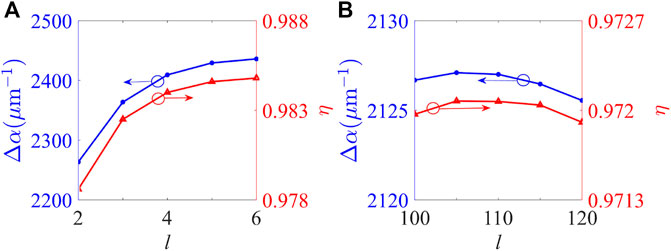
FIGURE 7. Absorption coefficient difference Δα and interference visibility η corresponding to (A) the low-order TCs and (B) high-order TCs. Other parameters are the same as in Figure 6.
Before concluding, we explore the influence of the TC of the vortex driving field on the conversion efficiency of FWM. FWM efficiency ρ is defined as
where
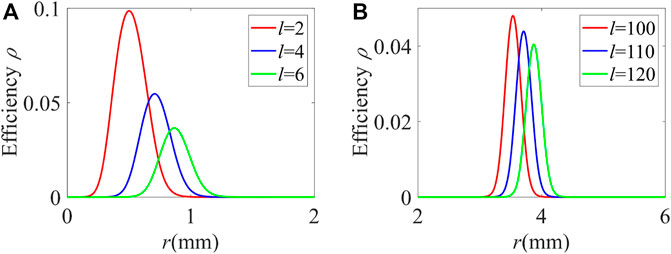
FIGURE 8. FWM efficiency ρ versus radius r for different values of the TCs. (A) and (B) correspond to the cases of low-order TCs and high-order TCs, respectively. Other parameters are the same as in Figure 6.
4 Conclusion
In conclusion, we have theoretically suggested a scheme to measure the TC of a mid-infrared vortex beam via observing the intensity distribution of the FWM field in an asymmetric SDQW with a four-subband configuration. In this SDQW, the effect of the Fano-type interference exists because the absorption paths of two states are coupled to an electronic continuum [56, 57]. With the help of the Fano-type interference, the cross coupling term acting as a plane wave makes inherent interference with the vortex beam and generates the interference-type patterns for the phase and intensity of the FWM field. It is demonstrated that a high-contrast interference-type pattern accompanied by appropriate intensity can be achieved via adjusting the intensity and detuning the control field. Furthermore, the TC measurement of the vortex beam is performed by monitoring the number of light spots of the FWM field. By properly choosing the parameters of the system, the detectable TC value can reach to 120, which is greatly improved compared with previous schemes [38, 58].
Mid-infrared optical vortices can open up new avenues toward super-resolution microscopy of arbitrarily oriented single molecules [68], fabrication of three-dimensional chiral microstructures [69], and OAM-multiplexing-based free-space optical communication [70]. Our scheme may provide the possibility for the realization of mid-infrared OAM detectors in a compact solid-state system.
Data Availability Statement
The original contributions presented in the study are included in the article/Supplementary Material; further inquiries can be directed to the corresponding authors.
Author Contributions
The idea was first conceived by W-XY. YS was responsible for the physical model, numerical calculations, and writing most of the manuscript. DH derived and discussed the efficiency of FWM. LL and TS contributed to writing the manuscript and verified the calculated results.
Funding
This study was funded by the National Natural Science Foundation of China (11774054, 12075036, and 12104067), the Science and Technology Research Project of Education Department of Hubei Province (Q20211314), and College Students’ Innovation and Entrepreneurship Training Project of Yangtze University (Yz2020314).
Conflict of Interest
The authors declare that the research was conducted in the absence of any commercial or financial relationships that could be construed as a potential conflict of interest.
Publisher’s Note
All claims expressed in this article are solely those of the authors and do not necessarily represent those of their affiliated organizations, or those of the publisher, the editors, and the reviewers. Any product that may be evaluated in this article, or claim that may be made by its manufacturer, is not guaranteed or endorsed by the publisher.
Acknowledgments
YS thanks Chun Meng, Xu Deng, and Tong Zhang for helpful discussions.
References
1. Allen L, Beijersbergen MW, Spreeuw RJC, Woerdman JP. Orbital Angular Momentum of Light and the Transformation of Laguerre-Gaussian Laser Modes. Phys Rev A (1992) 45(11):8185–9. doi:10.1103/physreva.45.8185
2. Padgett M, Courtial J, Allen L. Light's Orbital Angular Momentum. Phys Today (2004) 57(5):35–40. doi:10.1063/1.1768672
3. Brasselet E. Tunable High-Resolution Macroscopic Self-Engineered Geometric Phase Optical Elements. Phys Rev Lett (2018) 121(3):033901. doi:10.1103/PhysRevLett.121.033901
4. Chen S, Cai Y, Li G, Zhang S, Cheah KW. Geometric Metasurface fork Gratings for Vortex-Beam Generation and Manipulation. Laser Photon Rev (2016) 10(2):322–6. doi:10.1002/lpor.201500259
5. Zhang Y, Gao J, Yang X. Topological Charge Inversion of Optical Vortex with Geometric Metasurfaces. Adv Opt Mater (2019) 7(8):1801486. doi:10.1002/adom.201801486
6. Chen P, Ge S, Ma L, Hu W, Chigrinov V, Lu Y. Generation of Equal-Energy Orbital Angular Momentum Beams via Photopatterned Liquid Crystals. Phys Rev A (2016) 5(4):044009. doi:10.1103/physrevapplied.5.044009
7. Hong Y, Wang Z, Ding D, Yu B. Ultraslow Vortex Four-Wave Mixing via Multiphoton Quantum Interference. Opt Express (2019) 27(21):29863–74. doi:10.1364/oe.27.029863
8. Qiu J, Wang Z, Ding D, Huang Z, Yu B. Control of Space-dependent Four-Wave Mixing in a Four-Level Atomic System. Phys Rev A (2020) 102(3):033516. doi:10.1103/physreva.102.033516
9. Hamedi HR, Kudriašov V, Ruseckas J, Juzeliūnas G. Azimuthal Modulation of Electromagnetically Induced Transparency Using Structured Light. Opt Express (2018) 26(22):28249–62. doi:10.1364/oe.26.028249
10. Hamedi HR, Ruseckas J, Paspalakis E, Juzeliunas G. Transfer of Optical Vortices in Coherently Prepared media. Phys Rev A (2019) 99(3):033812. doi:10.1103/physreva.99.033812
11. Asadpour SH, Ziauddin , Abbas M, Hamedi HR. Exchange of Orbital Angular Momentum of Light via Noise-Induced Coherence. Phys Rev A (2022) 105:033709. doi:10.1103/PhysRevA.105.033709
12. Mahdavi M, Sabegh ZA, Mohammadi M, Hamedi HR, Mahmoudi. M. Manipulation and Exchange of Light with Orbital Angular Momentum in Quantum Dot Molecules. Phys Rev A (2020) 101(6):063811. doi:10.1103/physreva.101.063811
13. Rahmatullah M, Abbas Z, Qamar S. Spatially Structured Transparency and Transfer of Optical Vortices via Four-Wave Mixing in a Quantum-Dot Nanostructure. Phys Rev A (2020) 101(2):023821. doi:10.1103/physreva.101.023821
14. Mahdavi M, Sabegh ZA, Hamedi HR, Mahmoudi M. Orbital Angular Momentum Transfer in Molecular Magnets. Phys Rev B (2021) 104:094432. doi:10.1103/PhysRevB.104.094432
15. Ding C, Li J, Dai X, Jin R-B, Hao X. Azimuthal and Radial Modulation of Double-Four-Wave Mixing in a Coherently Driven Graphene Ensemble. Opt Express (2021) 29(22):36840–56. doi:10.1364/oe.440690
16. Padgett M, Bowman R. Tweezers with a Twist. Nat Photon (2011) 5(6):343–8. doi:10.1038/nphoton.2011.81
17. Gecevičius M, Drevinskas R, Beresna M, Kazansky PG. Single Beam Optical Vortex Tweezers with Tunable Orbital Angular Momentum. Appl Phys Lett (2014) 104(23):231110.
18. Wang J, Yang JY, Fazal IM, Ahmed N, Yan Y, Huang H, et al. Terabit Free-Space Data Transmission Employing Orbital Angular Momentum Multiplexing. Nat Photon (2012) 6(7):488–96. doi:10.1038/nphoton.2012.138
19. Bozinovic N, Yue Y, Ren Y, Tur M, Kristensen P, Huang H, et al. Terabit-scale Orbital Angular Momentum Mode Division Multiplexing in Fibers. Science (2013) 340(6140):1545–8. doi:10.1126/science.1237861
20. Wang J, Liu K, Cheng Y, Wang H. Three-dimensional Target Imaging Based on Vortex Stripmap Sar. IEEE Sens J (2019) 19(4):1338–45. doi:10.1109/jsen.2018.2879814
21. Yuan T, Wang H, Cheng Y, Qin Y. Electromagnetic Vortex-Based Radar Imaging Using a Single Receiving Antenna: Theory and Experimental Results. Sensors (2017) 17(3):630. doi:10.3390/s17030630
22. Pan X, Yu S, Zhou Y, Zhang K, Zhang K, Lv S, et al. Orbital-angular-momentum Multiplexed Continuous-Variable Entanglement from Four-Wave Mixing in Hot Atomic Vapor. Phys Rev Lett (2019) 123(7):070506. doi:10.1103/PhysRevLett.123.070506
23. Li S, Pan X, Ren Y, Liu H, Yu S, Jing J. Deterministic Generation of Orbital-Angular-Momentum Multiplexed Tripartite Entanglement. Phys Rev Lett (2020) 124(8):083605. doi:10.1103/PhysRevLett.124.083605
24. Liu S, Lou Y, Jing J. Orbital Angular Momentum Multiplexed Deterministic All-Optical Quantum Teleportation. Nat Commun (2020) 11(1):3875. doi:10.1038/s41467-020-17616-4
25. Chen Y, Liu S, Lou Y, Jing J. Orbital Angular Momentum Multiplexed Quantum Dense Coding. Phys Rev Lett (2021) 127(9):093601. doi:10.1103/PhysRevLett.127.093601
26. Franke Arnold S, Allen L, Padgett M. Advances in Optical Angular Momentum. Laser Photon Rev (2008) 2(4):299–313. doi:10.1002/lpor.200810007
27. Beijersbergen MW, Woerdman JP. Measuring Orbital Angular Momentum of Light with a Torsion Pendulum. Proc SPIE (2005) 5736:111–25. doi:10.1117/12.584515
28. Volke-Sepúlveda K, Santillán AO, Boullosa RR. Transfer of Angular Momentum to Matter from Acoustical Vortices in Free Space. Phys Rev Lett (2008) 100(2):24302.
29. Vasnetsov MV, Torres JP, Petrov DV, Torner L. Observation of the Orbital Angular Momentum Spectrum of a Light Beam. Opt Lett (2003) 28(23):2285–7. doi:10.1364/ol.28.002285
30. Hickmann JM, S Fonseca EJ, Soares WC, Chávez-Cerda S. Unveiling a Truncated Optical Lattice Associated with a Triangular Aperture Using Light’s Orbital Angular Momentum. Phys Rev Lett (2010) 105(5):053904. doi:10.1103/PhysRevLett.105.053904
31. Silva JG, Jesus-Silva AJ, Alencar MARC, Hickmann JM, Fonseca EJS. Unveiling Square and Triangular Optical Lattices: a Comparative Study. Opt Lett (2014) 39(4):949–52. doi:10.1364/ol.39.000949
32. Moreno I, Davis JA, Pascoguin BML, Mitry MJ, Cottrell DM. Vortex Sensing Diffraction Gratings. Opt Lett (2009) 34(19):2927–9. doi:10.1364/ol.34.002927
33. Dai K, Gao C, Zhong L, Na Q, Wang Q. Measuring Oam States of Light Beams with Gradually-Changing-Period Gratings. Opt Lett (2015) 40(4):562–5. doi:10.1364/ol.40.000562
34. Heckenberg NR, McDuff R, Smith CP, White AG. Generation of Optical Phase Singularities by Computer-Generated Holograms. Opt Lett (1992) 17(3):221–3. doi:10.1364/ol.17.000221
35. Vickers J, Burch M, Vyas R, Singh S. Phase and Interference Properties of Optical Vortex Beams. J Opt Soc Am A (2008) 25(3):823–7. doi:10.1364/josaa.25.000823
36. Huang H, Ren Y, Yan Y, Ahmed N, Yue Y, Bozovich A, et al. Phase-shift Interference-Based Wavefront Characterization for Orbital Angular Momentum Modes. Opt Lett (2013) 38(13):2348–50. doi:10.1364/ol.38.002348
37. Sztul HI, Alfano RR. Double-slit Interference with Laguerre-Gaussian Beams. Opt Lett (2006) 31(7):999–1001. doi:10.1364/ol.31.000999
38. Emile O, Emile J. Young’s Double-Slit Interference Pattern from a Twisted Beam. Appl Phys B (2014) 117(1):487–91. doi:10.1007/s00340-014-5859-1
39. Leach J, Miles JP, Stephen MB, Franke-Arnold S, Courtial J. Measuring the Orbital Angular Momentum of a Single Photon. Phys Rev Lett (2002) 88(25):257901. doi:10.1103/physrevlett.88.257901
40. Gao C, Qi X, Liu Y, Xin J, Wang L. Sorting and Detecting Orbital Angular Momentum States by Using a Dove Prism Embedded Mach–Zehnder Interferometer and Amplitude Gratings. Opt Commun (2011) 284(1):48–51. doi:10.1016/j.optcom.2010.08.083
41. Phillips M, Wang H. Spin Coherence and Electromagnetically Induced Transparency via Exciton Correlations. Phys Rev Lett (2002) 89(18):186401. doi:10.1103/physrevlett.89.186401
42. Ku P-C, Sedgwick F, Chang-Hasnain CJ, Palinginis P, Li T, Wang H, et al. Slow Light in Semiconductor Quantum wells. Opt Lett (2004) 29(19):2291–3. doi:10.1364/ol.29.002291
43. Zhou F, Qi Y, Sun H, Chen D, Yang J, Niu Y, et al. Electromagnetically Induced Grating in Asymmetric Quantum wells via Fano Interference. Opt Express (2013) 21(10):12249–59. doi:10.1364/oe.21.012249
44. Tian SC, Wan RG, Wang LJ, Shu SL, Lu HY, Zhang X, et al. Asymmetric Light Diffraction of Two-Dimensional Electromagnetically Induced Grating with PT Symmetry in Asymmetric Double Quantum wells. Opt Express (2018) 26(25):32918–30. doi:10.1364/oe.26.032918
45. Wu JH, Gao JY, Xu JH, Silvestri L, Artoni M, Rocca GCL, et al. Ultrafast All Optical Switching via Tunable Fano Interference. Phys Rev Lett (2005) 95(5):057401. doi:10.1103/PhysRevLett.95.057401
46. Yang WX, Hou JM, Lee RK. Ultraslow Bright and Dark Solitons in Semiconductor Quantum wells. Phys Rev A (2008) 77(3):033838. doi:10.1103/physreva.77.033838
47. Zhu C, Huang G. Slow-light Solitons in Coupled Asymmetric Quantum wells via Interband Transitions. Phys Rev B (2009) 80(23):235408. doi:10.1103/physrevb.80.235408
48. Yang WX, Liu S, Zhu Z, Ziauddin , Lee RK. Tunneling-induced Giant Goos-Hänchen Shift in Quantum wells. Opt Lett (2015) 40(13):3133–6. doi:10.1364/ol.40.003133
49. Asadpour SH, Nasehi R, Soleimani HR, Mahmoudi M. Phase Control of Goos–Hänchen Shift via Biexciton Coherence in a Multiple Quantum Well. Superlattices and Microstructures (2015) 85:112–23. doi:10.1016/j.spmi.2015.05.019
50. Sun H, Fan S, Zhang H, Gong S. Tunneling-induced High-Efficiency Four-Wave Mixing in Asymmetric Quantum wells. Phys Rev B (2013) 87(23):235310. doi:10.1103/physrevb.87.235310
51. Meng L-C, Zhang W-J, Liu J, Xie X-T. A Dimer PT -symmetric Model Simulated in GaAs/AlGaAs Quantum wells. Epl (2016) 114(3):34001. doi:10.1209/0295-5075/114/34001
52. Liu S, Yang W-X, Chuang Y-L, Chen A-X, Liu A, Huang Y, et al. Enhanced Four-Wave Mixing Efficiency in Four-Subband Semiconductor Quantum wells via Fano-type Interference. Opt Express (2014) 22(23):29179–90. doi:10.1364/oe.22.029179
53. Zhang Y, Wang Z, Qiu J, Hong Y, Yu B. Spatially Dependent Four-Wave Mixing in Semiconductor Quantum wells. Appl Phys Lett (2019) 115(17):171905. doi:10.1063/1.5121275
54. Qiu J, Wang Z, Ding D, Li W, Yu B. Highly Efficient Vortex Four-Wave Mixing in Asymmetric Semiconductor Quantum wells. Opt Express (2020) 28(3):2975–86. doi:10.1364/oe.379245
55. Wang Z, Zhang Y, Paspalakis E, Yu B. Efficient Spatiotemporal-Vortex Four-Wave Mixing in a Semiconductor Nanostructure. Phys Rev A (2020) 102(6):063509. doi:10.1103/physreva.102.063509
56. Schmidt H, Campman KL, Gossard AC, Imamolu A. Tunneling Induced Transparency: Fano Interference in Intersubband Transitions. Appl Phys Lett (1997) 70(25):3455. doi:10.1063/1.119199
57. Faist J, Capasso F, Sirtori C, Pfeiffer L. Controlling the Sign of Quantum Interference by Tunnelling from Quantum wells. Nature (1997) 390(6660):589–91. doi:10.1038/37562
58. Peng JX, Chen Z, Yuan QZ, Feng XL. Optomechanically Induced Transparency in a Laguerre-Gaussian Rotational-Cavity System and its Application to the Detection of Orbital Angular Momentum of Light fields. Phys Rev A (2019) 99(4):043817. doi:10.1103/physreva.99.043817
59. Qi Y, Niu Y, Xiang Y, Wang H, Gong S. Phase Dependence of Cross-phase Modulation in Asymmetric Quantum wells. Opt Commun (2011) 284(1):276–81. doi:10.1016/j.optcom.2010.09.016
60. Faist J, Sirtori C, Capasso F, Chu S-NG, Pfeiffer LN, West KW. Tunable Fano Interference in Intersubband Absorption. Opt Lett (1996) 21(13):985–7. doi:10.1364/ol.21.000985
61. Carlo S, Federico C, Sivco DL, Cho AY. Giant, Triply Resonant, Third-Order Nonlinear Susceptibility
62. Shih T, Reimann K, Woerner M, Elsaesser T, Waldmüller I, Knorr A, et al. Nonlinear Response of Radiatively Coupled Intersubband Transitions of Quasi-Two-Dimensional Electrons. Phys Rev B (2005) 72(19):195338. doi:10.1103/physrevb.72.195338
64. Liu H, Capasso F. Intersubband Transitions in Quantum wells: Physics and Device Applications. Amsterdam, Netherlands: Elsevier (1999).
65. Wu Y, Yang X. Highly Efficient Four-Wave Mixing in Double-Λ System in Ultraslow Propagation Regime. Phys Rev A (2004) 70(5):053818. doi:10.1103/physreva.70.053818
66. Li L, Chang C, Yuan X, Yuan C, Feng S, Nie S, et al. Generation of Optical Vortex Array along Arbitrary Curvilinear Arrangement. Opt Express (2018) 26(8):9798–812. doi:10.1364/oe.26.009798
67. Ma H, Li X, Tai Y, Li H, Wang J, Tang M, et al. Generation of Circular Optical Vortex Array. Annalen der Physik (2017) 529(12):1700285. doi:10.1002/andp.201700285
68. Boichenko S. Toward Super-resolution Fluorescent Microscopy of Arbitrarily Oriented Single Molecules. Phys Rev A (2020) 101(4):043823. doi:10.1103/physreva.101.043823
69. Ni J, Wang C, Zhang C, Hu Y, Yang L, Lao Z, et al. Three-dimensional Chiral Microstructures Fabricated by Structured Optical Vortices in Isotropic Material. Light Sci Appl (2017) 6(7):e17011. doi:10.1038/lsa.2017.11
Keywords: topological charge, optical vortex, semiconductor quantum well, Fano-type interference, four-wave mixing
Citation: Song Y, Li L, Shui T, Hu D and Yang W-X (2022) Topological Charge Measurement of the Mid-Infrared Vortex Beam via Spatially Dependent Four-Wave Mixing in an Asymmetric Semiconductor Double Quantum Well. Front. Phys. 10:907284. doi: 10.3389/fphy.2022.907284
Received: 29 March 2022; Accepted: 17 May 2022;
Published: 04 July 2022.
Edited by:
Guangling Cheng, East China Jiaotong University, ChinaCopyright © 2022 Song, Li, Shui, Hu and Yang. This is an open-access article distributed under the terms of the Creative Commons Attribution License (CC BY). The use, distribution or reproduction in other forums is permitted, provided the original author(s) and the copyright owner(s) are credited and that the original publication in this journal is cited, in accordance with accepted academic practice. No use, distribution or reproduction is permitted which does not comply with these terms.
*Correspondence: Ling Li, bGlsaW5nbGluZzUwNEAxMjYuY29t; Tao Shui, YWh1c2h1aXRhb0AxMjYuY29t; Wen-Xing Yang, d2VueGluZ3lhbmcyQDEyNi5jb20=
 Yi Song
 Ling Li
 Tao Shui
 Die Hu
 Wen-Xing Yang