- 1School of Economics and Management, Sichuan Normal University, Chengdu, China
- 2Sichuan Academy of Social Sciences, Chengdu, China
- 3College of International Studies, Sichuan University, Chengdu, China
- 4Law School, Southwestern University of Finance and Economics, Chengdu, China
The financial risk spreads widely on the financial network and the risk information diffuses broadly on the social networks. How the information diffusion affects the financial risk spreading still lacks mathematical study. This paper proposes a model to describe the coevolution of financial information diffusion and financial risk spreading on a two-layered network. We use a mean-field approach to describe the spreading dynamics and adopt extensive numerical simulations to simulate the dynamics. We find that financial information diffusion can suppress the financial risk generally. Notably, there exists an optimal information diffusion probability at which the financial risk is greatly suppressed. Our results may shed some light on controlling the financial risk spreading dynamics.
1 Introduction
Financial risk can spread in the financial networks, in which the nodes represent the financial institutions (e.g., banks) and edges stand for the loan relationships among that those financial institutions [1–4]. Generally, some poorly run enterprises may trigger a financial risk since they can not repay debts. As a result, those bad debts may result in their creditors being not ableunable to repay their debts, thus triggering cascading failures, and a global financial risk may arise. Investigating the financial risk spreading mechanisms and contagion models attracts the researchers from the field of network science and management science [5–8].
By using cascading failure or contagion models, extensive research revealed that the financial network topology markedly affects the spreading of financial risk [9–14]. Gai and Kapadia [15] investigated the financial risk spreading on the weighted directed network and revealed that the few hubs make the financial systems exhibit a robust-yet-fragile character. They used a generalized percolation theory to study the critical threshold point. Inspired by the phenomena in the field of epidemiology, Garas et al. [16] used the susceptible-infected-recovered (SIR) model and studiedy the probability of triggering the global crisis for different initial conditions. Huang et al. [17] investigated the financial risk spreading on the bipartite banking network and accurately predicted the failed banks with the natural failed banks after 2007.
The CEO (Chief Executive Officer) of the a financial institution will take measures to protect his/hertheir company from being infected based on his/her their risk perception. A CEO can percept the financial risk information from his/her CEO friends on the social network their CEO associates on social networks. How does that perceived information affect the financial risk spreading? To our best knowledge, there still lacks a systematical theoretical study on this is still lacking. Lin and Duan [18] revealed that the financial information spread dynamics depend on the topologies of the social network. To build a mathematical model to investigate the above stated problem, we will propose a coevolution spreading dynamics, which is inspired by information-epidemic coevolution spreading [19–25]. Granell et al. [21] used an unaware-aware-unaware–susceptible-infected-susceptible (UAU–SIS) model to study the effects of information diffusion on the epidemic spreading. They found that the epidemic spread size is greatly suppressed for large information diffusion probability.
The motivations of this paper have two aspectsare two-fold. On the one hand, the effects of the financial risk information diffusion on the financial risk spreading still are still lacking. On the other hand, the effects of heterogeneous CEO’s risk perception on the financial risk spreading need further investigation. In this paper, we will propose a mathematical model on two-layered networks to study the financial risk spreading, in which the financial risk spreading on the financial networks and the risk information diffuse diffusion on the CEOs social network are used. Different CEOs have different attitudes when receiving financial risk information, and we thus divide the CEOs into two types: risk aversion and risk patience. Therefore, the population is heterogeneous. Previous studies indicated that a heterogeneous population induces distinct spreading phenomena [26–28], such as the emergence of hybrid transition. Then we use a mean-field approach to describe the spreading dynamics and study the density of how each state evolves versus time. We find that the risk information spreading among CEOs can suppress the financial risk spreading through extensive numerical simulations. There is optimal information spreading probability at which the financial risk will be greatly suppressed. Finally, we find that the average degree of the two layers does not qualitatively affect the phenomena qualitatively.
The organizations of this paper are as follows This paper is organized as follows. In Section 2, we describe the spreading dynamics. In Section 3, we present the theory and numerical results. Finally, we make conclusions in Section 4.
2 Model Descriptions
In this section, we propose a systemic risk spreading model on a two-layered network (or multiplex networks [29–33]). We denote the two layers as A and B, respectively. We use layer B to denote the topology among banks. The nodes stand for financial institutions (e.g., banks), and the edge represents financial relationships (e.g., lending). Assuming there are N nodes in network B,. fFor layer A, we use it to describe the interactions among the CEOs of among the financial institutions. For each financial institution, there is only one CEO. Therefore, the nodes in two layers are matched one-to-one. An interlayer edge
We use an uncorrelated configuration model to describe the financial risk spreading dynamics on the two-layer networks by using a given degree distribution pA (kA) and pB (kB) for layers A and B, respectively. The average degree of layer A is
We simulate the financial risk spreading dynamics on the two-layer networks by using interacting spreading dynamics. The financial risk spreading on layer B follows a susceptible-infected-recovered-vaccination model, widely used to describe the failures and epidemics. A susceptible node means the financial institution is healthy (i.e., good financial condition) but can be infected once its infected neighbors cannot fulfill economic obligations. The infected node stands for the bad financial institution, and can not fulfill their economic obligations, and thus may transmit the financial risk to neighbors. The removed node means that a financial institution does not have any financial activities and can not trigger additional financial risk. The vaccination means that the financial institution has adopted measures to protect itself from being infected. On layer A, i.e., the CEO network where the information about the state of those financial conditions spreads, we divide the CEOs into two types: risk aversion and risk patience. A risk averse CEO means that he/shethey will take measures to protect his/hertheir financial institution from being infected once he/shethey obtains one piece of information from friends. Differently, a risk patient CEO takes measures only when he/she obtainsthey obtain ample information, i.e., T, from friends. For each CEO, they belonghe/she belongs to a risk aversion with probability p, and the remaining nodes 1 − p belong to the risk patience. We use a susceptible-informed-removed model to describe the information-spreading dynamics.
To stimulate the financial risk spreading, we randomly select one financial institution in layer B, and set it to be in the infected state. At each time state, the infected node jB in layer B transmits the financial risk to each neighbor iB with probability λB. If the infection is successful, its corresponding node iA in layer A becomes informed, i.e., he/shethey know the “bad” information about his/hertheir financial institution, once iA is in the susceptible state. The node jB becomes a removed state with probability γB. On layer A, we use ℓA to record the number amount of the received information from neighbors for node jA. We set ℓA = 0 initially, which means he/she doesthey do not know any information about the financial risk. At each time step, each node jA transmits the information to every susceptible neighbor iA with probability λA. If the node iA obtains the information successfully, he/shethey becomes an informed state, and we set ℓA → ℓA + 1. If the node jA represents a risk patient CEO, its corresponding node jB becomes vaccination state with probability φ when ℓA ≥ T. If the node jA is a risk aversion CEO, he/she becomesthey become vaccinated with probability φ. Therefore, the information spreading among the CEOs suppresses the financial risk spreading. The informed nodes become a recovered state with probability γA. The spreading dynamics evolve until there are no nodes in the infected or informed state in the system.
3 Results Analyses
We present the theoretical and Monte Carlo simulation results in this section. In Section 3.1, we present a heterogeneous mean-field theory to describe the evolution of the financial risk spreading dynamics in a two-layered network. Then, in Section 3.2, we use Monte Carlo simulation to study the model.
3.1 Theoretical Results
We here adopt a mean-field approach to study the evolution of the coupled dynamics. We assume there are no differences among the nodes. That is to say, different nodes in the same state have the same probability. Denoting SA(t), ρA(t), and RA(t) as the probability of a node in layer A is in the susceptible, infected, recovered, and vaccination state, while as B is in the susceptible, infected, recovered, and vaccination state as SB(t), ρB(t), RB(t), and VB(t), respectively. Since each node can only be one of the three (or four) states in layer A (or layer B), we have
In the following, we investigate the rate equations of SA(t), ρA(t), RA(t), SB(t), ρB(t), RB(t), and VB(t).
In the CEO network, i.e., layer A, the decrease of SA(t) has two situations. Conversely, the susceptible node in layer A is informed by neighbors with probability ⟨kA⟩λASA(t)ρA(t), where ⟨kA⟩ is the mean degree of layer A. On the other hand, the corresponding node in layer B changes from susceptible state to infected. To compute the probability of this event, we should know that a node in layer A is a susceptible state, which means that its corresponding node in layer B is also in the susceptible state. Thus, we know the second event happens with probability ⟨kB⟩λBSA(t)ρB(t), where ⟨kB⟩ is the mean degree of layer B. Combining the above two situations, we know the evolution of SA(t) as
For the evolution of ρA(t), the increase of ρA(t) equals to the decrease of SA(t). The decrease of ρA(t) is γAρA(t). We have
Similarly, we know the evolution of RA(t) is
We then investigate the financial risk spreading on layer B. The decrease of SB(t) has two situations. For the first situation, a susceptible node in layer B is infected by neighbors with probability ⟨kB⟩λBSA(t)ρB(t). On the other hand, the susceptible node may become change to a vaccination state. If the susceptible state’s corresponding node in layer A is a risk aversion CEO, it becomes a vaccination state with probability φ⟨kA⟩λASA(t)ρA(t). If the susceptible state’s corresponding node in layer A is a risk patient CEO, we should compute the obtained pieces of risk information at time step t. The probability that a susceptible node in layer A obtains m pieces of information at time t is
where u(t) = ⟨kA⟩λASA(t)ρA(t). Since the corresponding node in layer A of a susceptible node in layer B should receive at least T pieces of information when becoming to the vaccinated state, we have
Combining the above two situations, we know the evolution of SB(t) as
Similarly, we know the evolutions of ρB(t), RB(t) and VB(t) as
and
respectively. Numerically studying the above equations, we obtain the density of nodes in each state.
To obtain the percolation threshold point, we can investigate the linearizitionlinearization of Eqs 3, 8 when t → 0. We have SA(t) → 1 and SB(t) → 1. We know
where βA = λA/γA and βB = λB/γB are the rescaled infection probability. We rewrite Eq. 11 in matrix form as
where
Since the financial risk spreading promotes the information diffusion in layer A, we know the information outbreak threshold is smaller than the financial risk breaks outs. The largest eigenvalue of C is
The outbreak threshold of the information is
We cannot analytically obtain analytically a value for the financial risk globally outbreak threshold, and we can only obtain the numerical value.
3.2 Monte Carlo Simulation Results
We use a Monte Carlo simulation approach to study the financial risk spreading dynamics on the two-layered networks. For layers A and B, we use the homogeneous ER networks with a Poisson distribution
We first introduce the methods to perform the Monte Carlo simulation for our suggested model.
i): Generating networks A and B according to the uncorrelated correlated model for the given degree distributions PA (kA) and PB(kB), respectively. For each CEO, we draw a probability q. If q ≤ p, the CEO belongs to thea risk aversion category. Otherwise, the CEO belongs to the risk patient.
ii): Randomly select a node in layer B and set it to be in the infected state.
iii): To stimulate the financial risk spreading, we randomly select one financial institution in layer B, and set it in to the infected state.
iv): Update the states of nodes in layer B. Each infected node jB tries to transmit the risk to a susceptible neighbor iB. Generating a random probability q, if q ≤ λB, node iB becomes infected, and the corresponding node iA becomes informed.
v): Recovery of each infected node jB. Generating a random probability q, if q ≤ γB, node jB becomes recovered.
vi): Update the states of nodes in layer A. Each informed node jA tries to transmit the information to a susceptible neighbor iA. Generating a random probability q, if q ≤ λA, node iA becomes informed, and set ℓA → ℓA + 1. If iA is a risk patient CEO, generating a random probability q and ℓA ≥ T, the node iA change to a vaccination state when q ≤ φ. If iA is a risk aversion CEO, iA changes to vaccination state with probability φ.
vii): Recovery of each infected node jA. Generating a random probability q, if q ≤ γA, node jA becomes recovered.
viii): Repeat steps (iii)–(vii) until there is are no nodes in the informed and infected states.
In Figure 1, we first study the temporal evolution of the coevolution spreading dynamics on the homogeneous artificial networks. For the risk information spreading in the CEO network, i.e., layer A, the density of nodes in the informed state A, the density of nodes in the informed state ρA(t) first increases with time, then reaches a peak, and finally decreases to zero. We observe a similar phenomenaphenomenon for the evolution of financial risk ρB(t). Differently, ρA(t) reaches its peak is earlier than ρB(t), since the financial risk spreading dynamics promote the risk information spreading. However, the effects of the heterogeneous population of CEO networks do not become obvious, i.e., the fraction of individuals are the risk aversion CEOs. The evolutions of RA(t) and RB(t) increases with t continuously. We note that the more nodes belong to the risk aversion CEOs, the less financial risk outbreak size, i.e., the smaller RB(t). Since This is because risk averse CEOs are more likely to take measures to protect themselves from being infected, resulting in a higher VB(t).
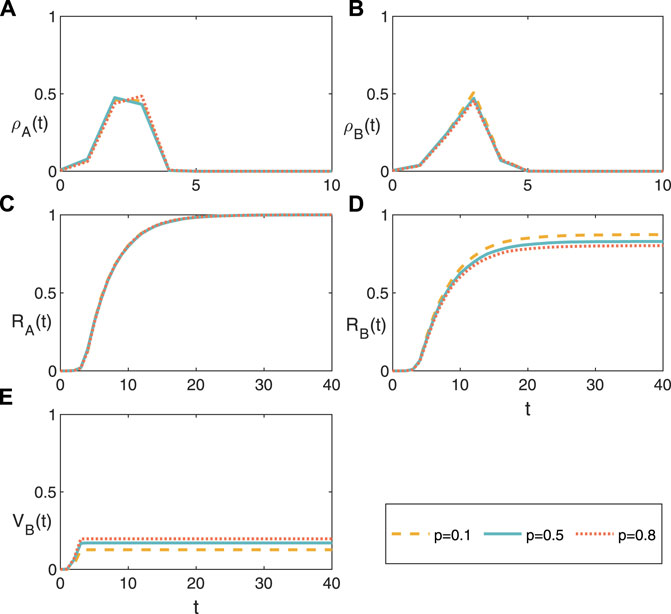
FIGURE 1. (Color online) Temporal evolutions of the spreading dynamics. The density of nodes in the (A) informed state ρA(t) of layer A, (B) infected state ρB(t) of layer B, (C) removed state RA(t) of layer A, (D) removed state RB(t) of layer B, and (E) vaccination state RA(t) of layer (B). We set the average degree of the two layers as ⟨kA⟩ = ⟨kB⟩ = 10, information spreading probability λA = 0.5, financial risk probability λB = 0.8, T = 3, recovery probability γA = γB = 0.2, and φ = 0.9.
We then investigate the final financial risk spreading size RB and final risk information spreading size RA in Figure 2. Since the risk information spreading probability is set to be λB = 0.5 and λB = 0.8, we find that RA is not affected by the heterogeneity of the CEO population (see Figures 2A,D). For the financial risk spreading, we find optimal risk information spreading probability at which RB reaches a minimum value (see Figures 2B,E). Specifically, RB first decreases with λA since the CEOs will take measures to protect themselves from being infected by the financial risk and will be immunized, as shown in Figures 2C,F. However, when λA is large enough, those risk patient CEOs will not be immunized since they can not obtain sufficient risk information from neighbors, thus inducing a higher values of RB. We conclude that a reasonable information transmission probability helps us to decrease the financial risk spreading. In Figure 3, we further study the effects of the average degree of the two networks and find that the phenomenona is not affected qualitatively.
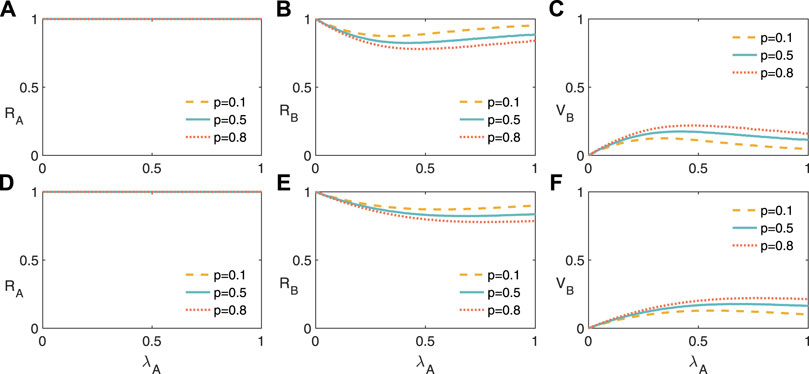
FIGURE 2. (Color online) The financial risk spreading on two-layer networks for a given values of financial risk transmission probability. Final information spreading size RA (A), final financial risk spreading size RB (B), and vaccination size RB (C) versus information transmission probability λA with financial risk transmission probability λB = 0.5. RA (D), RB (B), and RB (C) versus λA with λB = 0.8. We set the average degree of the two layers as ⟨kA⟩ = ⟨kB⟩ = 10, T = 3, recovery probability γA = γB = 0.2, and φ = 0.9.
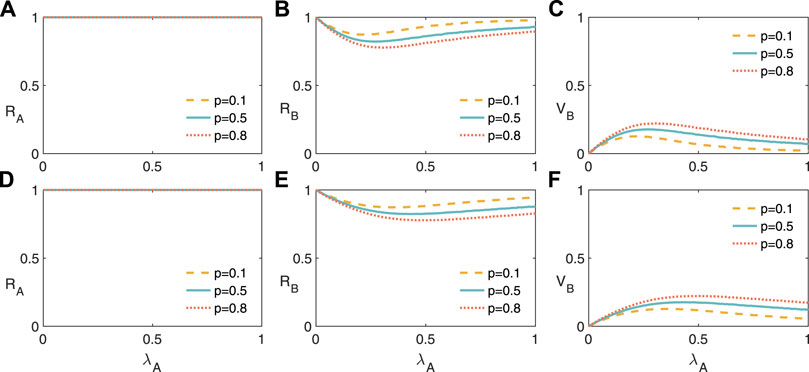
FIGURE 3. (Color online) The financial risk spreading on two-layer networks for a given values of financial risk transmission probability. Final information spreading size RA (A), final financial risk spreading size RB (B), and vaccination size RB (C) versus information transmission probability λA with financial risk transmission probability λB = 0.5. RA (D), RB (B), and RB (C) versus λA with λB = 0.8. We set the average degree of the two layers as ⟨kA⟩ = 15, ⟨kB⟩ = 10, T = 3, recovery probability γA = γB = 0.2, and φ = 0.9.
For a given information transmission probability λA, we investigate RA, RB, and VB as a function of λB in Figure 4. Since λA are much larger than the risk outbreak threshold, RA are not affected by p, i.e., the fraction of nodes belongs to the risk averse CEOs (see Figures 4A,D). RB first increases with as λB decreases, and finally increase, as shown in Figures 4B,E. That is to say, enlarging the financial risk spreading probability does not always enlarge increase the financial risk spreading. Since only the risk information and financial risk spreading have a compatible speed, the immunized nodes will be maximized (see Figures 4C,F). The average degree of the two networks does not qualitatively affect the phenomena in Figure 5.
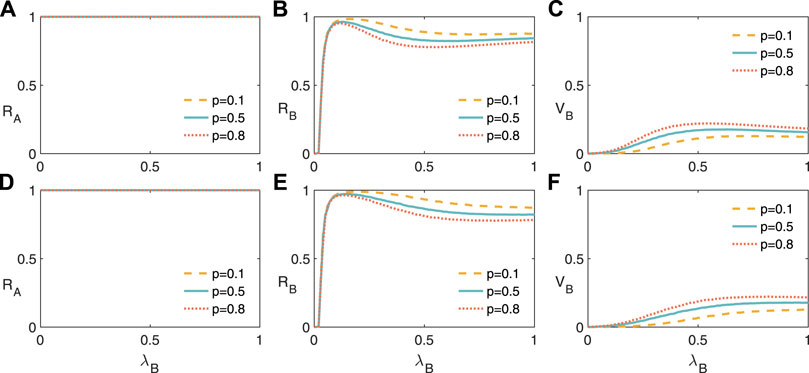
FIGURE 4. (Color online) The financial risk spreading on two-layer networks for a given values of financial risk transmission probability. Final information spreading size RA (A), final financial risk spreading size RB (B), and vaccination size RB (C) versus information transmission probability λB with financial risk transmission probability λA = 0.5. RA (D), RB (B), and RB (C) versus λB with λA = 0.8. We set the average degree of the two layers as ⟨kA⟩ = ⟨kB⟩ = 10, T = 3, recovery probability γA = γB = 0.2, and φ = 0.9.
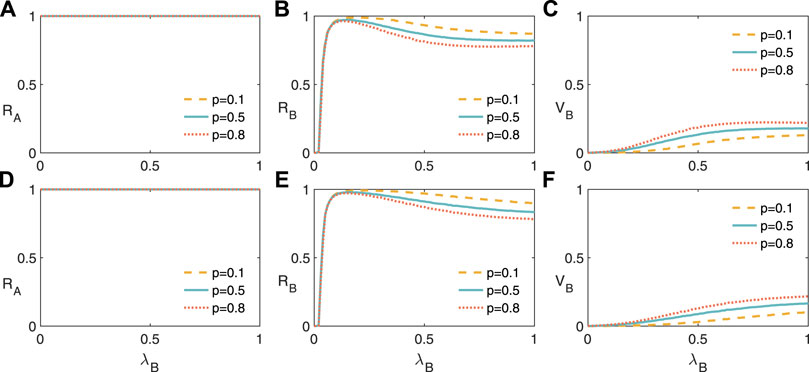
FIGURE 5. (Color online) The financial risk spreading on two-layer networks for a given values of financial risk transmission probability. Final information spreading size RA (A), final financial risk spreading size RB (B), and vaccination size RB (C) versus information transmission probability λB with financial risk transmission probability λA = 0.5. RA (D), RB (B), and RB (C) versus λB with λA = 0.8. We set the average degree of the two layers as ⟨kA⟩ = 15, ⟨kB⟩ = 10, T = 3, recovery probability γA = γB = 0.2, and φ = 0.9.
4 Conclusion
This paper uses a mathematical model to investigate the financial risk spreading on the multiplex networks. We first propose a model to describe the coevolution of financial information diffusion on the CEOs social network and financial risk spreading on the financial networks. For the CEOs, we divide them into two types and investigate the relatively fraction on the spreading dynamics. Using a mean-field approach, we study the evolution of the coevolution dynamics. We finally perform extensive numerical simulations. We find that the financial information diffusion suppresses the financial risk spreading. In addition, optimal information spreading probability exists, at which the financial risk will be greatly suppressed. Finally, we reveal that the networks average degree does not affect the above-presented phenomena qualitatively. The results presented in this paper may shed some light into on designing strategy to control the financial risk diffusion. How to develop a more accurate theory to study this model need further investigation.
Data Availability Statement
The original contributions presented in the study are included in the article/Supplementary Material, further inquiries can be directed to the corresponding authors.
Author Contributions
ML, LD, YL, and QX designed the research, performed the research, analysed the empirical data and wrote the paper.
Funding
This work was partially supported by Sichuan Science and Technology Program (No. 2020JDR0200) and National Social Science Foundation of China Western Project (No. 18XJY001).
Conflict of Interest
The authors declare that the research was conducted in the absence of any commercial or financial relationships that could be construed as a potential conflict of interest.
Publisher’s Note
All claims expressed in this article are solely those of the authors and do not necessarily represent those of their affiliated organizations, or those of the publisher, the editors and the reviewers. Any product that may be evaluated in this article, or claim that may be made by its manufacturer, is not guaranteed or endorsed by the publisher.
References
1. Glasserman P, Young HP. How Likely Is Contagion in Financial Networks? J Banking Finance (2015) 50:383–99. doi:10.1016/j.jbankfin.2014.02.006
3. Alter A, Schüler YS. Credit Spread Interdependencies of European States and banks during the Financial Crisis. J Banking Finance (2012) 36:3444–68. doi:10.1016/j.jbankfin.2012.08.002
4. Erb CB, Harvey CR, Viskanta TE. Political Risk, Economic Risk, and Financial Risk. Financial Analysts J (1996) 52:29–46. doi:10.2469/faj.v52.n6.2038
5. Haldane AG, May RM. Systemic Risk in Banking Ecosystems. Nature (2011) 469:351–5. doi:10.1038/nature09659
6. Elliott M, Golub B, Jackson MO. Financial Networks and Contagion. Am Econ Rev (2014) 104:3115–53. doi:10.1257/aer.104.10.3115
7. Gai P, Haldane A, Kapadia S. Complexity, Concentration and Contagion. J Monetary Econ (2011) 58:453–70. doi:10.1016/j.jmoneco.2011.05.005
8. Allen F, Babus A. The Network challenge: Strategy, Profit, and Risk in an Interlinked World (2009). p. 367.
9. Glasserman P, Young HP. Contagion in Financial Networks. J Econ Lit (2016) 54:779–831. doi:10.1257/jel.20151228
10. Caccioli F, Shrestha M, Moore C, Farmer JD. Stability Analysis of Financial Contagion Due to Overlapping Portfolios. J Banking Finance (2014) 46:233–45. doi:10.1016/j.jbankfin.2014.05.021
11. Caccioli F, Farmer JD, Foti N, Rockmore D. Overlapping Portfolios, Contagion, and Financial Stability. J Econ Dyn Control (2015) 51:50–63. doi:10.1016/j.jedc.2014.09.041
12. Kenett DY, Huang X, Vodenska I, Havlin S, Stanley HE. Partial Correlation Analysis: Applications for Financial Markets. Quantitative Finance (2015) 15:569–78. doi:10.1080/14697688.2014.946660
13. Silva W, Kimura H, Sobreiro VA. An Analysis of the Literature on Systemic Financial Risk: A Survey. J Financial Stab (2017) 28:91–114. doi:10.1016/j.jfs.2016.12.004
14. Battiston S, Caldarelli G, D’Errico M, Gurciullo S. Leveraging the Network: A Stress-Test Framework Based on DebtRank. Stat Risk Model (2016) 33:117–38. doi:10.1515/strm-2015-0005
15. Gai P, Kapadia S. Contagion in Financial Networks. Proc R Soc A (2010) 466:2401–23. doi:10.1098/rspa.2009.0410
16. Garas A, Argyrakis P, Rozenblat C, Tomassini M, Havlin S. Worldwide Spreading of Economic Crisis. New J Phys (2010) 12:113043. doi:10.1088/1367-2630/12/11/113043
17. Huang X, Vodenska I, Havlin S, Stanley HE. Cascading Failures in Bi-partite Graphs: Model for Systemic Risk Propagation. Scientific Rep (2013) 3:1. doi:10.1038/srep01219
18. Lin M, Duan L. Financial Risk Information Spreading on Metapopulation Networks. Complexity (2021) 2021:6654169. doi:10.1155/2021/6654169
19. Wang W, Liu Q-H, Cai S-M, Tang M, Braunstein LA, Stanley HE. Suppressing Disease Spreading by Using Information Diffusion on Multiplex Networks. Scientific Rep (2016) 6:1. doi:10.1038/srep29259
20. Wang W, Liu Q-H, Liang J, Hu Y, Zhou T. Coevolution Spreading in Complex Networks. Phys Rep (2019) 820:1–51. doi:10.1016/j.physrep.2019.07.001
21. Granell C, Gómez S, Arenas A. Dynamical Interplay between Awareness and Epidemic Spreading in Multiplex Networks. Phys Rev Lett (2013) 111:128701. doi:10.1103/physrevlett.111.128701
22. Soriano-Paños D, Ghanbarnejad F, Meloni S, Gómez-Gardeñes J. Markovian Approach to Tackle the Interaction of Simultaneous Diseases. Phys Rev E (2019) 100:062308. doi:10.1103/physreve.100.062308
23. Wang Z, Xia C. Co-evolution Spreading of Multiple Information and Epidemics on Two-Layered Networks under the Influence of Mass media. Nonlinear Dyn (2020) 102:3039–52. doi:10.1007/s11071-020-06021-7
24. Wu J, Zuo R, He C, Xiong H, Zhao K, Hu Z. The Effect of Information Literacy Heterogeneity on Epidemic Spreading in Information and Epidemic Coupled Multiplex Networks. Physica A: Stat Mech its Appl (2022) 596:127119. doi:10.1016/j.physa.2022.127119
25. Sun C, Luo C. Co-evolution of Cooperation with Resource Allocation in Spatial Multigame Using Switching Control. Commun Nonlinear Sci Numer Simulation (2022) 107:106137. doi:10.1016/j.cnsns.2021.106137
26. Wang W, Tang M, Shu P, Wang Z. Dynamics of Social Contagions with Heterogeneous Adoption Thresholds: Crossover Phenomena in Phase Transition. New J Phys (2016) 18:013029. doi:10.1088/1367-2630/18/1/013029
27. Wang X, Lan Y, Xiao J. Anomalous Structure and Dynamics in News Diffusion Among Heterogeneous Individuals. Nat Hum Behav (2019) 3:709–18. doi:10.1038/s41562-019-0605-7
28. Centola D. Research Handbook on Analytical Sociology. Cheltenham, UK: Edward Elgar Publishing (2021).
29. Gomez S, Diaz-Guilera A, Gomez-Gardenes J, Perez-Vicente CJ, Moreno Y, Arenas A. Diffusion Dynamics on Multiplex Networks. Phys Rev Lett (2013) 110:028701. doi:10.1103/physrevlett.110.028701
30. Menichetti G, Remondini D, Panzarasa P, Mondragón RJ, Bianconi G. Weighted Multiplex Networks. PloS one (2014) 9:e97857. doi:10.1371/journal.pone.0097857
31. Battiston F, Nicosia V, Latora V. The New Challenges of Multiplex Networks: Measures and Models. Eur Phys J Spec Top (2017) 226:401–16. doi:10.1140/epjst/e2016-60274-8
32. Lee K-M, Kim JY, Lee S, Goh K-I. Multiplex Networks. In: Networks of Networks: The Last Frontier of Complexity. Berlin, Germany: Springer (2014). p. 53–72. doi:10.1007/978-3-319-03518-5_3
Keywords: financial risk spreading, information diffusion, two-layer networks, spreading size, financial network
Citation: Lin M, Duan L, Li Y and Xiao Q (2022) The Roles of Information Diffusion on Financial Risk Spreading on Two-Layer Networks. Front. Phys. 10:905205. doi: 10.3389/fphy.2022.905205
Received: 26 March 2022; Accepted: 08 April 2022;
Published: 12 May 2022.
Edited by:
Wei Wang, Chongqing Medical University, ChinaReviewed by:
Jiao He, Sichuan International Studies University, ChinaShuliang Wang, Jiangsu Normal University, China
Zhong Chaohong, University of Electronic Science and Technology of China, China
Copyright © 2022 Lin, Duan, Li and Xiao. This is an open-access article distributed under the terms of the Creative Commons Attribution License (CC BY). The use, distribution or reproduction in other forums is permitted, provided the original author(s) and the copyright owner(s) are credited and that the original publication in this journal is cited, in accordance with accepted academic practice. No use, distribution or reproduction is permitted which does not comply with these terms.
*Correspondence: Min Lin, bGlubWluMDYwNEAxNjMuY29t; Li Duan, ZGxscjc2NzNAc2luYS5jb20=; Yanjin Li, eWFuamlubGlAc2N1LmVkdS5jbg==
 Min Lin
 Li Duan2*