- 1Phd Candidate of Finance, Department of Management, Faculty of Social Sciences and Economics, University of Alzahra, Tehran, Iran
- 2Department of Finance, Faculty of Management, University of Tehran, Tehran, Iran
One of the essential features of capital markets as an adaptive complex network is their collective behavior. In this paper, we have analyzed the collective behavior of banking sectors of four stock markets, which are composed of emerging and mature ones. By plotting the dendrograms and heat maps of the correlation matrices, it is found that the mature markets are more similar to each other. By applying the method of Random matrix theory(RMT), one of the important complexity notions, and its tools: participation ratio(PR) and relative participation ratio(RPR), it is obvious that mature markets have a lower degree of collective behavior than the emerging ones. By perturbing the correlation matrix of these markets, it is found that the mature markets are more vulnerable. It means that emerging markets that have lower cross-correlations are less vulnerable to perturbations. The findings of this paper are useful for policymakers of these countries to concentrate on the market structures and their behaviors.
1 Introduction
Financial markets are an important type of complex system. Complex systems consist of different components that interact with each other and with the environment outside the system [1]. These interactions may occur due to competition, dependence, relationships, and interactions between components, and modeling the intrinsic behavior of them are difficult [2, 3]. For these reasons, these systems have various properties, including nonlinearity and collective behavior. Therefore, the study of an entity alone will not be helpful and the whole system must be analyzed collectively [4–9]. A notable feature of these systems is the spatial and temporal dependence of their components [10–13].
There are various methods for measuring collective behavior, including mathematical models such as the Boids model [14, 15] and Kuramoto model [16, 17], that they consider the study of society as a complex system.
As mentioned above, there are several ways to measure collective behavior [17, 18], but a common method of complex systems for studying collective behavior is Random Matrix Theory (RMT) [19–23]. RMT also has been used for the optimal selection of investment portfolio, Identification of “market states” and long-term precursor to a critical state and Characterization of catastrophic instabilities (market crashes) [24, 25]. RMT was developed to explain the statistical properties of the energy levels of complex quantum systems in nuclear physics [26]. This theory was first applied in financial markets by Potters et al [27] at the end of the 20th century. The basis of RMT is the study of the behavior of the eigenvalues and their corresponding eigenvectors [27–30]. This theory states that the eigenvalues of the correlation matrix are divided into two noises and information parts.
Noises correspond to the eigenvalues of the random matrix, the area where they are located is called the bulk region and the information is the largest eigenvalues, which are outside the bulk region [31–33]. The largest eigenvalue of the correlation matrix contains the market information and has the same effect on the whole system, which is called market-wide effect [34–36]. By removing this eigenvalue, the collective behavior of the market changes [12]. One of the ideas based on RMT is shuffling the off-diagonal elements of the correlation matrix C. This idea eliminates the pattern of correlation between market components and thus the collective behavior of the market [33, 37]. Comparing the statistical characteristics of the C and shuffled C, we can provide valuable information about the collective behavior of the market. Whatever the difference between the two matrices is less, the collective behavior of the market is weaker [28, 33, 38].
Another statistical tools of RMT is participation ratio(PR) [39]. The participation ratio is a tool for estimating the number of significant participants in an eigenvector of a matrix [40]. We also use the relative participation ratio(RPR)that is used to measure the degree of collective behavior of each market and can be used to rank different markets in terms of collective behavior [4, 33].
As mentioned above, one of the features of complex systems is the spatiotemporal interdependence between the components of the system that change in the placement of one component to another. Lim et.al [41] by applying the local and global perturbations to the correlation matrix changed the spatiotemporal interdependence. They emphasized that markets are more sensitive to global perturbation than local ones. Namaki et.al [42]in their research expressed mature markets are more sensitive to global perturbation than emerging markets.
Many empirical findings describe the drivers of capital flows to the emerging markets [43]. So, studying these markets and comparison with mature markets is important for scholars [44–46].
On the other hand, historically banks have been one of the most important sectors of financial markets. Although mature markets have tried to reduce their dependencies on these financial institutions and to some extent they could do it, but they are still the most important source of financing in emerging markets. The goal of this paper is to analyze the degree of collective behavior of the banking sectors of four stock markets: Tehran stock exchange (TSE) and regional bank sector in the SSE180 index as emerging markets and regional banking sector activity in Standard and Poor 500 index (S&P500) and Nikkei225 index as mature ones. So we measure the robustness of these banks against local and global perturbations, and whether is there a relationship between the degree of collective behavior of each market and its vulnerability to perturbation. The data are for 4-years from March 2016 to December 2020.
This paper is organized as such after the introduction, the models used in the research are briefly presented then modeling results are shown and at the end of the paper, conclusions have been done.
2 Method
2.1 Cross-correlation matrix
To calculate the correlation of a pair of stocks, we first need to calculate the logarithmic returns of two-time series (two-stock prices). Return Ri(t) is defined as follows:
In the Eq. 1, Pi(t) refer to the price of stock i at the time of t. In this paper, we consider the Δt is 1 day as the daily prices of each stock are collected. To exclude the large effect of price on the correlation coefficient, we use the normalized returns ri(t) defined as follows.
In Eq. 2,σi is the standard deviation of the Ri, and ⟨⋯ ⟩ denotes a time average over the period studied. The cross-correlation coefficient is defined as follows:
The amount of Cijis in the range of [ −1, 1] and the amount of Cij and Cji are equal [42].
2.1.1 Shuffled cross-correlation matrix
Before defining Relative participation ratio(RPR), we should first introduce the shuffled cross-correlation matrix (shuffled C), the matrix C can be a diagonal matrix which means that there is no relationship between market components, but non-diagonal elements of the matrix C may be non-zero, indicating a correlation between market components, non-zero elements of matrix C are necessary for collective behavior but not a sufficient condition [33]. For the emergence of collective behavior in the market. In fact, we do not expect to behave collectively in a market where their constituents are in a completely random way. Therefore, in addition to having a correlation between market components, some kind of pattern or structure for that correlation is essential. To create the shuffled C matrix we randomly displace the non-diagonal components of matrix C this new matrix is called Csh. By changing the matrix C any particular pattern of correlation disappears in off-diagonal regions of C but the relationships between individual elements of C are maintained. So the matrix Csh is a matrix where only the individual elements of the market components are correlated and the specific pattern of correlation in the off-diagonal regions is lost.
2.2 Relationship between RMT distribution and correlation matrix
As mentioned above, the Cij is important for analyzing the relationship between a pair of stocks, However, in this study, we use the empirical approach. In previous work [47], it was shown that the correlation matrix C is separated into two parts. The part that corresponds to the RMT predictions and called noise and the other that deviates from the RMT is called the information. To separate the noise and information parts the eigenvalues of the correlation matrix C are analyzed. It has been shown in previous work [42, 47], that few of these eigenvalues are too far apart from others that these eigenvalues are the same information and their respective stocks have a wide effect on the whole market, which is called the market-wide effect [27, 41].
2.3 Participation ratio
Participation ratio’s statistical tool was first introduced by [39]. In the context of atomic physics, which later came into financial physics [22, 33, 48, 49] and is used to measure the degree of collective behavior in markets. In the diagonal matrix CN×N gives us a set of eigenvectors (uk) and eigenvalues (λk). Eigenvalues show the collective mode of the market. Participation ratio (PR) for the kth stock is defined as follows:
Where uk(l), l = 1, … , N are the components of uk. For the eigenvector even if it has a non-zero component, the value of PR from above is limited to N, and from below is limited to the unit. Then it can therefore be concluded that the amount of PR depends on N, (the size of the market under investigation). Therefore, it is necessary to eliminate the dependency on PR on the market size and normalize it. For this reason, a new relative participation ratio(RPR) parameter is defined, so that the PR does not depend on the size of the markets.
2.3.1 Relative participation ratio
The parameter Relative participation ratio RPR to eliminate the dependency of PR is defined as the size of the matrix. The amount of PRsh is calculated according to the Section 2.1.1, 2.3. Then the amount of RPR is defined as follows:
Where ⟨PR⟩ and ⟨PRsh⟩ represent average of PRs For all the eigenvectors of C and Csh respectively. If the answer to Eq. 5 is close to zero, it means that it is no different in C and Csh. So it is implied that there is no specific pattern of correlation in the off-diagonal regions in matrix C so the collective behavior of the market is also weak. Conversely, if the answer to the Eq. 5 is far from zero, the specific pattern of correlation is strong and as a result, the collective behavior of the market is strong.
2.4 Perturbing a correlation matrix
As summarized above, applying the perturbation to the correlation matrix eliminates some of the stylized features observed in financial time series, such as the genuine correlation between two stocks belonging to the same business group [41]. In the following, this section, we describe the details of the perturbation on the correlation matrix, Firstly, the local perturbation:
1) Select randomly one of the off-diagonal components of the cross-correlation matrix.
2) Generate two Gaussian-distributed time series (white noise series) and calculate their cross-correlations.
3) Substitute the calculated correlation in step 2 instead of the original correlation selected in step 1.
Because of the symmetry of the cross-correlation matrices, Cij and Cji are equal. So, when the local perturbation is applied, they are both placed simultaneously. As mentioned, local perturbation is a technical study [41]. It has no practical value. The meaning of global perturbation is its overall impact on market returns, so the global perturbation has a stronger and more pervasive effect. This perturbation applies as follows:
1) Select an off-diagonal component of the cross-correlation matrix.
2) Identify the two stocks belonging to the correlation coefficient of Step 1.
3) Generate two Gaussian-distributed time series.
4) Instead of the two stocks identified in step 2, place two Gaussian-distributed time series in the return matrix.
5) From the modified return matrix, calculate the new cross-correlation matrix.
Steps 4 and 5 create a global perturbation that is related to the pair of stocks selected in Step 1 to add a more structured account of the behavior of stocks to global perturbation, we add a rule to step 1 instead of randomly selecting the correlation coefficient, we first choose the pair of stocks with the strongest correlation rather than the weakest correlation. This is called the top-ranked method, and vice versa, from the weakest to the strongest correlation, this is called the bottom-ranked method.
3 Results
The purpose of the methods presented in this study is to compare the collective behavior of the banking sector in the 4 indices S&p500, Nikkei225, SSE180, and TSE. In these 4 indices, The first two are active in mature markets and the other is in the emergings. To check this comparison, we use RMT and its tools. At to end of the discussion, we will also analyze the behavior of these banks to the perturbation, and answer the question of whether markets with stronger collective behavior are more vulnerable to perturbation. To introduce, we see in Figure 1 color images of correlation matrix C for 4 markets, 2 mature markets have higher correlation and SSE180 is weaker than them. While TSE has a weaker correlation than the rest.
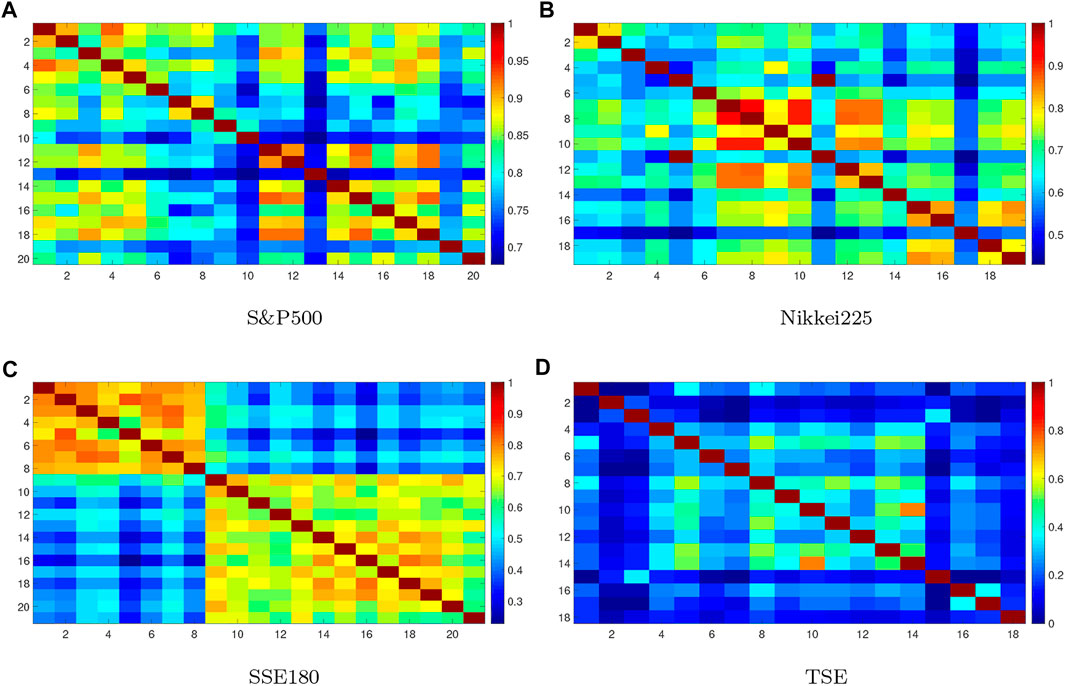
FIGURE 1. Color image of correlation matrices. Warmer colors show higher cross-correlation between components. (A) S&P500, (B) Nikkei225, (C) SSE180, (D) TSE.
Also, we draw dendrograms and heat maps of cross-correlation matrices, which measure the degree of clustering of correlation markets. Both are derived from the clustering algorithm [50], and they are clustered in Ward’s method [51]. Ward’s method is a statistical criterion used in hierarchical cluster analysis. This criterion is based on the minimum variance, which minimizes the total intra-cluster variance. At each stage of the method, the pair finds clusters that after merging, lead to a minimal increase in the total variance within the cluster. This is an increase in the square weight and distance between the centers of the clusters. In the initial stage, all clusters are single (clusters containing a single point). To apply a recursive algorithm under this objective function, the initial distance between individual objects must be (proportional to) the square Euclidean distance in dendrograms, Figure 2 horizontal axis represents the Proximity criteria of the correlation coefficients and the vertical axis represents the criterion of non-proximity of correlation coefficients As expected, mature markets have clustered more rapidly, which is concluded that cross-correlation coefficients of these markets are close, in the emerging markets, TSE clustered slower than matures. While the SSE180 is split into 2 completely separate clusters, which is illustrated in both the color image of the correlation matrix C and the heat map too. In heat maps, Figure 2 warmer colors represent the stronger correlation, which can be seen that the matures have a stronger correlation as seen in dendrograms. This begs the question: do more cluster markets have stronger collective behavior? To answer this, we use RMT for analyzing and applying PR to measure the degree of collective behavior.
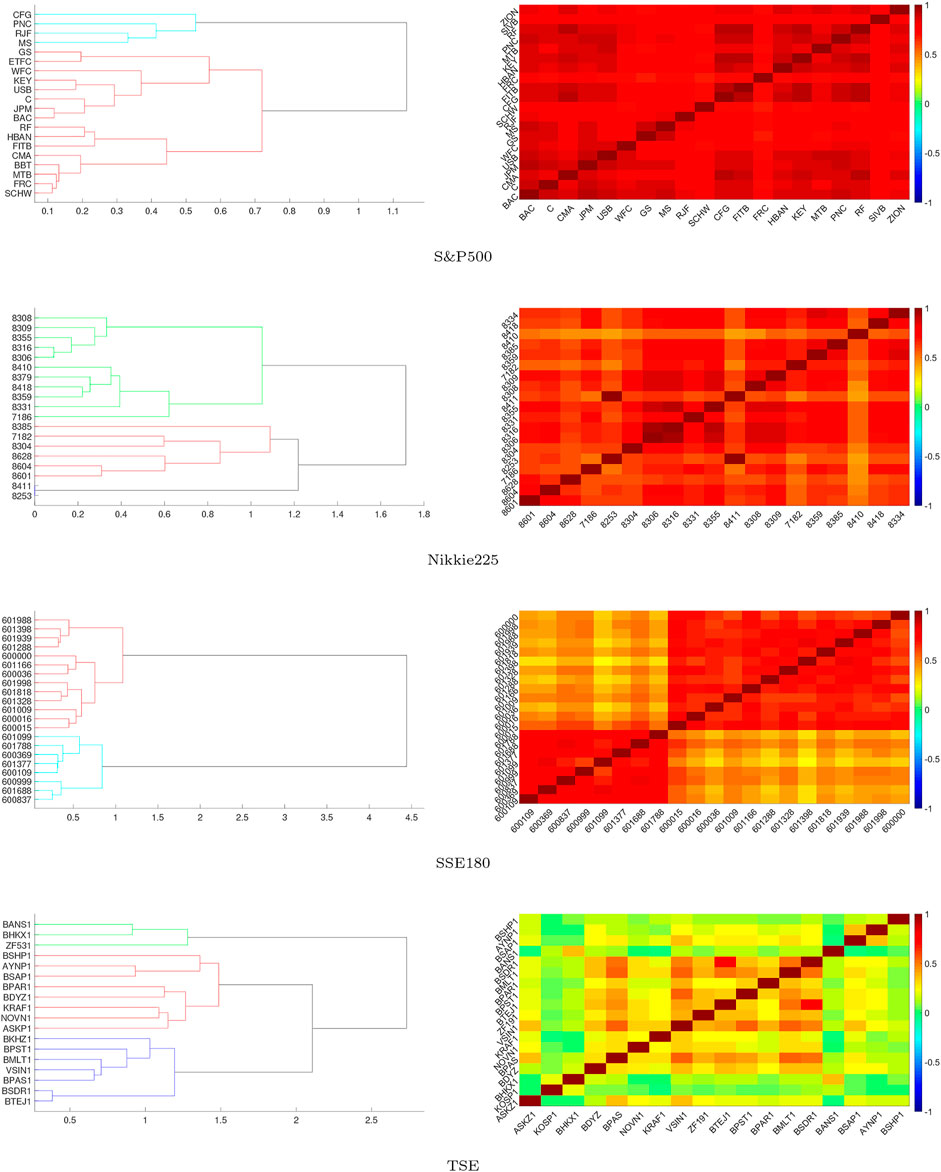
FIGURE 2. Comparing the dendrograms and Heat maps of indices: vertical axis in dendrograms represents proximity of components. In mature markets, this criteria shows a strong correlation and in TSE, it shows a weak correlation but in SSE180, the market is separated into 2 sections. Each section has a strong correlation but another section is weak. In heat maps warmer colors show a stronger correlation with markets and the results are similar to dendrograms.
As discussed above for measuring the degree of collective behavior, we use RMT tools that the base of this theory is the eigenvalues of the cross-correlation matrix. In Figure 3, we plotted maximum eigenvalues of correlation matrix Vs. maximum eigenvalues of the shuffled matrix from March 2016 to December 2020. For the first three markets, the behavior of the two charts is similar, which can be understood that the random behavior in these three markets is strong and there is no dominant mode in them, so these markets are highly efficient. But the behavior of the TSE is different from theirs, which shows its inefficiency. In Figure 4, PR and PRsh for the 4 indices is plotted. If PR and PRsh behave closely together, the collective mode is weaker. Because PR is dependent on the size of the market(N)and we cannot compare collective modes of the market by graphs, plot RPR In Figure 5 the δ value is shown, as stated if the δ value is near to zero The collective mode of the market is weak and random movement dominates the market and vice versa. So it can be concluded that the collective behavior of each of the 4 indices is weak [33]. But for the TSE index, this behavior is stronger than the rest, as in (3) and 4 were also seen.
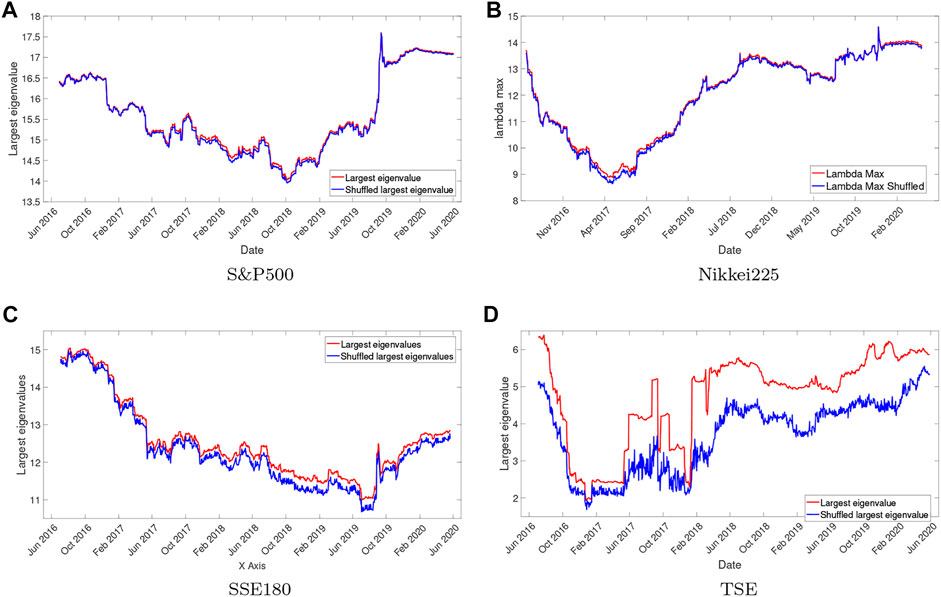
FIGURE 3. The largest eigenvalues of correlation matrix Vs. largest eigenvalues of the shuffled matrix in markets from March 2016 to December 2020 are plotted. The sliding yearly window is used with discrete steps of 1 day. In Tse distance between the two graphs is high, which indicates that the market behavior is not random and there is a dominant collective mode. (A) S&P500, (B) Nikkei225, (C) SSE180, (D) TSE.
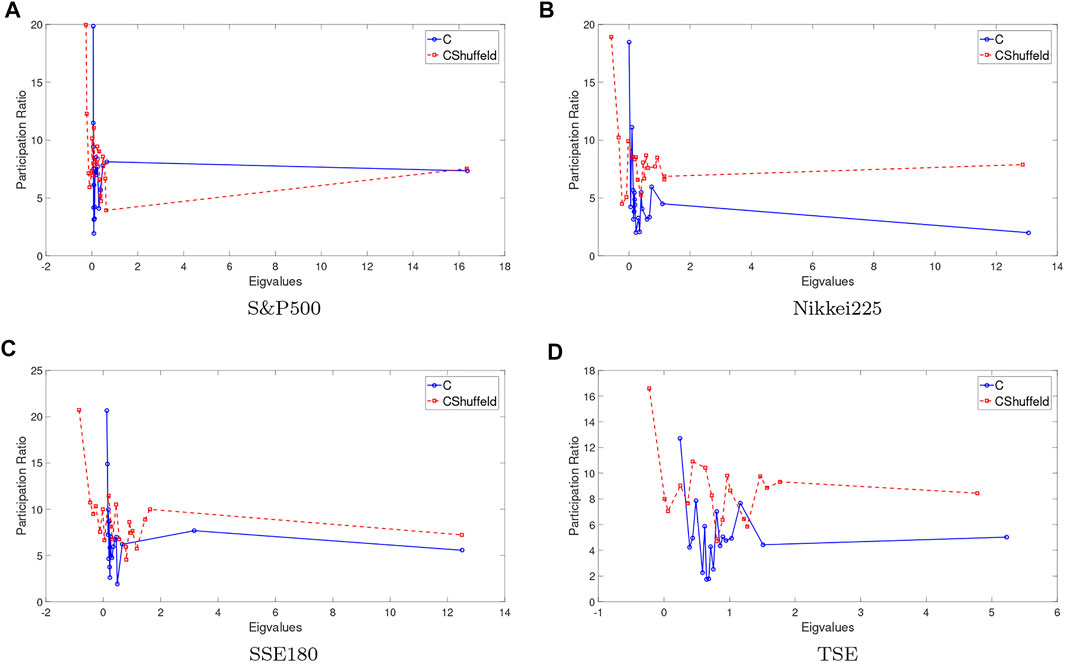
FIGURE 4. Comparing PR and PRsh for 4 indices. Whatever PR and PRsh indices behave more similarly, their collective behavior of them is weaker. PR and PRsh for S&P500 and Nikkei225 are similar to others, so we can conclude they have weaker collective behavior than emerging. (A) S&P500, (B) Nikkei225, (C) SSE180, (D) TSE.
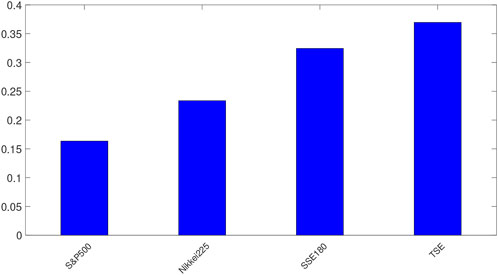
FIGURE 5. RPR is plotted for indices. RPR shows the level of collective behavior in markets. In this figure, RPR is higher for TSE and SSE180. Therefore, the collective behavior of the Iranian and Chinese index is stronger than other indicators.
Other methods used in this study are local and global perturbation. In Figure 6 global and local perturbations apply to all indices. As stated in the paper [42] mature markets react more to these perturbations. Because the range of mean values of correlation coefficient changes is higher in mature markets. It can be said that the effect of global and local perturbations on mature markets is higher than in emerging markets. The TSE index has been less responsive to the perturbation as it is more isolated than the other markets, and it is almost internally active. Thus, mature markets are more vulnerable to local and global perturbations [42]. The Figure 7 shows the range of mean changes in the global perturbed correlation matrix. As can be seen, this range is greater for mature markets, and we conclude that global perturbation is more effective in these markets. In addition, the rate of stationary is faster in emerging markets, so it can be found that the effect of the perturbation on these markets is less lasting. As mentioned in the Section 2.4 there are two methods top-ranked and bottom-ranked to make the perturbation. In Figure 8the two methods are compared which shows that they are not significantly different from each other and the type of perturbation acts has no effect on the results.
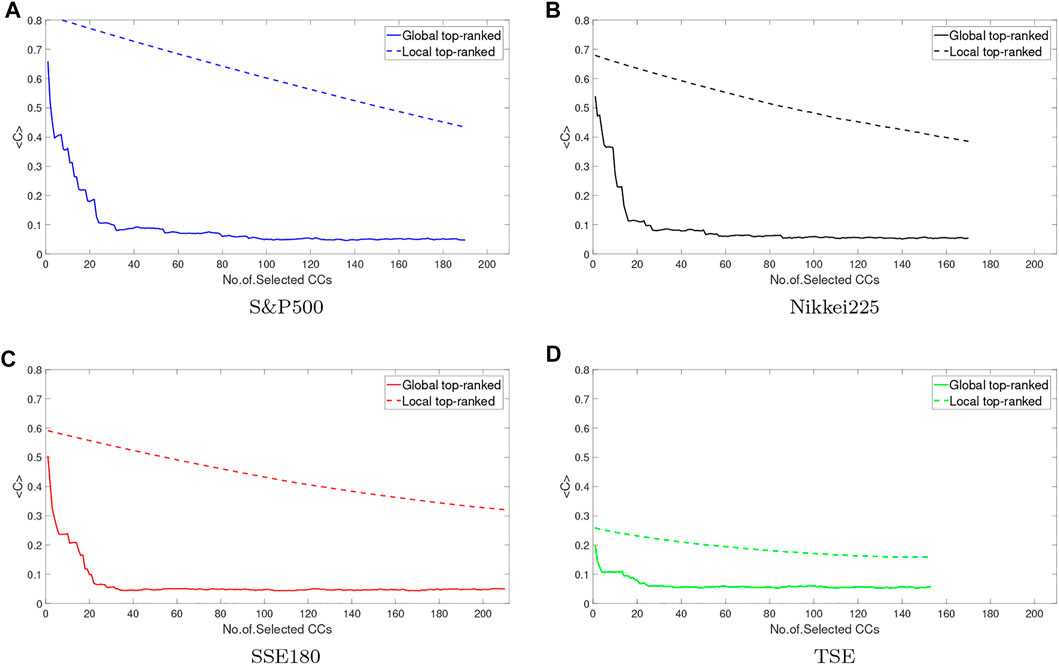
FIGURE 6. Comparison of global perturbation and local perturbation for indices. Global perturbation has more effect on indices than local. In TSE the effect of both types is weaker than another. Because this market is isolated from world markets. (A) S&P500, (B) Nikkei225, (C) SSE180, (D) TSE.
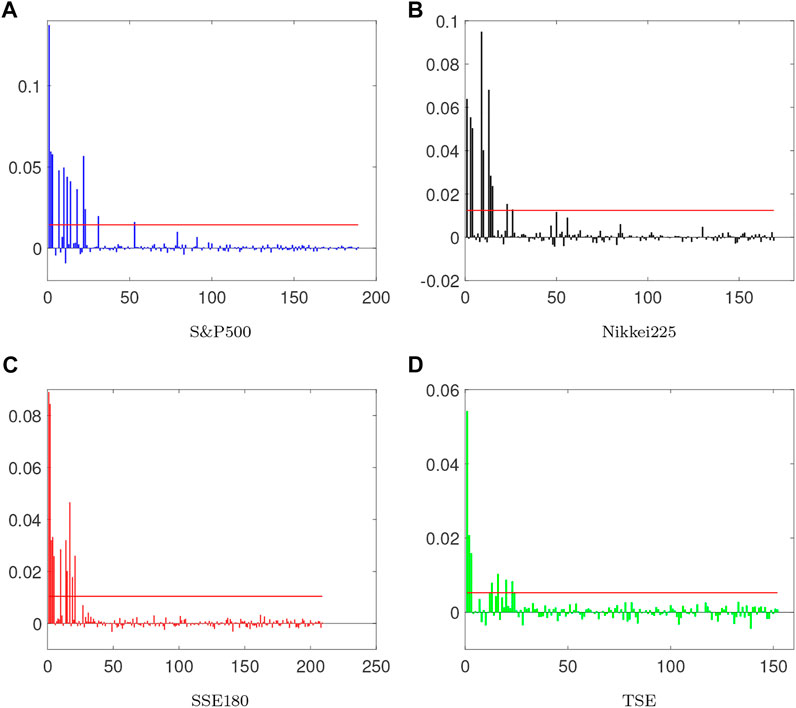
FIGURE 7. The plots show the range of mean changes for the global perturbed correlation matrices. Comparing these graphs using the standard deviation shows that moving toward stationary conditions in mature markets is slower than in emerging ones. (A) S&P500, (B) Nikkei225, (C) SSE180, (D) TSE.
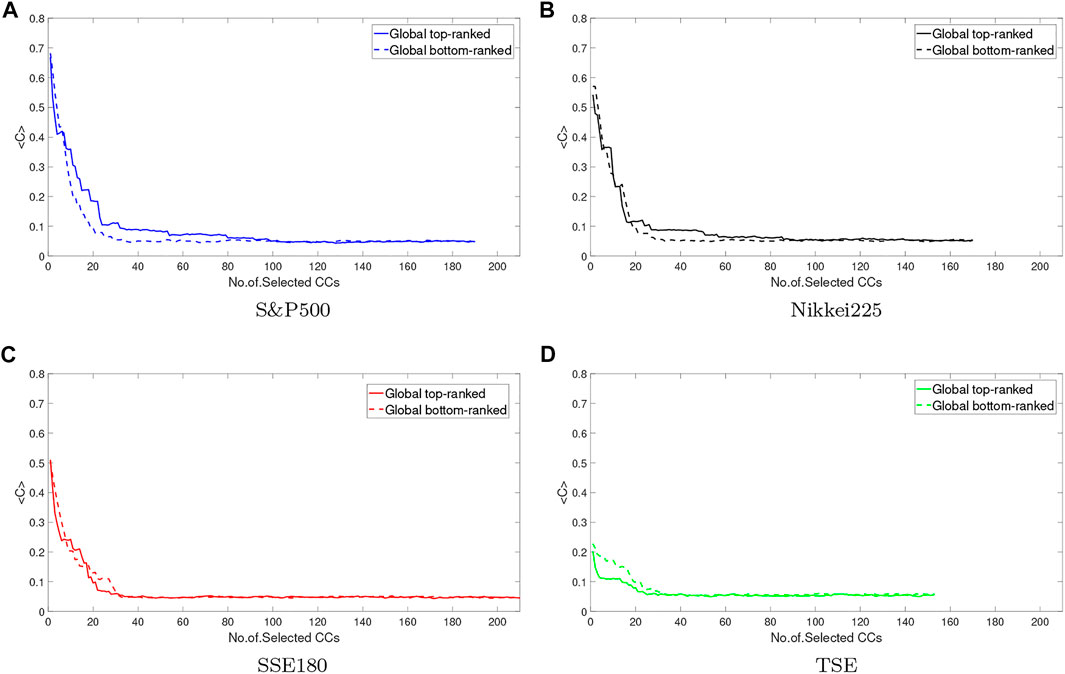
FIGURE 8. Comparing global perturbation by two methods top-ranked and bottom-ranked is plotted. As can be seen, the method of perturbation isn’t effective in results. (A) S&P500, (B) Nikkei225, (C) SSE180, (D) TSE.
4 Conclusion
In this study, it is investigated two themes: the collective behavior of the banking sector in 4 indices and the extent of their robustness to global and local perturbations. As expected, the cross-correlation of mature markets is stronger than emerging ones, but their collective behavior of them is weaker. When random behavior is strong in a market, the collective mode is weak. In this study, it was found that mature markets have a lower degree of collective behavior and a stronger random mode. It can also be concluded that mature markets are more efficient.
As the collective behavior of mature markets is weaker than emerging markets, they are more vulnerable to perturbations. Therefore, the collective behavior of the market has no clear relationship with its vulnerability to perturbations, and it can be concluded that markets with stronger cross-correlation are more vulnerable to perturbations. In TSE, because this market works internally and is isolated from other markets, the effect of the perturbation on it is weak. In addition, the perturbation effect on mature markets is more effective than emergings. The effect of perturbation methods on markets, Top-Ranked and Bottom-Ranked, are the same. For future studies, it can be analyzed the structures of different types of markets such as commodity, currency, and crypto markets by this approach and by measuring their sensitivity by applying perturbations. Also, by applying quantum mechanics, for more concentration on the concept of collective behavior, using the Density Matrix Theory for the comparison of mature and emerging markets is proposed. The idea of the Density Matrix comes from quantum mechanics for dealing with mixed states such as quantum statistical mechanics [52–54]. Mixed states arise in different situations such as when the state of the system is not completely clear or the systems are entangled with each other such as in Financial markets.
Data availability statement
The datasets presented in this study can be found in online repositories. The names of the repository/repositories and accession number(s) can be found below: http://tsetmc.ir/, https://finance.yahoo.com/.
Author contributions
All authors listed have made a substantial, direct, and intellectual contribution to the work and approved it for publication.
Conflict of interest
The authors declare that the research was conducted in the absence of any commercial or financial relationships that could be construed as a potential conflict of interest.
Publisher’s note
All claims expressed in this article are solely those of the authors and do not necessarily represent those of their affiliated organizations, or those of the publisher, the editors and the reviewers. Any product that may be evaluated in this article, or claim that may be made by its manufacturer, is not guaranteed or endorsed by the publisher.
References
1. Newman ME. The structure and function of complex networks. SIAM Rev Soc Ind Appl Math (2003) 45(2):167–256. doi:10.1137/s003614450342480
2. Arthur WB. Foundations of complexity economics. Nat Rev Phys (2021) 3(2):136–45. doi:10.1038/s42254-020-00273-3
3. Purqon A, Jamaludin . Community detection of dynamic complex networks in stock markets using hybrid methods (rmt-cn-lpam+ and rmt-bdm-sa). Front Phys (2021) 8:492. doi:10.3389/fphy.2020.574770
4. Mobarhan NS, Saeedi A, Roodposhti FR, Jafari G. Network trending; leadership, followership and neutrality among companies: A random matrix approach. Physica A: Stat Mech its Appl 462:858–863. doi:10.1016/j.physa.2016.06.067
5. Bar-Yam Y. General features of complex systems, encyclopedia of life support systems (EOLSS). Oxford, UK 1: UNESCO, EOLSS Publishers.
6. Ji J, Huang C, Cao Y, Hu S. The network structure of Chinese finance market through the method of complex network and random matrix theory. Concurrency Computat Pract Exper (2019) 31(9):e4877. doi:10.1002/cpe.4877
7. Wang S, He S, Yousefpour A, Jahanshahi H, Repnik R, Perc M. Chaos and complexity in a fractional-order financial system with time delays. Chaos Solitons Fractals (2020) 131:109521. doi:10.1016/j.chaos.2019.109521
8. Turalska M, West BJ. Fractional dynamics of individuals in complex networks. Front Phys (2018) 6:110. doi:10.3389/fphy.2018.00110
9. Hosseiny A, Bahrami M, Palestrini A, Gallegati M. Metastable features of economic networks and responses to exogenous shocks. PloS one (2016) 11(10):e0160363. doi:10.1371/journal.pone.0160363
10. Johnson NF, Jefferies P, Hui PM. Financial market complexity. Oxford, England, UK: OUP Catalogue (2003).
11. Stanley H, Mantegna R. An introduction to econophysics. Cambridge: Cambridge University Press (2000).
12. Namaki A, Shirazi A, Raei R, Jafari G. Network analysis of a financial market based on genuine correlation and threshold method. Physica A: Stat Mech its Appl (2011) 390(21-22):3835–41. doi:10.1016/j.physa.2011.06.033
13. Albert R, Jeong H, Barabási A-L. Error and attack tolerance of complex networks. Nature (2000) 406(6794):378–82. doi:10.1038/35019019
14. Reynolds CW. Flocks, herds and schools: A distributed behavioral model. In: Proceedings of the 14th annual conference on Computer graphics and interactive techniques (1987). p. 25–34.
15. Gershenson C, Muoz-Melndez A, Zapotecatl JL. Performance metrics of collective coordinated motion in flocks. Artif Life Conf Proc (2016). 13:322–9. doi:10.7551/978-0-262-33936-0-CH054
16. Nakagawa N, Kuramoto Y. From collective oscillations to collective chaos in a globally coupled oscillator system. Physica D: Nonlinear Phenomena (1994) 75(1-3):74–80. doi:10.1016/0167-2789(94)90275-5
17. Peron TD, Rodrigues FA. Collective behavior in financial markets. EPL (Europhysics Letters) (2011) 96(4):48004. doi:10.1209/0295-5075/96/48004
18. Li S, Xu T, He J. Determination of collective behavior of the financial market. SpringerPlus (2016) 5(1):1535–9. doi:10.1186/s40064-016-3203-4
19. Mantegna RN, Stanley HE. Introduction to econophysics: Correlations and complexity in finance. Cambridge, England, UK: Cambridge University Press (1999).
20. Potters M, Bouchaud J, Laloux L. Theory of financial risks: From statistical physics to risk management. England: Cambridge university press Cambridge (2000).
21. Mehta ML. Random matrices, volume 142 of pure and applied mathematics. Cambridge, Massachusetts, USA: Academic Press (2004).
22. Guhr T, Müller-Groeling A, Weidenmüller HA. Random-matrix theories in quantum physics: Common concepts. Phys Rep (1998) 299(4-6):189–425. doi:10.1016/s0370-1573(97)00088-4
23. Afsharizand B, Chaghoei PH, Kordbacheh AA, Trufanov A, Jafari G. Market of stocks during crisis looks like a flock of birds. Entropy (2020) 22(9):1038. doi:10.3390/e22091038
24. Tian J, Zhao K. Optimal selection of financial risk investment portfolio based on random matrix method. J Comput Methods Sci Eng (2020) 20(3):859–68. doi:10.3233/jcm-194028
25. Pharasi HK, Sharma K, Chakraborti A, Seligman TH. Complex market dynamics in the light of random matrix theory. In: New perspectives and challenges in econophysics and sociophysics. Springer (2019). p. 13–34.
26. Wigner EP. On the statistical distribution of the widths and spacings of nuclear resonance levels. Math Proc Cambridge Philosophical Soc (1951) 47:790–8. doi:10.1017/S0305004100027237
27. Laloux L, Cizeau P, Bouchaud J-P, Potters M. Noise dressing of financial correlation matrices. Phys Rev Lett (1999) 83(7):1467–70. doi:10.1103/physrevlett.83.1467
28. Namaki A, Raei R, Jafari G. Comparing tehran stock exchange as an emerging market with a mature market by random matrix approach. Int J Mod Phys C (2011) 22(04):371–83. doi:10.1142/s0129183111016300
29. Jalan S, Solymosi N, Vattay G, Li B. Random matrix analysis of localization properties of gene coexpression network. Phys Rev E (2010) 81(4):046118. doi:10.1103/physreve.81.046118
30. Samal A, Kumar S, Yadav Y, Chakraborti A. Network-centric indicators for fragility in global financial indices. Front Phys (2021) 8:624373. doi:10.3389/fphy.2020.624373
31. Plerou V, Gopikrishnan P, Rosenow B, Amaral LAN, Stanley HE. Universal and nonuniversal properties of cross correlations in financial time series. Phys Rev Lett (1999) 83(7):1471–4. doi:10.1103/physrevlett.83.1471
32. Plerou V, Gopikrishnan P, Rosenow B, Amaral L, Stanley H. Collective behavior of stock price movements—A random matrix theory approach. Physica A: Stat Mech its Appl (2001) 299(1-2):175–80. doi:10.1016/s0378-4371(01)00293-x
33. Saeedian M, Jamali T, Kamali M, Bayani H, Yasseri T, Jafari G. Emergence of world-stock-market network. Physica A: Stat Mech its Appl (2019) 526:120792. doi:10.1016/j.physa.2019.04.028
34. Utsugi A, Ino K, Oshikawa M. Random matrix theory analysis of cross correlations in financial markets. Phys Rev E (2004) 70(2):026110. doi:10.1103/physreve.70.026110
35. Plerou V, Gopikrishnan P, Amaral LAN, Meyer M, Stanley HE. Scaling of the distribution of price fluctuations of individual companies. Phys Rev E (1999) 60(6):6519–29. doi:10.1103/physreve.60.6519
36. Ahn S, Choi J, Lim G, Cha KY, Kim S, Kim K. Identifying the structure of group correlation in the Korean financial market. Physica A: Stat Mech its Appl (2011) 390(11):1991–2001. doi:10.1016/j.physa.2010.12.027
37. Podobnik B, Wang D, Horvatic D, Grosse I, Stanley HE. Time-lag cross-correlations in collective phenomena. EPL (Europhysics Letters) (2010) 90(6):68001. doi:10.1209/0295-5075/90/68001
38. Jamali T, Jafari G. Spectra of empirical autocorrelation matrices: A random-matrix-theory–inspired perspective. EPL (Europhysics Letters) (2015) 111(1):10001. doi:10.1209/0295-5075/111/10001
39. Bell R, Dean P. Atomic vibrations in vitreous silica. Discuss Faraday Soc (1970) 50:55–61. doi:10.1039/df9705000055
40. Pan RK, Sinha S. Collective behavior of stock price movements in an emerging market. Phys Rev E (2007) 76(4):046116. doi:10.1103/physreve.76.046116
41. Lim G, Kim S, Kim J, Kim P, Kang Y, Park S, et al. Structure of a financial cross-correlation matrix under attack. Physica A: Stat Mech its Appl (2009) 388(18):3851–8. doi:10.1016/j.physa.2009.05.018
42. Namaki A, Jafari G, Raei R. Comparing the structure of an emerging market with a mature one under global perturbation. Physica A: Stat Mech its Appl (2011) 390(17):3020–5. doi:10.1016/j.physa.2011.04.004
43. Koepke R. What drives capital flows to emerging markets? A survey of the empirical literature. J Econ Surv (2019) 33(2):516–40. doi:10.1111/joes.12273
44. Namaki A, Raei R, Ardalankia J, Hedayatifar L, Hosseiny A, Haven E, et al. Analysis of the global banking network by random matrix theory. Front Phys (2021) 8:586561. doi:10.3389/fphy.2020.586561
45. Kumar S, Kumar S, Kumar P. Diffusion entropy analysis and random matrix analysis of the indian stock market. Physica A: Stat Mech its Appl (2020) 560:125122. doi:10.1016/j.physa.2020.125122
46. Ahmed S, Zlate A. Capital flows to emerging market economies: A brave new world? J Int Money Finance (2014) 48:221–48. doi:10.1016/j.jimonfin.2014.05.015
47. Gopikrishnan P, Plerou V, Amaral LAN, Meyer M, Stanley HE. Scaling of the distribution of fluctuations of financial market indices. Phys Rev E (1999) 60(5):5305–16. doi:10.1103/physreve.60.5305
48. Plerou V, Gopikrishnan P, Rosenow B, Amaral LAN, Guhr T, Stanley HE. Random matrix approach to cross correlations in financial data. Phys Rev E (2002) 65(6):066126. doi:10.1103/physreve.65.066126
49. Wang G-J, Xie C, Chen S, Yang J-J, Yang M-Y. Random matrix theory analysis of cross-correlations in the us stock market: Evidence from pearson’s correlation coefficient and detrended cross-correlation coefficient. Physica A: Stat Mech its Appl (2013) 392(17):3715–30. doi:10.1016/j.physa.2013.04.027
50. Cattell RB. The description of personality: Basic traits resolved into clusters. J abnormal Soc Psychol (1943) 38(4):476–506. doi:10.1037/h0054116
51. Ward JH. Hierarchical grouping to optimize an objective function. J Am Stat Assoc (1963) 58(301):236–44. doi:10.1080/01621459.1963.10500845
52. Landau L. The damping problem in wave mechanics. Z Physik (1927) 45(63):430–41. doi:10.1007/bf01343064
53. Fano U. Density matrices as polarization vectors. Rend Fis Acc Lincei (1995) 6(2):123–30. doi:10.1007/bf03001661
Keywords: cross-correlation matrix, random matrix theory, collective behavior, global perturbation, emerging and mature markets
Citation: Vahabi H, Namaki A and Raei R (2022) Comparing the collective behavior of banking industry in emerging markets versus mature ones by random matrix approach. Front. Phys. 10:896303. doi: 10.3389/fphy.2022.896303
Received: 14 March 2022; Accepted: 05 August 2022;
Published: 08 September 2022.
Edited by:
Emmanuel E. Haven, Memorial University of Newfoundland, CanadaReviewed by:
Bikas K. Chakrabarti, Saha Institute of Nuclear Physics (SINP), IndiaPetre Caraiani, Bucharest Academy of Economic Studies, Romania
Copyright © 2022 Vahabi, Namaki and Raei. This is an open-access article distributed under the terms of the Creative Commons Attribution License (CC BY). The use, distribution or reproduction in other forums is permitted, provided the original author(s) and the copyright owner(s) are credited and that the original publication in this journal is cited, in accordance with accepted academic practice. No use, distribution or reproduction is permitted which does not comply with these terms.
*Correspondence: A. Namaki, YWxpbmFtYWtpQHV0LmFjLmly
 H. Vahabi
 A. Namaki
 R. Raei2