 Matteo Brizioli1
 Tatjana Sentjabrskaja2
 Stefan U. Egelhaaf2
 Marco Laurati3
 Roberto Cerbino4*
 Fabio Giavazzi1*
- 1Department of Medical Biotechnology and Translational Medicine, University of Milan, Milan, Italy
- 2Condensed Matter Physics Laboratory, Heinrich Heine University, Düsseldorf, Germany
- 3Department of Chemistry and CSGI, University of Florence, Sesto Fiorentino, Italy
- 4Faculty of Physics, University of Vienna, Vienna, Austria
The simultaneous presence of normal (Brownian) diffusion and non-Gaussian statistics of particle displacements has been identified as a recurring motif for a broad spectrum of physical and biological systems. While not yet fully understood, it is generally accepted that a key ingredient for observing this Brownian yet non-Gaussian (BNG) diffusion is that the environment hosting the particles appears stationary and homogenous on the small length and time scales, while displaying significant fluctuations on larger distances and/or longer time scales. To date, most of the experimental studies on systems displaying BNG diffusion have been performed in direct space, usually via a combination of optical microscopy and particle tracking to quantify the particle’s self-diffusion. Here, we demonstrate that a reciprocal space analysis of the density fluctuations caused by the particle motion as a function of the wave vector enables the investigation of BNG diffusion in situations where single-particle tracking is impossible. To accomplish this aim, we use confocal differential dynamic microscopy (ConDDM) to study the BNG dynamics of diluted sub-resolution tracers diffusing in a glassy matrix of larger hard spheres. We first elucidate the nontrivial connection between the tracer self-diffusion and collective relaxation of the resulting density fluctuations. We find that the experimentally determined intermediate scattering functions are in excellent agreement with the recent predictions of a “diffusing diffusivity” model of BNG diffusion, whose analytical predictions are available only in reciprocal space. Our results show that studying BNG diffusion in reciprocal space can be an invaluable strategy to access the fast, anomalous dynamics occurring at very small scales in crowded environments.
1 Introduction
According to Einstein’s celebrated theory of diffusion, the Fickian relaxation of a concentration profile is the macroscopic manifestation of the random Brownian motion performed by solute particles. The trajectory of each particle, which is the result of a large number of “kicks” from the solvent molecules, can be thought of as a sequence of random independent steps, extracted from some probability distribution with finite variance. Under these hypotheses, the mean square displacement (MSD) of the particles increases linearly with the number of steps (and thus with the delay time), and the probability distribution function (PDF) of particle displacements is a Gaussian function, in agreement with the central limit theorem. Any significant violation of one or more of the abovementioned hypotheses leads to some form of anomalous diffusion, characterized by a nonlinear scaling of the MSD with time and/or by a non-Gaussian PDF of particle displacements [1, 2]. Various examples of nonlinear MSD scaling can be found in literature, the typical cases being subdiffusion in a crowded environment [3], in the cell cytoplasm [1], in viscoelastic fluids [4], or in fluids with memory and superdiffusion in active [5], driven, [6], or aging [7] systems.
The observation that it is possible to have a linear scaling of the MSD while simultaneously escaping the central limit theorem (i.e., without Gaussian statistics of particle displacements) is relatively recent [8]. After these first reports of Brownian yet non-Gaussian (BNG) diffusion, the same pattern has been recognized for a variety of soft and biological systems [9–12], with ongoing efforts to provide some kind of universal explanation. An early idea [8], later formalized within the general concept of superstatistics [13], is that each particle performs a simple Brownian motion, with the MSD linearly scaling with time and a Gaussian distribution of the displacements. However, if different particles have different diffusivities D distributed according to a certain “superstatistical” probability distribution P(D), the resulting ensemble-averaged MSD remains linear, while the PDF of particle displacements is no longer Gaussian. This can be easily understood as a straightforward mathematical consequence of the fact that the weighted average of linear functions of time remains linear, whereas weighting Gaussian functions with different widths does not result in a Gaussian function. One of the simplest implementations of this concept could be a collection of highly polydisperse particles embedded in a Newtonian fluid [14]. An alternative compatible scenario entails a heterogenous environment comprising locally homogenous regions of different effective viscosity, explored by identical particles. Within this framework, the PDF of particle displacements is a weighted average of Gaussian functions whose variances increase linearly with the delay time Δt. As a consequence, the functional form of the PDF is fixed, and considering different delay times Δt simply corresponds to a different scaling of the same master curve. This prediction is not compatible with the frequently reported observation of a systematic change in the PDF of particle displacements, which typically becomes closer and closer to a Gaussian function as the delay time Δt increases [8].
To account for this behavior, the elegant idea of diffusing diffusivity has been proposed by Chubynsky and Slater [15]. According to the diffusing diffusivity scheme, the diffusion coefficient characterizing the motion of each particle is a stochastic process evolving in time to account for an underlying slow dynamics that may be due, for instance, to a slowly restructuring matrix or to the fact that each tracer moves in a heterogenous environment, across patches with different physical properties. The previously described superstatistics scenario is recovered in the short-delay time limit [16, 17] of the diffusing diffusivity framework, which makes the latter a more general model for describing the BNG diffusion. After the seminal work of Chubynsky and Slater, various implementations of the diffusing diffusivity scenario have been proposed, some of them leading to exact, closed-form expressions [16, 18, 19]. Intriguingly, the predictions of the aforementioned models take their simplest form in reciprocal space, that is, when expressed in terms of the spatial Fourier transform of the PDF of particle displacements.
This contrasts with the observation that most of the experimental work on BNG diffusion has been performed in direct space by optical microscopy in combination with the particle tracking analysis. The direct space approach is very powerful: it provides direct access to the particle trajectories and derived quantities such as the PDF of particle displacements; moreover, it is often time- and space-resolved, which allows spotting potential spatial heterogeneity and/or non-stationarity of the particle dynamics [11]. On the other hand, ensemble-averaging techniques, such as dynamic light scattering, fluorescence correlation spectroscopy, or differential dynamic microscopy (DDM), can study systems for which the optical signal of a single particle is too weak to be reliably determined in a space- and time-resolved fashion [20, 21]. In particular, DDM works by acquiring and analyzing microscope movies that have been obtained with a variety of contrast mechanisms, including light scattering (similar to dynamic light scattering) and fluorescent emission (similar to fluorescence correlation spectroscopy) [22, 23]. However, while fluorescence correlation spectroscopy probes the particle dynamics on a fixed scale or on a limited selection of different length scales [24, 25] that are small enough to provide a sizeable number of fluctuations in the observed volume, dynamic light scattering and DDM probe the sample dynamics by measuring the relaxation of collective concentration fluctuations at different wave vectors q via the study of the intermediate scattering function (ISF) f(q,Δt). As a matter of fact, measuring the self-ISF fself(q,Δt) over a suitably large wave-vector range is in principle equivalent to a direct determination of the PDF P(Δx,Δt) of particle displacements as the two functions are linked by a spatial Fourier transform operation:
In this study, we use confocal DDM (ConDDM) [36] to characterize the dynamics of small diluted tracers diffusing in a dense matrix of larger colloidal hard spheres with volume fractions above the glass transition. While the same system has been studied previously [37–39], we present here for the first time a fully quantitative analysis of the data in the framework of BNG diffusion, inspired by a previous study [10]. In Ref. [10], the motion of highly diluted tracers in a matrix of suspended larger hard-sphere particles at different concentrations (up to about ϕ = 0.55) was characterized by particle tracking and shown to exhibit BNG diffusion. In contrast, here, we consider much larger volume fractions (above the glass transition), a binary mixture of colloidal particles with a smaller but still significant size disparity (here 0.18 vs. previously [10] 0.13), and we explore a wider time window. Binary mixtures of hard spheres represent a simple model system. Studies on concentrated mixtures revealed interesting dynamical behavior [40–48]. For example, for size ratios 0.1 and 0.2, different glass and gel states occur, in which either both species are dynamically arrested or only the large particles are arrested while the small particles remain mobile within the glass of large particles [43, 45, 49, 50]. In this study, we focus our attention on this last regime (which is sometimes referred to as a “single-glass” [39] state), where small particles behave like diluted tracers exploring a complex, heterogenous, albeit dynamically quasi-arrested environment, which represents a very promising setting for the observation of BNG diffusion.
Indeed, our results confirm that the investigated samples exhibit BNG diffusion, for which we show that the functional form and the scaling properties of the measured ISF are in excellent agreement with those of a recently proposed analytical expression obtained within a “diffusing diffusivity” model [16, 19]. We also build on an approach originally proposed in Refs. [5, 32] to study intracellular and intercellular motility, which we extend here to extract the MSD and the non-Gaussian parameter directly from the experimentally determined ISFs. Finally, we propose a simple model to elucidate the nontrivial connection between self-diffusion of tracer particles—typically probed in real space—and the collective relaxation of the associated density fluctuations, as probed by the ConDDM reciprocal space analysis.
2 Materials and Methods
2.1 Samples
The samples were prepared as in Ref. [37]. Shortly, sterically stabilized polymethylmethacrylate (PMMA) spheres of diameters σl = 3.10 μm (polydispersity 0.07) and σs = 0.56 μm (polydispersity 0.13) are dispersed in a refractive index and density-matching mixture of cis-decalin/cycloheptylbromide to form binary mixtures with different mixing ratios and total volume fractions. The use of a density-matching solvent avoids sedimentation effects on the time- and length-scales probed in our experiments [37]. The smaller particles are fluorescently labeled with nitrobenzoxadiazole. Upon salt (tetrabutylammoniumchloride) addition, this system presents hard-sphere–like interactions [51, 52].
2.2 Confocal Microscopy
Confocal microscopy experiments were performed by using a Nikon A1R-MP confocal scanning unit mounted on a Nikon Ti-U inverted microscope with a 60× Nikon Plan Apo oil immersion objective (NA = 1.40). We acquired 104 images with 512 × 512 pixels (corresponding to 107.5 × 107.5 μm2) at 30 fps by focusing on a plane at a depth of approximately 30 μm from the coverslip. The confocal images were acquired with the maximum pinhole diameter allowed by the microscope, 255 μm. The experiments were performed at a temperature of T = 293 ± 2 K.
2.3 ConDDM Analysis
A DDM analysis of the confocal images was performed as described in Refs. [20, 36]. In brief, we calculated the image structure function
where
2.4 Model-Free Determination of the Mean Square Displacement and of the Non-Gaussian Parameter with ConDDM
As shown explicitly in Section 3.4, the collective ISF f(q,Δt) can be written as the sum of its self-part fself(q,Δt) and its distinct part fdist(q,Δt). In particular, fself(q,Δt) coincides with the Fourier-transform of the self-van Hove function, that is, the PDF P(Δx,Δt) of particle displacements [55]
As long as P(Δx,Δt) is isotropic, fself(q,Δt) depends only on q = |q| and can be expanded in cumulants for q → 0 [28, 56].
where MSD(Δt) = ⟨|Δx(Δt)|2⟩ is the 2D mean square displacement and α2 (Δt) is the 2D non-Gaussian parameter
Inspection of Eq. 3 suggests a strategy to simultaneously access MSD and the non-Gaussian parameter by focusing on the low-q behavior of the self ISF for a fixed time delay Δt, which we implement in our ConDDM analysis. We consider only the q-values and time delays Δt, for which fself(q,Δt) has relaxed by less than 25% (see Figure 1). For each time delay Δt, this condition identifies as an upper bound qu for q. The lower bound qc ≃ 0.9 μm−1 is a cutoff wave vector which is introduced to avoid the artifacts related to the confocal optical sectioning, as described in detail in Section 3.1. If the interval [qc,qu] contains at least fifteen data points, we fit a function of the form a + cq2 + dq4 to log(fself(q,Δt)), obtaining the parameters a, c, and d of the best fitting curve. Finally, we estimate the 2D MSD and non-Gaussian parameter for the considered time delay as MSD = −4c and α2 = 2d/c2, respectively. This procedure can be considered a generalization of the one proposed in Ref. [5].
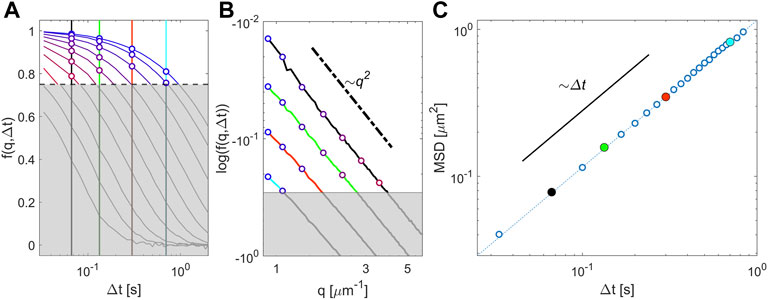
FIGURE 1. Model-free determination of the mean square displacement and non-Gaussian parameter with ConDDM. (A) Representative normalized ISFs as a function of the delay time Δt for different values of the magnitude of the wave vector q (increasing from blue to red). The gray shaded area marks the region lying below the threshold value of 0.75 of the ISFs that we considered for the determination of the MSD. Large circles correspond to the allowed q values, which are found as the intersection of the ISFs and some representative delay times Δt (colored vertical lines) together with the condition on the maximum relaxation. (B) Log–log plot of the ISFs as a function of the magnitude of the wave vector for the same representative delay times Δt of the panel (A). (C) MSD estimated for each delay time as the best fit to the logarithm of the self-ISFs log (fself (q,Δt)) with Eq. 3. Large circles correspond to Δt shown with the same colors in panels (A) and (B). The representative data shown in this figure have been obtained on a diluted (φs < 0.001) suspension of colloidal particles of diameter σ = 0.56 µm, as described in the main text.
3 Results and Discussion
3.1 Brownian and Gaussian Diffusion of Freely Moving Tracer Particles
We first consider a one-component sample, where only the small particles (of diameter σs = 0.56 μm) are present, suspended at a very low volume fraction (ϕs < 0.001) in a density-matching solvent. In this condition, the particles essentially do not interact, and each of them performs an independent Brownian motion. Importantly, in the absence of interactions, one has f(q,Δt) = fself (q,Δt). Supplementary Movie SM1 shows a 10-s-long portion of a longer image acquisition: the fluorescent signal of a single particle is too low compared to the background noise to enable reliable tracking and subsequent reconstruction of the particle trajectories in real space; in contrast, the excellent stability of the fluorescence signal over time and the absence of appreciable bleaching allow for a quantitative analysis with ConDDM [20, 22, 36].
Representative normalized ISFs obtained from the ConDDM analysis are shown in Figure 2A. Rescaling the horizontal axis with q2 (Figure 2B) shows that a simple exponential model f(q,Δt) = e−Γ(q)Δt provides an excellent fit to the data over a wide range of wave vectors. In particular, the obtained relaxation rate Γ(q) displays a quadratic dependence on q for q ≳ 0.9 μm−1, whereas for lower values of q, it deviates significantly from this behavior and tends to saturate to a constant value Γc ≃ 0.1 s−1. As discussed in Ref. [36], this is due to the fact that the thickness lc of the optical section of the confocal microscope sets a characteristic wave vector qc = 1/lc below which, similar to fluorescence correlation spectroscopy, the relaxation of the ISF is dominated by the fluctuation in the number of particles within the optical section; such relaxation occurs with a q-independent characteristic rate
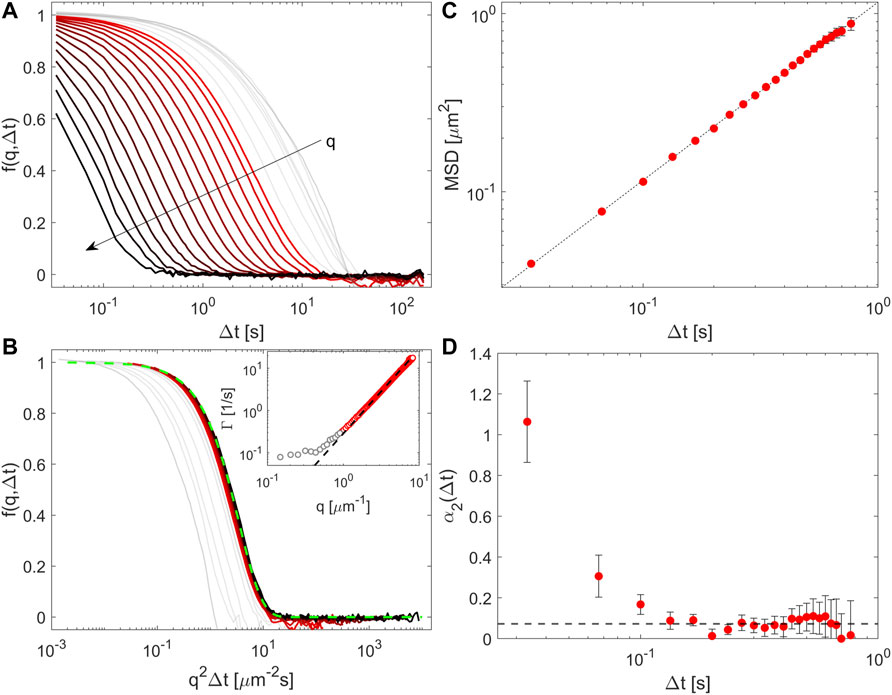
FIGURE 2. ConDDM analysis of small non-interacting colloidal particles. (A) Representative collective ISFs. Gray lines represent ISFs for wave vectors q < qc = 0.9 μm−1 that we exclude from further analysis (see main text for more details); colored lines represent ISFs for different wave vectors q ranging from qc (red) to 7.5 μm−1 (black). (B) Same data of (A) plotted as a function of the rescaled time delay q2Δt. The green dashed line is a simple exponential function
In this q-range, the experimentally determined relaxation rate Γ(q) can be fitted by a homogenous quadratic function D0,aq2, which provides the estimate D0,a = 0.28 ± 0.03 μm2/s for the diffusion coefficient of the particles (Figure 2B, inset). This value can be compared with the result obtained from a linear fit 4D0,bΔt of the MSD (see Methods), which provides the estimate D0,b = 0.29 ± 0.02 μm2/s (Figure 2C). The non-Gaussian parameter α2(Δt), shown in Figure 2D, points to essentially Gaussian dynamics with deviations occurring only for very small time delays. Such deviations are not to be interpreted as non-Gaussian dynamics as they probably originate from the large uncertainty associated with the fact that α2(Δt) is obtained as the ratio of two quantities that become indistinguishably small for Δt → 0 (see Section 2.4).
3.2 Brownian Yet Non-Gaussian Diffusion of Tracer Particles in a Glassy Environment
Once the dynamics of a dilute suspension of small particles diffusing freely is known, we proceed to study these small particles in a dense matrix of larger particles (of diameter σl ≃ 5σs and volume fraction ϕ = 0.60, see Supplementary Movie SM2). The volume fraction of the small particles is ϕs = 0.006. The ISFs obtained with ConDDM at different q-values are shown in Figure 3A. Some curves display a nonzero plateau for t → ∞, which suggests non-ergodicity arising from the inability of the system to fully explore the configuration space during the observation time. As proposed in Ref. [37], this can be easily understood as a consequence of the fact that the small particles can freely move only in the voids left by the large particles, which are almost completely frozen in their positions. Here, we substantiate this picture with a simple model (see Section 3.4) according to which the expression
holds. α(q) is a time-independent non-ergodicity parameter, which reflects the matrix structure (see Eq. 21 for an approximate analytical expression of α(q)). Eq. 5 shows that 1) the collective ISF f (q,Δt) is fully determined by its self-part fself (q,Δt) and 2) the presence of a kinetically arrested matrix introduces a q-dependent plateau α(q).
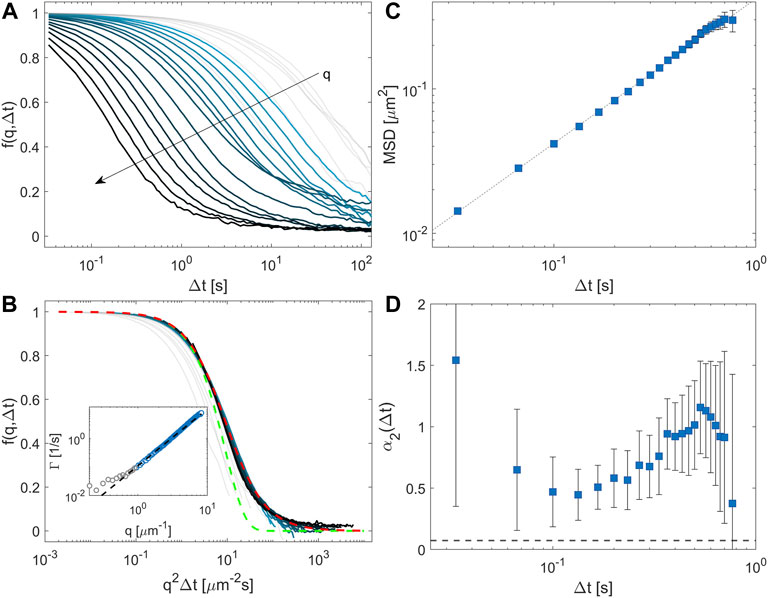
FIGURE 3. ConDDM analysis of small particles exploring a glassy environment (ϕ = 0.60) (A) Representative collective ISFs for different q-values: gray lines represent the ISFs for wave vectors q < qc, whereas ISFs from cyan to black correspond to wave vectors in the range [0.9–7.5] μm−1. (B) Representative self-ISFs for the same q-range of panel (A) plotted as a function of the rescaled time delay q2Δt. The red dashed line corresponds to the Lorentzian-like model
The situation in which small particles can diffuse in the void space of a slowly evolving glassy matrix is compatible with the diffusing diffusivity scenario, in which particles can change their diffusivity by exploring different local environment and whose analytical predictions [16, 18, 19] can be cast in reciprocal space for a diffusion coefficient D that fluctuates with a characteristic correlation time τ0. By introducing Γ(q) = Dq2 and
where n is a free parameter defining the dimensionality of the stochastic process of D. The mean square displacement MSD can be then evaluated as follows
showing a linear dependence with time Δt. Inserting Eq. 6 with n = 2 in Eq. 5 provides a model that can be fit to our experimental collective ISF. The fit is performed at fixed q, the fitting parameters being Γ, τ0, and α. The results show that the ISFs are well-described by the model (Supplementary Figure S2A) but point out that our experiments were too short to capture the characteristic time τ0 of the fluctuating diffusive coefficient (Supplementary Figure S2B), which is expected to be a q-independent quantity.
For our particular experiments, it is, thus, useful to focus on the two limiting regimes (for n = 2):
• Γ(q)τ0 ≫ 1, in which the density fluctuations relax faster than the characteristic fluctuation time of the diffusion coefficient, and one has
• Γ(q)τ0 ≪ 1, in which the diffusion coefficient evolves faster than the relaxation of the density fluctuations
In these two regimes, the self-ISF exhibits the same scaling properties fself(q,Δt) = g (q2Δt) but distinct functional forms.
We note that the second regime corresponds to ordinary diffusion, where the PDF of 2D particle displacements corresponding to the exponentially relaxing ISF in Eq. 9 is a Gaussian function
On the other hand, the PDF corresponding to the first regime, which can be obtained as the 2D Fourier transform of the self-ISF in Eq. 8, is
where K0 is the modified Bessel function of the second kind of order 0 [57]. As it can be appreciated from Supplementary Figure S1 in ESI, where representative curves are shown, in this case, the PDF displays strongly non-Gaussian, exponential-like tails.
The results shown in ESI Supplementary Figure S2, suggest adopting Eq. 8 as a model for the self-ISF. Such a model is in excellent agreement with our experiments (Figure 3). In particular, the collective ISFs (Figure 3A) collapse well on a single master curve when converted to the self-ISF and plotted as a function of the rescaled time q2Δt (Figure 3B). The inset of Figure 3B shows the extracted q-dependent relaxation rate, which can be fitted by Γ(q) = D60,aq2 to provide a diffusion coefficient D60,a = (11 ± 1) × 10–2 μm2/s. This diffusive scaling along with the Lorentzian-like fitting model fself(q,Δt) = [1 + Γ(q)Δt]−1 indicates that although the small particles exhibit Brownian diffusion, the probability distribution of the displacements is no longer Gaussian.
To further support our findings, we show in Figures 3C,D the particle MSD and the non-Gaussian parameter extracted from the self-ISFs, respectively. The MSD displays a linear scaling with a diffusion coefficient D60,b = (10.5 ± 0.5) × 10–2 μm2/s, which is in agreement with D60,a. Moreover, the non-Gaussian parameter α2 now is significantly different from zero and hence points to non-Gaussian dynamics. α2 was obtained, according to Eq. 3, by considering the first two terms of the cumulant expansion of the ISF. In principle, the expansion could be extended to the calculation of cumulants (or moments) of arbitrary order, which can then be used to retrieve the full PDF of particle displacements. In practice, the noise on the data rapidly makes this procedure numerically extremely unstable, rendering the determination of higher-order cumulants very challenging. An alternative strategy to retrieving direct-space information consists in adopting a suitable analytical model for the ISFs (like the ones in Eqs 6–8), determining the free parameters via a fitting procedure, and estimating the PDF as the (analytically or numerically evaluated) Fourier transform of this model function. According to the aforementioned discussion, the application of this procedure to our data results in a prediction for the PDF of particle displacements in the form of Eq. 11, which is characterized by exponential-like tails (see Supplementary Figure S1). This result is in slight disagreement with the findings of Ref. [10], where the motion of diluted small particles diffusing in suspensions of larger spheres is investigated. In that case, the PFDs of particle displacements were found to show consistent deviations from Gaussianity and robust diffusive scaling but without a clear indication of an exponential tail. On the one hand, this discrepancy can originate from the fact that in Ref. [10] the large particles were always in a fluid-like state, and thus a clear-cut separation of the time scales associated with tracer diffusion and structural rearrangement of the matrix was not present. Moreover, compared to Ref. [10], in our experiments, the unbalance between the size of the small and large particles is less pronounced. As a consequence, in the present case, the small particles move within the relatively narrower “voids” formed by the large spheres, and this is expected to enhance hydrodynamic coupling and sensitivity to the local environment.
3.3 Tuning the Properties of the Glassy Matrix
When the volume fraction ϕ of the large particles is increased, we expect the dynamics of the small particles to change. This expectation is only partially confirmed by a ConDDM analysis of the movies acquired for ϕ = 0.60, ϕ = 0.61, and ϕ = 0.62 (Figure 4). The relative volume fraction of the small particles is xs = ϕs/ϕ = 0.01 for all cases, meaning that ϕs is slightly different for the three samples. Most of the features outlined in the previous section for ϕ = 0.60 are also observed for the higher volume fractions. In particular, the self-ISFs for ϕ = 0.61 and 0.62 show a scaling similar to the one of ϕ = 0.60 when plotted as a function of the rescaled time q2Δt (Figure 4A). The relaxation rates obtained from the best fitting curves using the model in Eqs 5, 8 for the three different concentrations are shown in Figure 4B, in which we observe a modest change of the diffusion coefficient for this narrow range of volume fractions. This result is confirmed by MSDs (Figure 4D) and non-Gaussian parameters (Figure 4E), which also show minor changes as a function of the volume fraction.
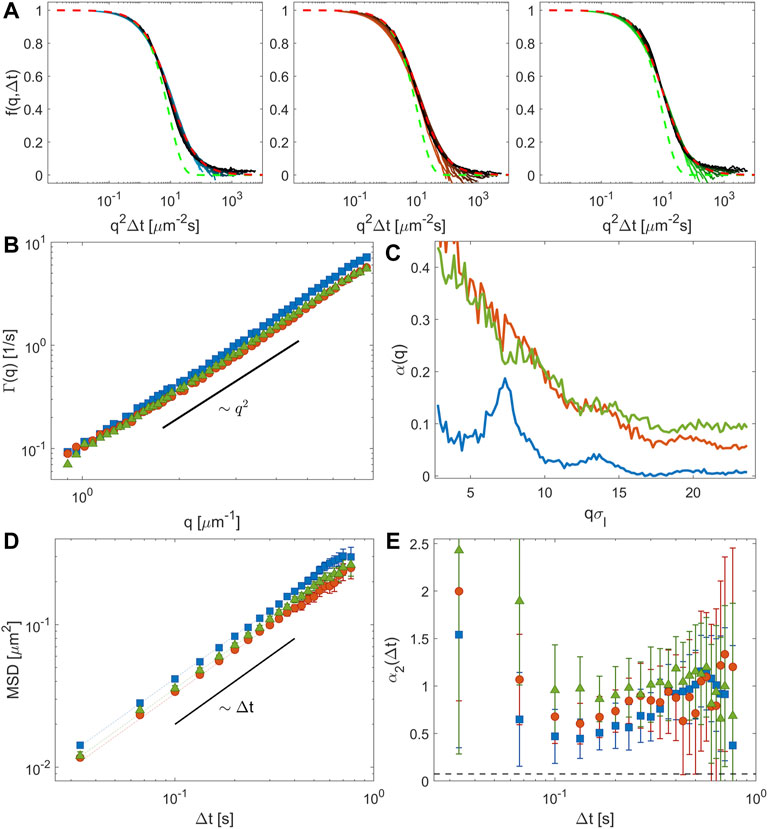
FIGURE 4. Changes in the dynamics of the small particles upon increasing the volume fraction of the glassy matrix from ϕ = 0.60 (blue), to ϕ = 0.61 (red), and ϕ = 0.62 (green). (A) Representative self-ISFs plotted as a function of the rescaled time q2Δt. The red dashed lines represent the model
The most evident difference between the experiments performed at different ϕ is found in the magnitude of α(q) which for ϕ = 0.61 and ϕ = 0.62 is significantly larger than for ϕ = 0.60 (Figure 4C). The fact that α(q) is significantly different from zero even in the high-q limit implies that the small particles are not free to diffuse, even not over small distances. As discussed in more detail in Section 3.4, this suggests the presence of an immobile fraction (of about 6% and 10% for ϕ = 0.61 and ϕ = 0.62, respectively) of small particles stuck in the voids of the matrix. The appearance of an immobile fraction of particles upon increasing the volume fraction can be qualitatively appreciated in Figure 5, where we show the minimum projection of the image sequence for ϕ = [0.60, 0.61, 0.62] and in which the stuck small particles appear as bright spots. This effect was not observed in previously published molecular dynamics simulations [37], which indicated that small-particle localization is not to be expected for size ratio δ < δc ≃ 0.35, for all the investigated volume fractions. Therefore, the observed increase in the number of stuck particles may be attributed to system aging or particle aggregation, which would both prevent particles from freely exploring the matrix.
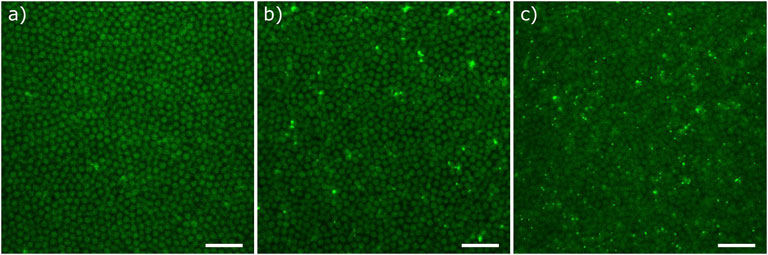
FIGURE 5. Highlighting the immobile particles. The minimum intensity projection of the image sequence for ϕ = 0.60 (A), ϕ = 0.61 (B), and ϕ = 0.62 (C) shows an increasing number of bright spots, indicating that an increasing fraction of small particles becomes immobile for increasing ϕ. The scale bars correspond to 15 μm.
3.4 Approximate Calculation of the Non-Ergodicity Factor
As demonstrated in Refs. [37, 39], the binary mixtures considered in Section 3.2 are in a “single-glass” state, that is, the dynamics of the large particles is kinetically arrested, whereas the small particles are not arrested and remain free to diffuse over arbitrarily large distances. Therefore, the self-dynamics of the small particles is expected to be ergodic. In this condition, the glassy nature of the matrix formed by the large particles induces a decoupling between the self and the collective ISF of the small particles: while fself(q,Δt) can completely relax to zero for Δt → ∞; the f(q,Δt) displays a nonzero plateau, usually referred to as the non-ergodicity factor α(q), which reflects the spatial modulations in the collective dynamics imposed by the partially frozen structure of the large spheres [39].
While a detailed theoretical discussion of these aspects is beyond the scope of this study (see, e.g., Refs. [39, 49] for a thorough treatment), we present here a simplified calculation aimed at 1) providing a simple physical picture for the emergence of a finite non-ergodicity factor, 2) providing a prediction for the q-dependent non-ergodicity factor to be compared, at least qualitatively, to the experimental results, and 3) showing that, at least for highly diluted tracers, the self-part of the ISF can be reliably extracted from the collective ISF.
We start with the definition of the (unnormalized) collective ISF F(q,Δt) of the small particles
where
where
and
Under the hypotheses that 1) the motion of the small particles takes place in the presence of a completely frozen matrix of larger particles and 2) both the volume fraction ϕs of the small particles and the ratio δ = σs/σl between the diameters of the small and large particles are very small, the space accessible to the small particles essentially coincides with the portion left free by the large ones; since the effective volume fraction ϕs/(1 − ϕl) of the small particles within the voids is very small, positional correlations between distinct small particles are negligible. The time-averaged density distribution
In this expression, V0 indicates the total volume, pl(x) is the characteristic function of a sphere of diameter σl, the symbol * indicates the convolution operation, and the prefactor Ns/V0 (1 − ϕl) is determined by imposing the normalization condition
Using Eq. 16, the power spectrum
Plugging this expression in Eq. 17 we finally get
where δ is the previously introduced ratio between the radius of the small and large particles (δ = 0.18 in the present case) and xs = ϕs/ϕ is the previously introduced relative fraction of the small particles (xs = 0.01 in our case). Combining Eq. 19 with Eq. 13, we obtain the following expression for the normalized ISF f(q,Δt) = F(q,Δt)/F(q, 0)
where we have introduced the “non-ergodicity factor”
Eqs 20, 21 show that even in the absence of explicit interactions between the moving particles, the presence of fixed obstacles introduces a q-dependent, non-ergodicity factor in the normalized ISF.
In order to compare the theoretical expression in Eq. 21 with the experimentally determined α(q), we need an estimate for the static structure factor Sl(q) of the large particles. To this end, we have used the code described in Ref. [58] and freely available at https://github.com/VasiliBaranov/packing-generation to generate different configurations of randomly closed packed hard-spheres from which we evaluated the three-dimensional (3D) static structure factor. As a consistency check, we have also calculated from the same data a two-dimensional (2D) structure factor, obtained by considering the centers of the particles included in slices of height Δz = 1 μm, similar to the thickness lc of the optical section of our confocal microscope. This function can be directly compared to the experimentally determined 2D structure-function of the large spheres, which was obtained by performing the minimum projection of the image sequence (see Figure 6A) and by locating the positions of the centers of the large particles using the particle-tracking software freely available at https://github.com/dsseara/microrheology [59]. As it can be appreciated from Figure 6B, the experimental and the simulated 2D static structure functions are in excellent agreement, confirming the reliability of our simulation. In Figure 6C, the theoretical non-ergodicity factor calculated inserting in Eq. 21 the simulated 3D Sl(q) and the theoretical form factor Pl(q) for a sphere of radius σl is compared with the one obtained by fitting Eq. 5 to the collective ISF. A different estimate for α(q), obtained by evaluating the ISFs for the large delay time Δt = 104 s (as carried out in Ref. [39]), is also reported. We observe that despite the rather crude approximations leading to Eq. 21, the overall agreement between the theoretical prediction and experimental data is qualitatively good, and only for qσl ≲ 4 (corresponding to q ≲ 1.3 μm−1), a more systematic deviation is observed. This could be due to the fact that while the simulated α(q) is computed considering a fully three-dimensional matrix, for low q, the experimentally estimated α(q) could be affected by the finite thickness of the confocal optical section.
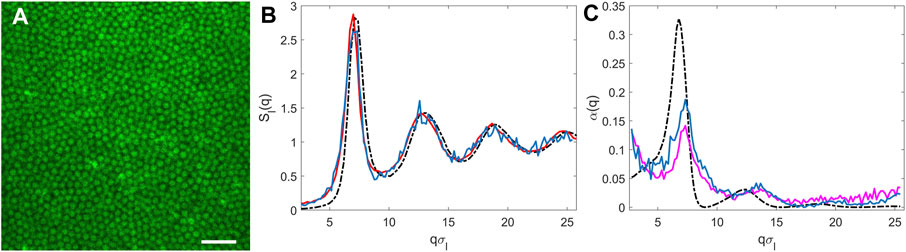
FIGURE 6. Structure factor of the large particles and estimation of the non-ergodicity factor for ϕ = 0.60. (A) Minimum projection of the image sequence. The scale bar corresponds to 15 μm. (B) Experimental 2D structure factor (blue), simulated 2D structure factor (red), and simulated 3D structure factor (dash-dotted black) of the large spheres. (C) non-ergodicity factor, as obtained by the fit of the collective ISF using Eq. 6 for fself (q,Δt) (blue), by evaluating the ISF at a fixed time delay Δt = 104 s as reported in [39] (magenta) and from simulated data using Eq. 21 (dashed-dotted black).
Based on Eq. 21, we expect that α(q → ∞) → 0 because Pl(q → ∞) → 0. In Section 3.3, however, we have seen that, at least for the samples with ϕ > 0.60, α(q) does not decay to zero. This was attributed to the presence of a small fraction ϕs,i of immobile small particles. The simplest way to account for these particles is to introduce the change α(q) → α(q) + (1 − α(q))ϕs,i. This change captures the observed behavior of α(q) for large q (see Figure 4C) but not for wave vectors smaller than the structural peak of the large particles qσl < 6, suggesting that further contributions should be incorporated in Eq. 16. This case illustrates the need for extensions of Eq. 5, which is strictly valid only in the idealized case of infinitely diluted and infinitely small particles diffusing in a perfectly frozen matrix of immobile large particles. For example, if the finite size of the particles becomes relevant, the expression given in Eq. 16 must be modified in order to account for the additional excluded volume. Similar changes need to be introduced whenever the positional fluctuations of the large particles or the interactions between the small particles need to be taken into account.
4 Conclusion
In this study, we explored for the first time the possibility of probing BNG dynamics directly in reciprocal space, without relying on single-particle tracking analysis performed in direct space. We used ConDDM to investigate the collective dynamics of diluted tracer particles diffusing in dense glassy matrices of larger colloidal spheres. The non-ergodicity of the collective dynamics of the small particles, which is induced by the structure of the frozen matrix, is accounted for by a simple model for the ISF (Eq. 5), enabling to isolate the contribution of the self-diffusive dynamics. The q-dependent relaxation rate of the obtained self-ISFs displays a robust diffusive scaling Γ(q) ∼ Dq2, while the decay of the self-ISFs is well-captured by a Lorentzian model, in agreement with the predictions of recent diffusing diffusivity theories in the limit where the correlation time τ0 of diffusivity fluctuations is large1 [16, 19].
According to the diffusing diffusivity scheme, in a static heterogenous environment, the evolution over time of the diffusion coefficient characterizing the mobility of each particle is caused by its random motion across regions with different physical properties [15]. In our system, this process would correspond to the exploration by a tracer particle of different “voids” between the large spheres, each of which with different local hydrodynamics and in which the particle is expected to display different mobility [10]. In this interpretation, the correlation time τ0 would be the time needed by a particle to visit a few different voids. In our experimental conditions, the possibility of observing this relatively slow process appears prevented by the finite thickness lc of the confocal optical section, which imposes a cutoff
This behavior was consistently observed across the whole range of investigated volume fractions 0.60 ≤ ϕ ≤ 0.62, which should span the “single-glass” region of the phase diagram of our binary mixture [37, 39]. By increasing ϕ, we observed a moderate but significant increase of the non-ergodicity factor α(q), indicating that an increasing fraction of small particles (up to about 10% for ϕ = 0.62) is immobile or strongly localized. This effect could be due to system aging or particle aggregation, which would both inhibit the motion of the small particles through the matrix.
Taken together, these results indicate that our reciprocal space–based approach represents an effective strategy to probe fast, anomalous dynamics in a crowded environment, overcoming the limitations intrinsic to single-particle tracking and enabling direct comparison with theoretical predictions. One of the most promising applications of this method could be the investigation of the crossover between non-Gaussian to Gaussian behavior as predicted by diffusing diffusivity theories. For example, recent results on periodically sheared yield-stress materials [53] showed the presence of shear-induced diffusion along with a Lorentzian-like relation for the ISF and non-Gaussian PDF of the particle displacements, at least for a relatively short observation time. Reciprocal space investigation of the long-time dynamics of tracers embedded in yield stress-material, while subjected to oscillatory shear deformation, may be a promising way to assess and validate diffusing diffusivity models.
Another interesting application could be the investigation of the conditions governing the transition between BNG diffusion and (non-Gaussian) subdiffusion. Entangled actin networks, a widely studied model system, could represent a promising candidate along this line, as, by tuning the ratio between mesh size and tracer particle size, and they enable exploring a variety of transport regimes [60] from ordinary diffusion to BNG diffusion [8] and from fractional Brownian motion to continuous time random walk [61].
Data Availability Statement
The raw data supporting the conclusion of this article will be made available by the authors, without undue reservation.
Author Contributions
FG and RC conceived the project. ML and SE coordinated the experimental activity. TS performed experiments. MB analyzed the data. FG, MB, and RC wrote the first draft of the manuscript. All authors contributed to manuscript revision and read and approved the submitted version.
Funding
This work has been supported by the Associazione Italiana per la Ricerca sul Cancro (AIRC) to FG (MFAG#22083); the University of Milan to FG (Bando Seal of Excellence (SoE) SEED 2020); and the Consorzio per lo Sviluppo dei Sistemi a Grande Interfase (CSGI) to ML. Open access funding was generously provided by University of Vienna in the framework of an Open Access publishing agreement with Frontiers journals.
Conflict of Interest
The authors declare that the research was conducted in the absence of any commercial or financial relationships that could be construed as a potential conflict of interest.
Publisher’s Note
All claims expressed in this article are solely those of the authors and do not necessarily represent those of their affiliated organizations or those of the publisher, the editors, and the reviewers. Any product that may be evaluated in this article, or claim that may be made by its manufacturer, is not guaranteed or endorsed by the publisher.
Acknowledgments
RC acknowledges useful discussions with Vittoria Sposini.
Supplementary Material
The Supplementary Material for this article can be found online at: https://www.frontiersin.org/articles/10.3389/fphy.2022.893777/full#supplementary-material
Footnotes
1We can safely exclude that the observed non-Gaussian behavior could be even partially attributed to the size dispersity of the tracers as they display an almost “ideal” behavior when freely diffusing in the solvent in the absence of obstacles (as demonstrated in Section 3.1).
References
1. Höfling F, Franosch T. Anomalous Transport in the Crowded World of Biological Cells. Rep Prog Phys (2013) 76:046602. doi:10.1088/0034-4885/76/4/046602
2. Metzler R, Jeon J-H, Cherstvy AG, Barkai E. Anomalous Diffusion Models and Their Properties: Non-stationarity, Non-ergodicity, and Ageing at the Centenary of Single Particle Tracking. Phys. Chem. Chem. Phys. (2014) 16:24128–64. doi:10.1039/c4cp03465a
3. Chaudhuri P, Berthier L, Kob W. Universal Nature of Particle Displacements Close to Glass and Jamming Transitions. Phys. Rev. Lett. (2007) 99:060604. doi:10.1103/PhysRevLett.99.060604
4. Valentine MT, Kaplan PD, Thota D, Crocker JC, Gisler T, Prud’homme RK, et al. Investigating the Microenvironments of Inhomogeneous Soft Materials with Multiple Particle Tracking. Phys. Rev. E (2001) 64:061506. doi:10.1103/PhysRevE.64.061506
5. Giavazzi F, Malinverno C, Scita G, Cerbino R. Tracking-free Determination of Single-Cell Displacements and Division Rates in Confluent Monolayers. Front. Phys. (2018) 6:120. doi:10.3389/fphy.2018.00120
6. Tamborini E, Cipelletti L, Ramos L. Plasticity of a Colloidal Polycrystal under Cyclic Shear. Phys. Rev. Lett. (2014) 113:078301. doi:10.1103/PhysRevLett.113.078301
7. Giavazzi F, Trappe V, Cerbino R. Multiple Dynamic Regimes in a Coarsening Foam. J. Phys Condens. Matter (2020) 33:024002. doi:10.1088/1361-648x/abb684
8. Wang B, Anthony SM, Bae SC, Granick S. Anomalous yet Brownian. Proc. Natl. Acad. Sci. U.S.A. (2009) 106:15160–4. doi:10.1073/pnas.0903554106
9. Wang B, Kuo J, Bae SC, Granick S. When Brownian Diffusion is not Gaussian. Nat Mater (2012) 11:481–5. doi:10.1038/nmat3308
10. Guan J, Wang B, Granick S. Even Hard-Sphere Colloidal Suspensions Display Fickian yet Non-Gaussian Diffusion. ACS Nano (2014) 8:3331–6. doi:10.1021/nn405476t
11. Chakraborty I, Roichman Y. Disorder-induced Fickian, yet Non-Gaussian Diffusion in Heterogeneous Media. Phys. Rev. Res (2020) 2:022020. doi:10.1103/physrevresearch.2.022020
12. Pastore R, Ciarlo A, Pesce G, Greco F, Sasso A. Rapid Fickian yet Non-Gaussian Diffusion after Subdiffusion. Phys. Rev. Lett. (2021) 126:158003. doi:10.1103/physrevlett.126.158003
13. Beck C, Cohen EGD. Superstatistics. Phys A Stat Mech its Appl (2003) 322:267–75. doi:10.1016/s0378-4371(03)00019-0
14. Hwang J, Kim J, Sung BJ. Dynamics of Highly Polydisperse Colloidal Suspensions as a Model System for Bacterial Cytoplasm. Phys. Rev. E (2016) 94:022614. doi:10.1103/PhysRevE.94.022614
15. Chubynsky MV, Slater GW. Diffusing Diffusivity: A Model for Anomalous, yet Brownian, Diffusion. Phys. Rev. Lett. (2014) 113:098302. doi:10.1103/PhysRevLett.113.098302
16. Chechkin AV, Seno F, Metzler R, Sokolov IM. Brownian yet Non-Gaussian Diffusion: From Superstatistics to Subordination of Diffusing Diffusivities. Phys. Rev. X (2017) 7:021002. doi:10.1103/physrevx.7.021002
17. Sposini V, Chechkin AV, Seno F, Pagnini G, Metzler R. Random Diffusivity from Stochastic Equations: Comparison of Two Models for Brownian yet Non-Gaussian Diffusion. New J. Phys. (2018) 20:043044. doi:10.1088/1367-2630/aab696
18. Jain R, Sebastian KL. Diffusion in a Crowded, Rearranging Environment. J. Phys. Chem. B (2016) 120:3988–92. doi:10.1021/acs.jpcb.6b01527
19. Jain R, Sebastian KL. Diffusing Diffusivity: a New Derivation and Comparison with Simulations. J Chem Sci (2017) 129:929–37. doi:10.1007/s12039-017-1308-0
20. Cerbino R, Trappe V. Differential Dynamic Microscopy: Probing Wave Vector Dependent Dynamics with a Microscope. Phys. Rev. Lett. (2008) 100:188102. doi:10.1103/physrevlett.100.188102
21. Cerbino R. Quantitative Optical Microscopy of Colloids: The Legacy of Jean Perrin. Curr Opin Colloid & Interface Sci (2018) 34:47–58. doi:10.1016/j.cocis.2018.03.003
22. Giavazzi F, Brogioli D, Trappe V, Bellini T, Cerbino R. Scattering Information Obtained by Optical Microscopy: Differential Dynamic Microscopy and beyond. Phys Rev E Stat Nonlin Soft Matter Phys (2009) 80:031403. doi:10.1103/PhysRevE.80.031403
23. Giavazzi F, Cerbino R. Digital Fourier Microscopy for Soft Matter Dynamics. J. Opt. (2014) 16:083001. doi:10.1088/2040-8978/16/8/083001
24. Banks DS, Tressler C, Peters RD, Höfling F, Fradin C. Characterizing Anomalous Diffusion in Crowded Polymer Solutions and Gels over Five Decades in Time with Variable-Lengthscale Fluorescence Correlation Spectroscopy. Soft matter (2016) 12:4190–203. doi:10.1039/c5sm01213a
25. Stolle MDN, Fradin C. Anomalous Diffusion in Inverted Variable-Lengthscale Fluorescence Correlation Spectroscopy. Biophys J (2019) 116:791–806. doi:10.1016/j.bpj.2019.01.024
26. Cerbino R, Cicuta P. Perspective: Differential Dynamic Microscopy Extracts Multi-Scale Activity in Complex Fluids and Biological Systems. J Chem Phys (2017) 147:110901. doi:10.1063/1.5001027
27. Cerbino R, Giavazzi F, Helgeson ME. Differential Dynamic Microscopy for the Characterization of Polymer Systems. J Polym Sci (2021) 60:1079. doi:10.1002/pol.20210217
28. Bayles AV, Squires TM, Helgeson ME. Probe Microrheology without Particle Tracking by Differential Dynamic Microscopy. Rheol Acta (2017) 56:863–9. doi:10.1007/s00397-017-1047-7
29. Edera P, Bergamini D, Trappe V, Giavazzi F, Cerbino R. Differential Dynamic Microscopy Microrheology of Soft Materials: A Tracking-free Determination of the Frequency-dependent Loss and Storage Moduli. Phys. Rev. Mater (2017) 1:073804. doi:10.1103/PhysRevMaterials.1.073804
30. Escobedo-Sánchez M, Segovia-Gutiérrez J, Zuccolotto-Bernez A, Hansen J, Marciniak C, Sachowsky K, et al. Microliter Viscometry Using a Bright-Field Microscope: η-DDM. Soft Matter (2018) 14:7016–25. doi:10.1039/C8SM00784E
31. Drechsler M, Giavazzi F, Cerbino R, Palacios IM. Active Diffusion and Advection in Drosophila Oocytes Result from the Interplay of Actin and Microtubules. Nat Commun (2017) 8:1520–11. doi:10.1038/s41467-017-01414-6
32. Fajner V, Giavazzi F, Sala S, Oldani A, Martini E, Napoletano F, et al. Hecw Controls Oogenesis and Neuronal Homeostasis by Promoting the Liquid State of Ribonucleoprotein Particles. Nat Commun (2021) 12:5488–19. doi:10.1038/s41467-021-25809-8
33. Burla F, Sentjabrskaja T, Pletikapic G, Van Beugen J, Koenderink GH. Particle Diffusion in Extracellular Hydrogels. Soft Matter (2020) 16:1366–76. doi:10.1039/c9sm01837a
34. Wulstein DM, Regan KE, Garamella J, McGorty RJ, Robertson-Anderson RM. Topology-dependent Anomalous Dynamics of Ring and Linear DNA Are Sensitive to Cytoskeleton Crosslinking. Sci Adv (2019) 5:eaay5912. doi:10.1126/sciadv.aay5912
35. Regan K, Wulstein D, Rasmussen H, McGorty R, Robertson-Anderson RM. Bridging the Spatiotemporal Scales of Macromolecular Transport in Crowded Biomimetic Systems. Soft Matter (2019) 15:1200–9. doi:10.1039/c8sm02023j
36. Lu PJ, Giavazzi F, Angelini TE, Zaccarelli E, Jargstorff F, Schofield AB, et al. Characterizing Concentrated, Multiply Scattering, and Actively Driven Fluorescent Systems with Confocal Differential Dynamic Microscopy. Phys. Rev. Lett. (2012) 108:218103. doi:10.1103/physrevlett.108.218103
37. Sentjabrskaja T, Zaccarelli E, De Michele C, Sciortino F, Tartaglia P, Voigtmann T, et al. Anomalous Dynamics of Intruders in a Crowded Environment of Mobile Obstacles. Nat Commun (2016) 7:11133–8. doi:10.1038/ncomms11133
38. Laurati M, Sentjabrskaja T, Ruiz-Franco J, Egelhaaf SU, Zaccarelli E. Different Scenarios of Dynamic Coupling in Glassy Colloidal Mixtures. Phys. Chem. Chem. Phys. (2018) 20:18630–8. doi:10.1039/c8cp02559b
39. Lázaro-Lázaro E, Perera-Burgos JA, Laermann P, Sentjabrskaja T, Pérez-Ángel G, Laurati M, et al. Glassy Dynamics in Asymmetric Binary Mixtures of Hard Spheres. Phys. Rev. E (2019) 99:042603. doi:10.1103/PhysRevE.99.042603
40. Bosse J, Kaneko Y. Self-diffusion in Supercooled Binary Liquids. Phys. Rev. Lett. (1995) 74:4023–6. doi:10.1103/physrevlett.74.4023
41. Williams SR, Van Megen W. Motions in Binary Mixtures of Hard Colloidal Spheres: Melting of the Glass. Phys Rev E Stat Nonlin Soft Matter Phys (2001) 64:041502. doi:10.1103/PhysRevE.64.041502
42. Lynch JM, Cianci GC, Weeks ER. Dynamics and Structure of an Aging Binary Colloidal Glass. Phys Rev E Stat Nonlin Soft Matter Phys (2008) 78:031410. doi:10.1103/PhysRevE.78.031410
43. Juárez-Maldonado R, Medina-Noyola M. Theory of Dynamic Arrest in Colloidal Mixtures. Phys Rev E Stat Nonlin Soft Matter Phys (2008) 77:051503. doi:10.1103/PhysRevE.77.051503
44. Voigtmann T, Horbach J. Double Transition Scenario for Anomalous Diffusion in Glass-Forming Mixtures. Phys. Rev. Lett. (2009) 103:205901. doi:10.1103/physrevlett.103.205901
45. Hendricks J, Capellmann R, Schofield AB, Egelhaaf SU, Laurati M. Different Mechanisms for Dynamical Arrest in Largely Asymmetric Binary Mixtures. Phys Rev E Stat Nonlin Soft Matter Phys (2015) 91:032308. doi:10.1103/PhysRevE.91.032308
46. Sentjabrskaja T, Laurati M, Egelhaaf SU. One- and Two-Component Colloidal Glasses under Transient Shear. Eur. Phys. J. Spec. Top. (2017) 226:3023–37. doi:10.1140/epjst/e2017-70076-0
47. Moreno AJ, Colmenero J. Relaxation Scenarios in a Mixture of Large and Small Spheres: Dependence on the Size Disparity. J Chem Phys (2006) 125:164507. doi:10.1063/1.2361286
48. Narumi T, Franklin SV, Desmond KW, Tokuyama M, Weeks ER. Spatial and Temporal Dynamical Heterogeneities Approaching the Binary Colloidal Glass Transition. Soft Matter (2011) 7:1472–82. doi:10.1039/c0sm00756k
49. Voigtmann T. Multiple Glasses in Asymmetric Binary Hard Spheres. Europhys. Lett. (2011) 96:36006. doi:10.1209/0295-5075/96/36006
50. Jia D, Cheng H, Han CC. Interplay between Caging and Bonding in Binary Concentrated Colloidal Suspensions. Langmuir (2018) 34:3021–9. doi:10.1021/acs.langmuir.7b03965
51. Yethiraj A, van Blaaderen A. A Colloidal Model System with an Interaction Tunable from Hard Sphere to Soft and Dipolar. Nature (2003) 421:513–7. doi:10.1038/nature01328
52. Royall CP, Poon WCK, Weeks ER. In Search of Colloidal Hard Spheres. Soft Matter (2013) 9:17–27. doi:10.1039/c2sm26245b
53. Edera P, Brizioli M, Zanchetta G, Petekidis G, Giavazzi F, Cerbino R. Deformation Profiles and Microscopic Dynamics of Complex Fluids during Oscillatory Shear Experiments. Soft Matter (2021) 17:8553–66. doi:10.1039/d1sm01068a
54. Cerbino R, Piotti D, Buscaglia M, Giavazzi F. Dark Field Differential Dynamic Microscopy Enables Accurate Characterization of the Roto-Translational Dynamics of Bacteria and Colloidal Clusters. J. Phys Condens. Matter (2017) 30:025901. doi:10.1088/1361-648x/aa9bc5
55. Hansen JP, McDonald IR. Theory of Simple Liquids: With Applications to Soft Matter. Cambridge, MA, USA: Academic Press (2013).
56. van Veluwen A, Lekkerkerker HNW. Non-Gaussian Behavior of the Displacement Statistics of Interacting Colloidal Particles. Phys. Rev. A (1988) 38:3758–63. doi:10.1103/physreva.38.3758
57. Papoulis A. Systems and Transforms with Applications in Optics. New York, NY, USA: McGraw-Hill Series in System Science (1968).
58. Baranau V, Tallarek U. Random-close Packing Limits for Monodisperse and Polydisperse Hard Spheres. Soft Matter (2014) 10:3826–41. doi:10.1039/c3sm52959b
59. Pelletier V, Gal N, Fournier P, Kilfoil ML. Microrheology of Microtubule Solutions and Actin-Microtubule Composite Networks. Phys. Rev. Lett. (2009) 102:188303. doi:10.1103/PhysRevLett.102.188303
60. Wong IY, Gardel ML, Reichman DR, Weeks ER, Valentine MT, Bausch AR, et al. Anomalous Diffusion Probes Microstructure Dynamics of Entangled F-Actin Networks. Phys. Rev. Lett. (2004) 92:178101. doi:10.1103/PhysRevLett.92.178101
Keywords: non-Gaussian diffusion, differential dynamic microscopy, colloidal glasses, diffusion in crowded environments, quantitative microscopy, diffusing diffusivity
Citation: Brizioli M, Sentjabrskaja T, Egelhaaf SU, Laurati M, Cerbino R and Giavazzi F (2022) Reciprocal Space Study of Brownian Yet Non-Gaussian Diffusion of Small Tracers in a Hard-Sphere Glass. Front. Phys. 10:893777. doi: 10.3389/fphy.2022.893777
Received: 10 March 2022; Accepted: 19 April 2022;
Published: 01 June 2022.
Edited by:
Vlasis G. Mavrantzas, University of Patras, GreeceReviewed by:
Andrey Cherstvy, University of Potsdam, GermanyRae M. Robertson-Anderson, University of San Diego, United States
Copyright © 2022 Brizioli, Sentjabrskaja, Egelhaaf, Laurati, Cerbino and Giavazzi. This is an open-access article distributed under the terms of the Creative Commons Attribution License (CC BY). The use, distribution or reproduction in other forums is permitted, provided the original author(s) and the copyright owner(s) are credited and that the original publication in this journal is cited, in accordance with accepted academic practice. No use, distribution or reproduction is permitted which does not comply with these terms.
*Correspondence: Roberto Cerbino, cm9iZXJ0by5jZXJiaW5vQHVuaXZpZS5hYy5hdA==; Fabio Giavazzi, ZmFiaW8uZ2lhdmF6emlAdW5pbWkuaXQ=