- 1Nanyang Technopreneurship Center, Nanyang Technological University, Singapore, Singapore
- 2School of Economics and Management, Fuzhou University, Fuzhou, China
- 3Ansteel Company Limited Cold-Rolling Silicon Steel Mill, Anshan, China
- 4School of Economics and Management, Tsinghua University, Beijing, China
- 5Department of Science and Technology, Fuzhou University, Fuzhou, China
Patent is an important embodiment of innovation. Before patent application, many people will check a patent application process on the Internet to understand the steps of a patent application. In fact, these people’s search is also a means to understand whether innovative enterprises or individuals imply the importance of innovation. It has become a new crucial problem to obtain more information about time-series data. Research has found that the concept of VG can provide deeper information in time-series data so that it can understand the information of patent applications more comprehensively. After analyzing the data from 1 January 2011 to 31 December 2018, we find: i) there are very few peaks and valleys, and 80% of searches are in the normal range. ii) according to the central value of the ranking, it can be found that the peaks of the annual patent application search times time series occurred in December last year, after January, February of this year or after August-October, and iii) after clustering the time series data, we find that the attention of people shows noticeable segmentation effect.
1 Introduction
Nowadays, China has always put innovation in the core position of the country’s overall development. Meanwhile, China keeps exceedingly supportive of science and technology innovation and comes up with a series of new ideas, new conclusions, and new requirements. Scientific and technological innovation is still the central theme of development. Intellectual property rights, which are the significant support of scientific and technological innovation, can fully stimulate people to achieve innovative development and promote social development and progress. As the core of intellectual property development, a patent is conducive to scientific and technological progress and economic development. It has an important strategic development position and is a significant standard to measure a country’s innovation activities and innovation ability. Patents are used as an indicator to evaluate a country’s innovation ability, innovation output and so on.
In modern times, a patent is a document that is issued after an application is filed with a government agency or a regional organization in some countries and is decided and verified. Within a certain period, the legal states that the patented invention and the right to use a patent can only be obtained with the approval of the patentee generally. Patents are divided into inventions, utility models, and designs in China. Among the three types of patents, the originality and technical content of the invention patents are the highest, while both of the two factors are lower in utility model patents and design patents. The number of domestic patents applications and patent authorizations is a crucial index to measure the development of national patents. According to this index, the development of patents could be roughly divided into two stages after establishing the patent system in China: The period between 1988 and 1997 is regarded as the stably growing stage because two indexes grew slowly during this period. However, as the number of patent applications and authorizations increased substantially in 1997, it entered the rapid growth stage in 1997.
The dramatic increase in patents has caused widespread concern among scholars. Yue h and other researchers have studied the relationship between patent development and factors including R&D personnel, FDI, GDP per capita, corporate output ratio, and patent system [1]; Cheung & Lin has researched the influence of FDI, human resources in science and technology, science and technology expenditures, the proportion of export in foreign-funded enterprises, GDP per capita and other factors on the development of patents [2]. At present, most scholars’ research mainly concentrates on the development of patents in China from the aspect of exploration of essential factors leading to the surge of patents [3].
However, few scholars are studying the development of patents from the Baidu search index [4]. For most people, it is necessary to search for information and knowledge about the patent application process and the required procedures before applying for a patent [5]. In recent years, we have gradually entered the Internet era, searching through the Internet is a common way to obtain information. Therefore, most people will search through the network to look for relevant information about patent applications, reflecting the people’s concern about patent applications [6].
Most scholars have studied patents from patent policy, patent quantity, and research funding, while this paper visualizes and converts the collected Baidu search index-time data into a network form for easy understanding, from the perspective of the Baidu search index, using the VG model. Our contributions are as follows: 1. We transform the time series data into a network by VG model, helping people understand these patents’ data in a visualization. 2. We analyse the patent application by a complex network, and divide the network into communities, indicating that the different attention of patents in different regions. 3. We also study the changes of patent applications with time in a year. For example, the frequent search would concentrate on January and February.
According to the basic parameters, this paper analyses the degree distribution, central values and, community division of complex networks to find the hidden information in time series data and learn about patent application information more comprehensively. In this paper, data of the Baidu search index from 1 January 2011 to 31 December 2018 is transformed into complex networks according to the concept of VG, as shown in Figure 2. The analysis of the degree distribution shows that the degree distribution of the integrated Baidu search on the PC and mobile side is the power-law distribution. According to the central value of the ranking, it can be found that the peaks of the annual patent application search times in the time series occurred in December of last year, after January, February, or August-October of this year. That is to say, the abnormal peaks and troughs are very few, and 80% of searches are in the normal range. Finally, we find that people’s attention shows a noticeable segmentation effect after clustering the time series data.
The rest of the paper is organized as follows: first, we introduce some relate works in Section 2; second, we introduce some models about the network and visibility graph in Section 3; third, we provide the data sources and raw data analysis in Section 4; then, the results and application are described in Section 5; finally, we give the conclusion and discussion of the paper in Section 6.
2 Related Work
To find more information from time series, we can start with complex networks and use the visibility graph algorithm to convert time series into network graphs. There have been many researches on this transformation. Zhang [7] studies the time series by constructing complex networks by pseudo-periodic time series and examines the dynamic relationship between the topological structure of the constructed network and the original time series. Xu [8] proposed to make the neighboring networks have the characteristics of time series by mapping. Marvan [9] presented the notion of recursive networks. Lucasa [10] presented the Visibility Graph (VG) algorithm for visualizing time series. The visibility graph algorithm makes it possible to be clearly familiar with the evolution of time series. Also, it combines the time series with a complex network [11]. Using Visibility graph algorithms, the system’s characteristics, such as certainty and randomness, can be determined based on those of the constructed complex network [12]. Currently, time series analysis by the VG model has been widely applied in different situations. Fan [13] used the VG method to analyze the similarity and heterogeneity of the time series of the market prices of seven carbon pilot markets in China. Zhou [14] introduced the visibility graph model to study the shield tunnel parameters, a complex network of shield tunnels in subway construction. Dai [15] mapped the four economic policy uncertainty indicators of the United States and China in a complex network and used the VG method to examine the network’s topology. And the the recent studies along with advantages and disadvantages as shown in the Table 1.
3 Model
3.1 Complex Network
Statistical physics and graph theory are powerful tools to study the commonness of various networks. From the perspective of graph theory, the network
3.2 Characteristics of Complex Networks
3.2.1 Degree and Degree Distribution
The degree
It has been studied that the degree distribution of virtual networks still shows significant variability when compared to the Poisson distribution. However, we may be able to use the power-law
Since the power distribution is free of scales, the power distribution is also referred to as a scale-free distribution. In a network, if the degrees of the nodes exhibit the characteristics of a power-law distribution, then the network is called a scale-free network:
For any constant a, there exists a constant b such that a probability distribution function fulfills the “scale-free condition”:
Then the next thing
In general, if a probability distribution function is a power-law distribution function, then it must have the scale-free property, i.e., only the power-law distribution function is the only distribution function that satisfies the scale-free property.
3.2.2 Betweenness Centrality
This paper starts from the eccentricity centrality of the complex network and makes the quantitative analysis of the search index network of patent applications in China from 1 January 2011, to 31 December 2018.
Generally, betweenness is used to measure the importance of a node in the graph (and likewise the edge Betweenness). If a node exists in the shortest path among many other nodes, it means that the node has a more considerable betweenness value.
We are given a graph G: = (V, E), and assuming that there are n nodes in the graph, the betweenness
We first compute the shortest distance between the nodes for each pair of nodes (s, t).
For each pair of nodes
Each pair of nodes
Or more succinctly.
Below that, σ_st is the number of shortest paths from s to t, and σ_st (v) is the number of nodes v that pass through the shortest path from s to t. It can be normalized by the number of node pairs excluding node v. For example, in a director-star graph, the central node (What is the shortest route of all) has a betweennesses value of
Calculate the number of betweenness and relative centrality of all nodes in the diagram, including computing the shortest distance between all nodes in the diagram—modifying the Floyd-Warshall algorithm to find the shortest path complexity of Θ
When calculating the betweenness and relative centrality of several nodes in the diagram, the assumption is that the graph is undirected and allows heavy edges. In particular, when dealing with network graphs, it is common for graphs to have no rings or repetitive edges to keep the relationships simple. Under these circumstances, using Brande’s algorithm will cause the final centrality value to reduce by half because each shortest path is computed twice.
3.2.3 Community Detection
Since Barabasi and Albert [9] pioneered the study of complex networks, researchers in various fields have looked at the world from the perspective of complex networks. It is known from network science theory that we collect data and then map the data and the connections between them as nodes and edges in a network system and divide it into different categories. In complex networks, community structure is an interesting phenomenon. How to find community structure in networks has become an important research topic. In a network, the connections within the group are more than those outside the group [17, 18]. Finding the community structure from a large-scale network [19]. At present, it is generally possible to achieve optimal community partitioning by optimizing certain specific metrics, of which the modularity Q came up with by Newman is currently the most widely applied method, in the form of formula (4):
where
3.3 Time Series Data Visualization Principle
As a crucial part of statistical physics, complex networks have been widely applied in all aspects [7, 9]. In order to mine the dynamic features hidden in time-series data are transformed into complex networks using a kind of algorithms, and then the topology of the network can be studied. Finally, the information we need can be extracted. The visibility graph (VG) algorithm is an effective technique for constructing complex networks [17–23], which has been shown to have the ability to convert the periodic, random, and fractal time series into regular, random, and scale-free networks, respectively. The features and significant characters of the raw time series are still preserved in the networks constructed afterward, enabling scientists to analyze the original time series using classical theoretical approaches of graph theory if they need to extract some information about the time series [18]. As shown in Figure 1, the height of the bar in Figure 1 represents the data value at each time point. If the tops of the two bars are visible to each other, the corresponding two points are connected by the network in Figure 1.
The VG algorithm transforms a time series expressed as
As shown in Figure 2, each time point has its value, and the values are presented as heights in the histogram. If the tops of the two vertical bars can see each other in the histogram, then correspondingly in the network diagram, we connect the two points.
Secondly, the adjacency matrix is constructed according to the time series nodes and edges, and the network diagram is formed, as shown in Figure 3.

FIGURE 3. Baidu search index keyword search trends. it's from https://index.baidu.com/v2/main/index.html#/trend/%E4%B8%93%E5%88%A9%E7%94%B3%E8%AF%B7?words=%E4%B8%93%E5%88%A9%E7%94%B3%E8%AF%B7.
4 Data Sources and Raw Data Analysis
This article data comes from the Baidu search index, http://index.baidu.com/v2/index.html#/. This paper analyzes the index data of the PC and mobile search index with the search keyword “patent application” from 1 January 2011 to 31 December 2018.
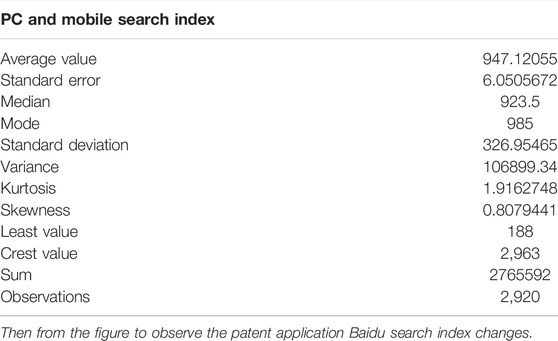
From Table 2, the average daily search index from 1 January 2011 to 31 December 2018 is 947.12055, of which the minimum value is 188 and the maximum value is 2,963.
Overall, from 2011 to 2018, the PC and Mobile Search Index changed slightly from 2011 to 2015, and the index was closer. Since September 2015, the search index has gradually risen, peaking in September 2016, then falling slightly. At the end of 2015, the State Council issued Several Opinions on Accelerating the Building of a Strong Intellectual Property Power under the New Situation, which proposed that the project of improving the quality of patents should be carried out to foster many core patents. In 2016, the Outline of the 13th Five-Year Plan of the State Council explicitly listed patent ownership per 10,000 people as one of the leading indicators for economic and social development, and the National Plan for the Protection and Application of Intellectual Property Rights issued by the State Council in the 13th Five-Year Plan made further reference to improving patent quality and efficiency. From 2015 to 2016, the relevant patent laws and regulations and policy system of our country were further improved, the whole society paid more attention to a patent application, and created a good environment of invention patent, so caused the upsurge of a patent application, which made the Baidu search index of a patent application to rise from 2015 to 2016. At the end of 2016, in the face of a gradual increase in patent applications, the state intellectual property office issued the “patent quality improvement project implementation plan ", began to focus on the quality of patent applications, and patent applications are under more stringent control so that patent applications gradually return to a rational state. Patent applications Baidu search index has also declined.
5 Application
In this paper, we use MATLAB, PYTHON and GEPHI for data analysis and experimental simulation.
As shown in Section 2.1, we strive to describe the characteristics of time series with complex networks, in which some significant parameters in the network are calculated, as shown in Table 3 below.
In Table 3, we find that the marginal and average degrees of the search indices in the network are larger in 2015 and 2016, which reflects the fact that there are more peaks and valleys in 2015 and 2016. The average degree lies between 15.841 and 50.992, and the average degree indicates the number of searches for patents in a day in each year, which means that people may not pay much attention to patents in 2013, while people increased their attention to patents in 2016. Eight networks have diameters between 12 and 72, and there is a specific fluctuation range, which represents the number of edges between the two longest distances in each network, the number of edges with the shortest number between time points. The average distance also indicates the average number of edges to pass between any two points in time to establish a connection. The maximum average path length of 27.863 occurred in 2013 and the minimum value of 3.137 in 2015, which indicates that people were less concerned about patents in 2013, and due to the strong promotion of innovation by the country in 2015, people’s concern about patents also became higher. The average clustering coefficients are all around 0.8, which shows a strong aggregation to a certain extent.
In summary, we can find that people searched less for patents in 2012 and 2013.2016 saw the promulgation of the National Policy on Patent Fee Mitigation, the further improvement of China’s relevant patent laws, regulations and policy system, and the greater importance attached to patent applications by society, creating a favorable environment for invention patents and triggering a patent application boom.
5.1 Degree Distribution
First, we focus on the distribution of node degrees in a total of eight complex networks from 2011 to 2018, as shown in Figure 4.
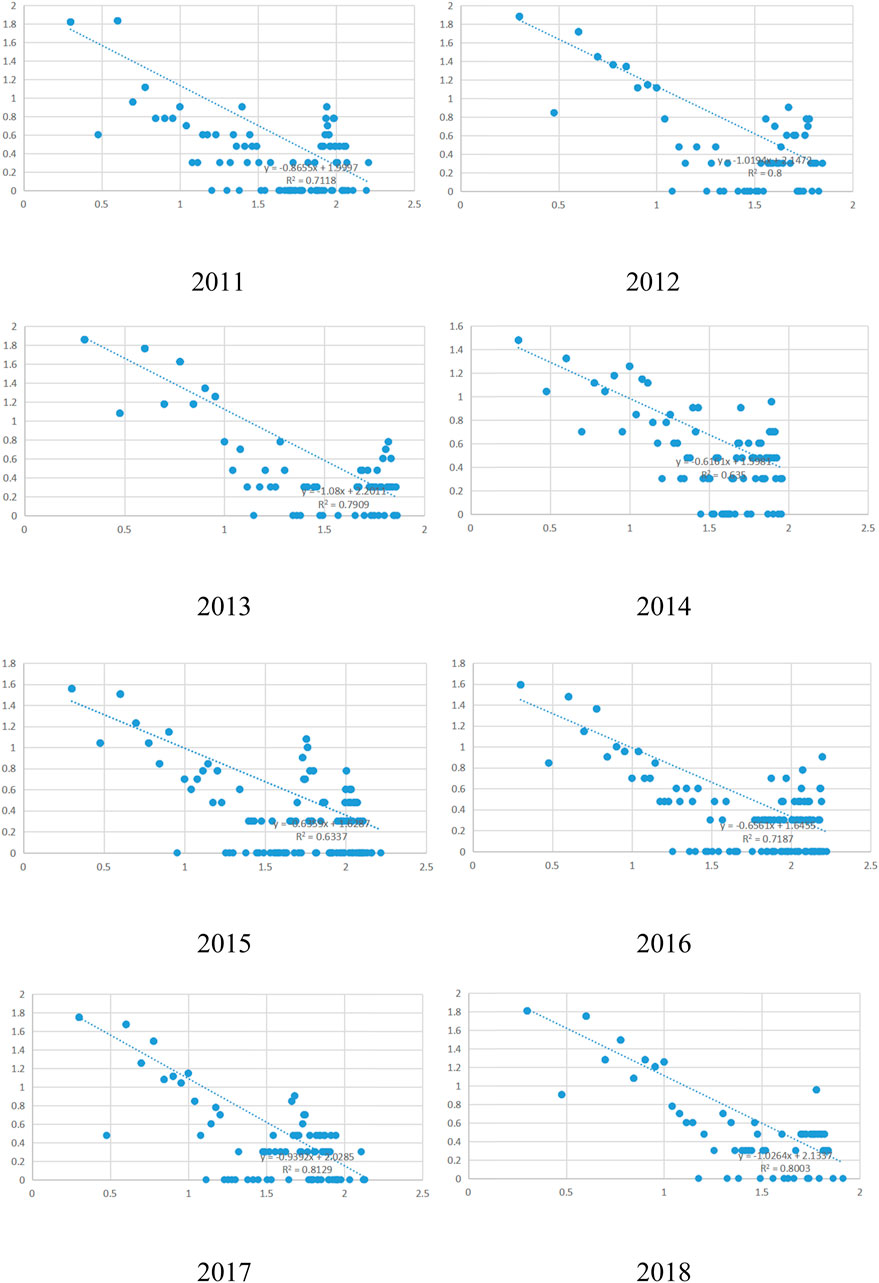
FIGURE 4. Cumulative probability distribution of node degrees in the network diffracted by time series from 2011-2018.
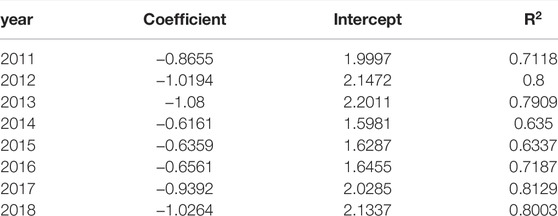
In Table 4, we specify the fitting parameters for node degree distribution.
Figure 4; Table 4 describe the degree distribution of the network Baidu search index nodes for a patent application, reflecting that the degree distribution of the comprehensive search from 2011 to 2018 is a power-law distribution. All eight data exhibit the characteristic of fat tails, i.e., their forms of change are extremely similar to some extent. The degree distribution of the comprehensive search from 2011 to 2018 is a power-law distribution, which shows that there are more time nodes, but fewer continuous edges exist. As the degree increases, the smaller the number of nodes, the smaller the proportion of nodes with higher degrees.
5.2 Dividing Hotspots Based on Centrality
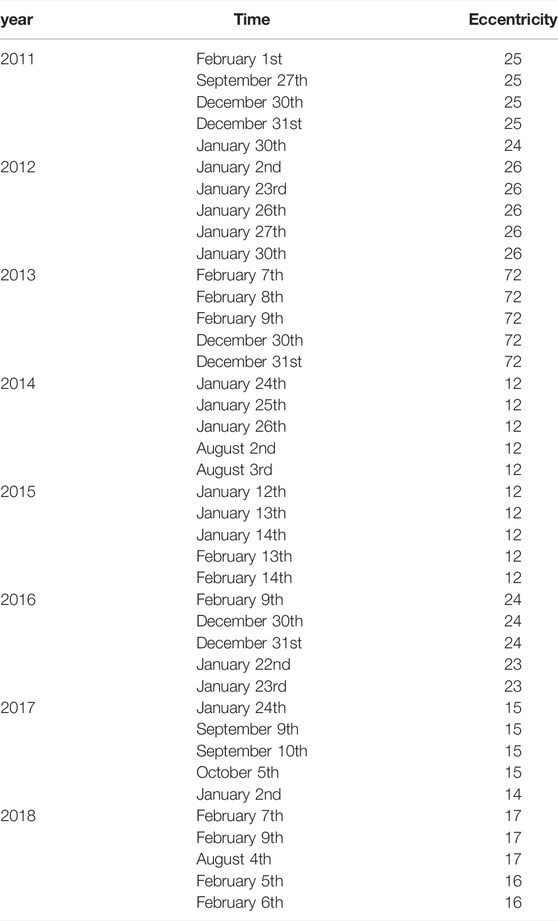
According to the value of Eccentricity, five time nodes with the largest Eccentricity value per year are selected, as shown in Table 5.
From Table 5, we can find that the timing of the hotspots is roughly the same each year, concentrated in January-February, August-October, and December. They can be divided into two types of time: January, February, and December can be regarded as a type of time, and August-October can be regarded as another type of time. There are many things to deal with when the year is approaching in the former type. In addition to the Spring Festival holiday, many works are difficult to operate, and patent applications have been postponed. Therefore, peaks in patent applications are prone to occur in December of the previous year or after January-February of this year, and the corresponding Baidu search index also peaks. August-October includes the start of the school season, National Day holiday, etc, so people may be busy with other complicated things, and it is difficult to focus on patent applications. However, people return to work, patent applications are gradually on track, and the peak of patent applications appears.
5.3 Community Detection
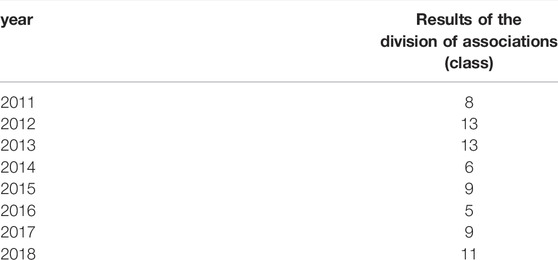
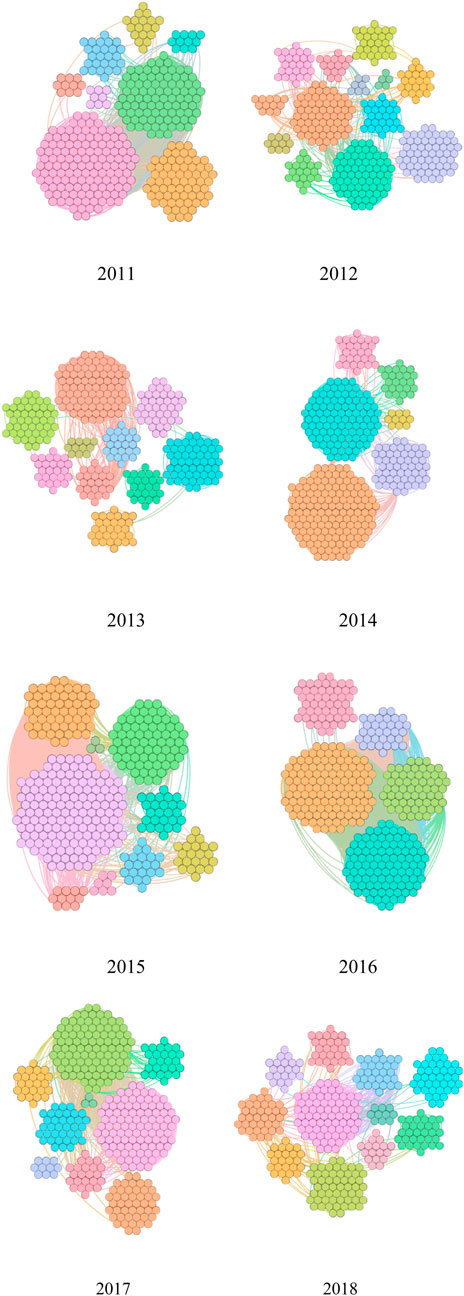
In Table 6, we show the classification results of societies from 2011 to 2018, and we can see that the number of classified societies is among 5–13, which indicates that there is a certain change for the patent search every year, but the change is not too obvious. The classification results of association division from 2011 to 2018 are depicted in Figure 5, and the same color represents an association, while different colors indicate different associations.
In the associations’ division results based on the concept of time series network data visualization, most of the association division results in adjacent nodes for a period of time is divided into one class, such as 1 January 2011-9 January 2011, and 10 January 2011 - 5 May 2011. Due to the strong correlation of the Baidu search index in similar time nodes, the adjacent time nodes are usually classified into one category. As can be seen from the graph and table, among them, the number of classes classified by the associations in 2012 and 2013 was the most, which was 13. In contrast, the minimum was five in 2016. It shows that 2016 was classified into one category because there were longer adjacent times, but 2012 and 2013 were classified into one category because there were relatively few adjacent times. Due to the large number of patent encouragement policies introduced in 2016, the patent application has been at its peak during the year, making the Baidu search index of patent applications consistently high, less affected by other factors, and the correlation between longer adjacent times was very high. In the early development stage of invention patents that were greatly affected by other factors in 2012 and 2013, this results in a strong correlation between only short adjacent times [24].
6 Conclusion
From the time series view, this essay transfers the time series into complex networks through the VG method. According to the basic parameters, this paper analyses the degree distribution, central values, and community division of complex networks to find the deeper information in time series data and know about patent application information more comprehensively.
This paper is based on the time-series data from 1 January 2011 to 31 December 2018 in the Baidu search index to transform the 8 years of data into eight complex networks according to the VG concept analyze the eight complex networks in three parts. The analysis of the degree distribution reflects that the degree distribution of the integrated Baidu search on the PC and mobile side is the power-law distribution. That is to say, the abnormal peaks and troughs are very few, and 80% of searches are in the normal range. According to the central value of the ranking, it can be found that the peaks of the annual patent application search times time series occurred in December last year, after January, February of this year, or after August-October. Finally, after clustering the time series data, we find that people’s attention shows an obvious segmentation effect.
The VG model analyses the patent situation reflected by the Baidu index search data from a network perspective. This facilitates us to understand better how people apply for patents. It can also provide us with a deeper understanding of some policies and characteristics of patents in recent years. This paper is enlightening for patent application but has many shortcomings, such as our lack of empirical test. We will continue to analyse the factors that would influence patent application by various perspective, and study some cases to support our paper.
Data Availability Statement
The original contributions presented in the study are included in the article/Supplementary Material, further inquiries can be directed to the corresponding author.
Author Contributions
YH:Visualization, Validation, Drawing and Writing SM: Investigation, Software, Methodology XY: Conceptualization, Software, Validation MZ: Writing-Reviewing and Editing, Visualization QQ: Methodology, Computation, Software PW: Validation, Conceptualization, Investigation.
Funding
This paper is supported in part by the National Natural Science Foundation of China under Grant 71871159, in part by the Fujian innovation strategy research plan project under Grant 2020R0021, in part by the Fujian Social Science Planning Project under Grant FJ2020B024, in part by the 2nd Fujian Young Eagle Program Youth Top Talent Program, and in part by the Fujian science and technology economic integration service platform. The Academy-Locality Cooperation Project of the Chinese Academy of Engineering under Grant 2021-FJ-ZD-4.
Conflict of Interest
Author XY was employed by company Ansteel Company Limited Cold-Rolling Silicon Steel Mill.
The remaining authors declare that the research was conducted in the absence of any commercial or financial relationships that could be construed as a potential conflict of interest.
Publisher’s Note
All claims expressed in this article are solely those of the authors and do not necessarily represent those of their affiliated organizations, or those of the publisher, the editors and the reviewers. Any product that may be evaluated in this article, or claim that may be made by its manufacturer, is not guaranteed or endorsed by the publisher.
References
1. Yueh L. Patent Laws and Innovation in China. Int Rev L Econ (2009) 29(4):304–13. doi:10.1016/j.irle.2009.06.001
2. Wu J, Hu D, Wang Q. Role of Education for Spillover Effects of FDI on Innovation in China: Evidence from the 1998–2008 Provincial Panel Data. In: Proceedings of the 2010 IEEE 17Th International Conference on Industrial Engineering and Engineering Management; 29-31 Oct 2010; Xiamen, China. Piscataway, New Jersey, United States: IEEE (2010). p. 454–7.
3. Ye S, Dai P-F, Nguyen HT, Huynh NQA. Is the Cross-Correlation of EU Carbon Market price with Policy Uncertainty Really Being? A Multiscale Multifractal Perspective. J Environ Manage (2021) 298:113490. doi:10.1016/j.jenvman.2021.113490
4. Zhao R, Dai P-F. A Multifractal Cross-Correlation Analysis of Economic Policy Uncertainty: Evidence from China and US. Fluct Noise Lett (2021) 20(05):2150041. doi:10.1142/s0219477521500413
5. Hu J, Chen J, Zhu P, Hao S, Wang M, Li H, et al. Difference and Cluster Analysis on the Carbon Dioxide Emissions in China during Covid-19 Lockdown via a Complex Network Model. Front Psychol (2021) 12:795142. doi:10.3389/fpsyg.2021.795142
6. Hu J, Zhang Y, Wu P, Li H. An Analysis of the Global Fuel-Trading Market Based on the Visibility Graph Approach. Chaos, Solitons & Fractals (2022) 154:111613. doi:10.1016/j.chaos.2021.111613
7. Zhang J, Small M. Complex Network from Pseudoperiodic Time Series: Topology versus Dynamics. Phys Rev Lett (2006) 96(23):238701. doi:10.1103/physrevlett.96.238701
8. Zhang J, Sun J, Luo X, Zhang K, Nakamura T, Small M. Characterizing Pseudoperiodic Time Series through the Complex Network Approach. Physica D: Nonlinear Phenomena (2008) 237:2856–65. doi:10.1016/j.physd.2008.05.008
9. Xu X, Zhang J, Small M. Superfamily Phenomena and Motifs of Networks Induced from Time Series. Proc Natl Acad Sci U.S.A (2008) 105(50):19601–5. doi:10.1073/pnas.0806082105
10. Marwan N, Donges JF, Zou Y, Donner RV, Kurths J. Complex Network Approach for Recurrence Analysis of Time Series. Phys Lett A (2009) 373(46):4246–54. doi:10.1016/j.physleta.2009.09.042
11. Donner RV, Zou Y, Donges JF, Marwan N, Kurths J. Recurrence Networks-A Novel Paradigm for Nonlinear Time Series Analysis. New J Phys (2010) 12:033025. doi:10.1088/1367-2630/12/3/033025
12. Lacasa L, Luque B, Ballesteros F, Luque J, Nuño JC. From Time Series to Complex Networks: The Visibility Graph. Proc Natl Acad Sci U.S.A (2008) 105(13):4972–5. doi:10.1073/pnas.0709247105
13. Li X, Yang D, Liu X, Wu X-M. Bridging Time Series Dynamics and Complex Network Theory with Application to Electrocardiogram Analysis. IEEE Circuits Syst Mag (2012) 12:33–46. doi:10.1109/mcas.2012.2221521
14. Gao Z-K, Cai Q, Yang Y-X, Dang W-D, Zhang S-S. Multiscale Limited Penetrable Horizontal Visibility Graph for Analyzing Nonlinear Time Series. Sci Rep (2016) 6(1):35622. doi:10.1038/srep35622
15. Dai P-F, Xiong X, Zhou W-X. Visibility Graph Analysis of Economy Policy Uncertainty Indices. Physica A: Stat Mech its Appl (2019) 531:121748. doi:10.1016/j.physa.2019.121748
16. Zhu P, Cheng L, Gao C, Wang Z, Li X. Locating Multi-Sources in Social Networks with a Low Infection Rate. IEEE Trans Netw Sci Eng (2022) 1. doi:10.1109/TNSE.2022.3153968
17. Lacasa L, Luque B, Luque J, Nuño JC. The Visibility Graph: A New Method for Estimating the Hurst Exponent of Fractional Brownian Motion. Europhys Lett (2009) 86:30001. doi:10.1209/0295-5075/86/30001
18. Pierini JO, Lovallo M, Telesca L. Visibility Graph Analysis of Wind Speed Records Measured in central Argentina. Physica A: Stat Mech its Appl (2012) 391:5041–8. doi:10.1016/j.physa.2012.05.049
19. Hu J, Xia C, Li H, Zhu P, Xiong W. Properties and Structural Analyses of USA's Regional Electricity Market: A Visibility Graph Network Approach. Appl Maths Comput (2020) 385:125434. doi:10.1016/j.amc.2020.125434
20. Hu J, Chu C, Xu L, Wu P, Lia H-j. Critical Terrorist Organizations and Terrorist Organization Alliance Networks Based on Key Nodes Founding. Front Phys (2021) 9:687883. doi:10.3389/fphy.2021.687883
21. Cui X, Hu J, Ma Y, Wu P, Zhu P. Investigation of Stock Price Network Based on Time Series Analysis and Complex Network. Int J Mod Phys B (2021) 2021:2150171. doi:10.1142/s021797922150171x
22. Qiao H, Deng Z, Li HJ, Song Q, Xia C. Complex Networks from Time Series Data Allow an Efficient Historical Stage Division of Urban Air Quality Information. Appl Maths Comput (2021) 410(15):126435. doi:10.1016/j.amc.2021.126435
23. Lacasa L, Luque B, Ballesteros F, Luque J, Nuño JC. From Time Series to Complex Networks: The Visibility Graph. Proc Natl Acad Sci U.S.A (2008) 105:4972–5. doi:10.1073/pnas.0709247105
Keywords: visibility graph, patent application, clustering, complex network, community detection
Citation: Mao S, Hu Y, Yuan X, Zhang M, Qiu Q and Wu P (2022) Analysis of Patent Application Attention: A Network Analysis Method. Front. Phys. 10:893348. doi: 10.3389/fphy.2022.893348
Received: 10 March 2022; Accepted: 01 April 2022;
Published: 13 June 2022.
Edited by:
"Wei Wang, Chongqing Medical University, ChinaReviewed by:
Fujun Lai, Yunnan University of Finance and Economics, ChinaManman Yuan, University of Science and Technology Beijing, China
Yujie Zhang, Shanxi University of Finance and Economics, China
Copyright © 2022 Mao, Hu, Yuan, Zhang, Qiu and Wu. This is an open-access article distributed under the terms of the Creative Commons Attribution License (CC BY). The use, distribution or reproduction in other forums is permitted, provided the original author(s) and the copyright owner(s) are credited and that the original publication in this journal is cited, in accordance with accepted academic practice. No use, distribution or reproduction is permitted which does not comply with these terms.
*Correspondence: Yuxia Hu, aHl4aWEwNDAyQDE2My5jb20=; Qirong Qiu, cXFya3ljQGZ6dS5lZHUuY24=
 Shihao Mao
 Yuxia Hu
 Xuesong Yuan3


