- 1Beijing Key Laboratory for Precision Optoelectronic Measurement Instrument and Technology, School of Optics and Photonics, Beijing Institute of Technology, Beijing, China
- 2Key Laboratory of Terahertz Optoelectronics, Department of Physics, Beijing Engineering Research Center of Terahertz and Infrared Technology, Capital Normal University, Beijing, China
The evaluation of the internal defects in high-voltage cross-linked polyethylene cables is highly crucial for the security and reliability of power transmission. Here, a terahertz (THz) frequency-modulated-continuous-wave non-destructive testing (NDT) imaging system is used to demonstrate the non-contact detection of a high-voltage cable (35 KV). Combined with linear scanning and axial rotation, the three-dimensional (3D) data of the columnar target is acquired, and a 3D perspective image is reconstructed. The correspondence between the target in the real space and image space is determined to accurately show the internal spiral structure and strand number of metal wires. The results indicate that prefabricated air and water holes in the polyethylene insulation layer can be displayed. Furthermore, feature defect signals are automatically classified and recognised by combining the principal component analysis dimension reduction method and the support vector machine classification method, which can predict abnormal defects more efficiently in mass data. These results provide technical guidance for the non-contact NDT and visual evaluation of the internal state of detected cable targets.
Introduction
Cross-linked polyethylene (XLPE) cables are widely used [1, 2], and the associated voltage level has gradually increased from 10 kV in the early stage to more than 500 kV in recent times. However, certain quality defects exist in the body of insulated power cables, such as micropores, impurities, stress damage, and moisture. These defects gradually deteriorate under the action of an electric field, rapidly grow like branches, and range in size from microns to millimetres or more. This can induce dielectric breakdown that severely damages the insulation and causes safety risks [3–6]. The composition of the defects is different from that of the insulation, causing a contrast in physical characteristics, for example, electrical, optical or acoustical, and requiring the detection or imaging of these faults. With appropriate imaging techniques, the size, shape, and location of defects in the insulation layer can be detected and visually displayed. In 1980, C. Laurent [7] et al evaluated the growth of electrical trees in polyethylene by the simultaneous measurement of luminous imaging and partial discharges. The specimens were made of low-density polyethylene, which was compressed and moulded into blocks to observe the growth of defects. Ultrasound imaging is also used for the inspection of insulation [8, 9]. Ultrasound synthetic aperture imaging can successfully detect 1-mm-size faults within the XLPE insulation of a cable [10]. While in a typical ultrasound system configuration, an ultrasound transducer is usually submerged in water or a contact probe is used together with an ultrasound couplant. X-ray imaging is a non-contact detection technique with high resolution, which can show particle contamination in the insulation shielding and damages to the inner conductor [11]. X-ray computed tomography (XCT) can reveal electrical trees, providing a three-dimensional (3D) view and therefore, a more complete representation of the phenomenon can be achieved [12]. This method requires an experimental environment with strong radiation during the detection, and the safety requirements are higher. In addition, detecting the layered air gap defects is difficult.
THz non-destructive imaging technology with characteristics such as low single photon energy and high penetration into most non-polar materials is well suited for non-contact information acquisition to achieve 3D imaging with sub-millimetre spatial resolution and microns depth resolution inside the target and has attracted considerable attention from the industry in recent years. There are mainly two technical routes. One is based on broadband pulsed THz signals, such as THz time-domain spectroscopy (TDS) imaging, and the other is based on continuous wave (CW) signals, including single-frequency CW and broadband frequency-modulated continuous-wave (FMCW) imaging. In 1995, Hu et al. [13] combined a THz TDS system and a two-dimensional (2D) scanning device to achieve point-by-point raster-scanning pulsed THz 2D imaging to identify the integrated semiconductor in a plastic package. In 2005, Karpowicz et al. [14] built a THz CW scanning imaging system using a 200 GHz Gunn diode and a Schottky detector to detect debonding defects in adiabatic foam materials for analysing the cause of the Columbia Space Shuttle crash, which led to the designation of THz non-destructive testing (NDT) technology as a mandatory inspection tool for spacecrafts by the National Aeronautics and Space Administration (NASA). Although it is not 3D imaging, it marked the beginning of THz technology moving toward practical applications. In 2006, Zhang et al. [15] successfully built a THz TDS imaging system based on InAs crystal emission and ZnTe crystal electro-optical sampling detection to obtain THz transmission images of the internal kernels of sunflower seeds, while validating various image reconstruction methods. In 2009, Quast et al. [16] developed an FMCW radar system with a centre frequency at 300 GHz using solid-state electronics, combined with a 2D scanning device and two lenses to achieve close-range focused reflection imaging, which can obtain the interface information of multilayer structure samples. In 2015, Zhang et al. [17] used an FMCW imaging system to detect the delamination state of oil paint layers. In 2017, Friederich et al. [18] developed a 3D THz imaging system for defect detection during the radome manufacturing process. The system combines two CW sensing units, which can operate in adjacent frequency ranges of 70–110 GHz and 110–170 GHz. It can further improve the depth resolution by combining data from both frequency bands. In 2020, Shen et al. [19] implemented a low-cost 76–81 GHz FMCW imaging system with a fast measurement rate of 40,000 waveforms per second.
With the development of THz systems, it is possible to explore how to test the quality defects in cables. In 2011, Sato R et al. [20] carried out the possibility of detection of water trees grown in a model sample using THz imaging. Distribution of water trees grown from the surface of a polymer or those present in an underneath polymer were successfully imaged at frequencies from 0.01 to 1.0 THz. In 2012, Komatsu et al. [21] investigated the possibility of nondestructive diagnosis of corrosion on a metallic shielding layer in a power cable by TDS 2D imaging. When the metallic plate is corroded to form either basic copper carbonate or copper chloride, the intensity of reflected wave becomes lower than when the plate is uncorroded. In 2014, Takahashi et al. [22] detected the insulated copper cables with artificially introduced damage using a reflective CW THz imaging system with 0.14 THz. The wires in the polyethylene with 2 mm thickness covered cable were clearly visible in THz 2D imaging, and gaps in individual copper wires could also be detected. In 2017, Yan et al. [23] demonstrated that the aging degree of XLPE can be obtained by measuring its permittivity and absorption coefficient by THz TDS system. In 2020, Lee et al. [24] demonstrated that artificial void defects with 0.5 mm diameter located inside XLPE plates for power cable insulation can be detected using a optical heterodyning CW–THz imaging system with transmission geometry. In 2020, Yang et al. [25] examined a standard parallel plate polyethylene material using THz TDS imaging with transmission measurement and detected gas seams in insulated polyethylene. In 2021, Li et al. [26] designed an artificial model of a three-layer structure based on the actual cable terminal of the electric multiple units, on which the insulation damp test is carried out. The results of THz A-scan and C-scan imaging can accurately identify the location and geometry of the insulation affected by the moisture, and verifies the feasibility of THz TDS technology in inspecting the moisture dampness. To sum up, THz technique is capable of non-contact and non-destructive observation of the information inside insulated polyethylene, which is of great help in controlling the quality of the cable.
In this study, a self-developed reflective THz NDT imaging system is used to evaluate 35 kV high-voltage cable joints, taking advantage of the high reflection characteristics of the metal conductors in the cable. The 3D data can be obtained in the column coordinates and a full-view perspective THz imaging can be reconstructed use it. The THz imaging can visually depict the 3D internal structure of the cable and corresponds well to the real object. The machine-learning method can be employed to improve the defect recognition efficiency and perform automatic recognition. This helps to visually assess the internal state of the inspected target, presenting a novel fashion for the NDT of cable quality and reliability control. In addition, the system uses all-solid-state devices. With the rapid development of devices towards miniaturisation, high power, and large bandwidth, detection imaging capabilities and portability can still be improved, to better meet the needs of NDT in the industrial field.
Experimental Setup
The ideal FMCW system is shown in Figure 1A. When the received THz wave and the local oscillation (LO) sweep the frequency linearly in time, the output intermediate frequency (IF) from the harmonic mixer is proportional to the time delay, and the distance between the transmitting unit and target is measured by the frequency component of the IF signal. The THz FMCW signal can be expressed as
where
where
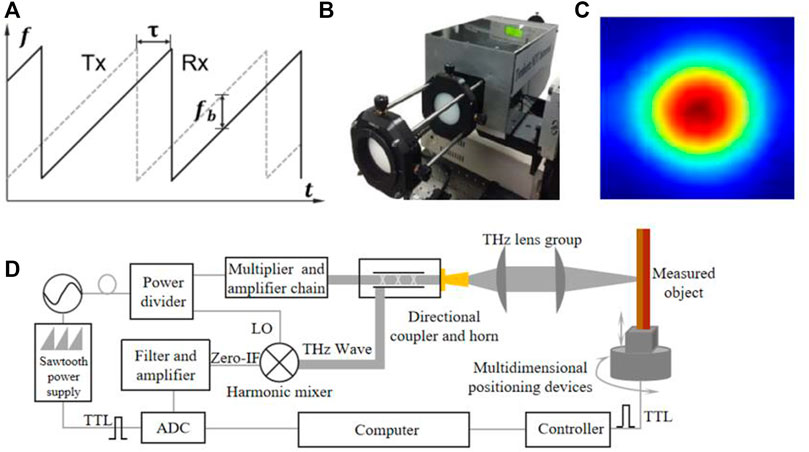
FIGURE 1. (A) Functional diagram of the system; (B) Physical view of the system; (C) Intensity distribution of the THz wave focus plane; and (D) System architecture.
After the harmonic mixing of the LO signal and the received THz wave signal in the mixer is performed, the IF signal can be expressed as
The derivation of the phase of the differential signal yields the corresponding differential beat frequency as
For a stationary target, the frequency of the differential beat signal is only related to the distance and FM slope. The relationship between the target distance, R, and the differential beat frequency,
Usually, the FM slope,
Figure 1B shows a photograph of the system, and Figure 1D shows a system functional structure diagram. The system comprises a broadband THz transceiver, an optical collimated focusing lens group and a set of scanning stages for 3D imaging. The sawtooth wave modulation power supply drives a voltage-controlled oscillator (VCO) to generate a broadband low-frequency LO signal of 9.375–13.75 GHz within a 120 µs FM cycle, which is then split into two parts by a power splitter. One part is connected to a 24 times frequency multiplier chain and a directional coupler, and subsequently the signal with the effective bandwidth from 0.225 to 0.330 THz is transmitted to free space through a broadband corrugated horn antenna. The output broadband THz signal, after beam modulation, is collimated and focused vertically on the target being tested. A lens group consisting of 2 THz lenses is used as the modulation device. The echo signal back-scattered by the target surface and different internal interfaces and defects is returned in the original way and coupled by the directional coupler to the signal input of the harmonic mixer. The other part of the low-frequency signal is connected directly to another input of the mixer as LO. The IF signal output from the mixer is filtered, amplified, and collected. The acquisition card is kept in sync with the sawtooth wave power supply. The method using a directional coupler and a single antenna combined with a lens set is conducive for the miniaturisation of the system and more flexible in practical application. When further combined with multi-dimensional scanning devices, the system can also be used to perform target scanning and imaging.
The object to be measured is usually located near the focus of the beam, and the spatial distribution of the electromagnetic waves during scanning and imaging has a strong influence on the actual imaging quality. The AlGaN/GaN-HEMT THz wave detector is placed at the focus point position, and the detector is placed on a 3D scanning frame, through which the intensity distribution of the beam can be accurately obtained. Figure 1C shows the focal plane light intensity distribution of the system, which is approximately a Gaussian distribution to ensure that the spatial resolution of the imaging is close to the diffraction limit.
After the beam quality is optimised, the resolution of the system in the depth direction is determined by the FM bandwidth. The ideal FMCW system is linearly tuned. However, ideal linear devices do not exist, and all system devices contain nonlinearity which can lead to the phase defocusing of the swept system, resulting in reduced depth resolution. THz broadband devices, especially electronic devices such as frequency multipliers and harmonic mixers in the system, have strong group delay jitter [27–29], and their nonlinearity cannot be ignored [30]. These nonlinearities extend the well-focused spectral response of the target to different frequencies, leading to negative effects such as reduced distance resolution, loss of signal-to-noise ratio, elevated side flaps, and main flap asymmetry. Based on [31, 32], we use the phase correction method, which can effectively improve the effects of the system nonlinear effects.
The standard step sample was first tested. The system was connected to a 2D scanning device, and the 3D printed ABS material step sample, as shown in Figure 2A, was scanned with a flat surface (front surface) on one side and a step surface (rear surface) on the other side. The front surface was set as the zero point in the depth direction. The points A1–A8 in Figure 2A corresponded to different thickness positions, where A1 and A8 had the same and maximum thickness, A7 had the smallest thickness, which is 4 mm, and the remaining points corresponded to thickness variations of 2 mm in order, with thickness values of 4 (A7), 6 (A6), 8 (A5), 10 (A4), 12 (A3), 14 (A2), and 16 (A1, A8) mm. The refractive index of the ABS material at 275 GHz was approximated as 1.56. Figure 2B shows the one-dimensional (1D) echo images before and after calibration at point A7. Figure 2C shows the front and rear interface echo images of the dielectric material at points A1-A8. The positions of the front surface echoes of all points almost overlapped, and there was a data acquisition error of 1 data point in the raw data. The post-interface echoes appeared sequentially according to different thickness variations, with black curves for points A1 and A8. The A3-A7 echo positions and amplitudes vary accordingly in equal proportions. Correspondingly, the B-scan image was shown in Figure 2D. A 3D image of the sample was further displayed, as shown in Figure 2E.
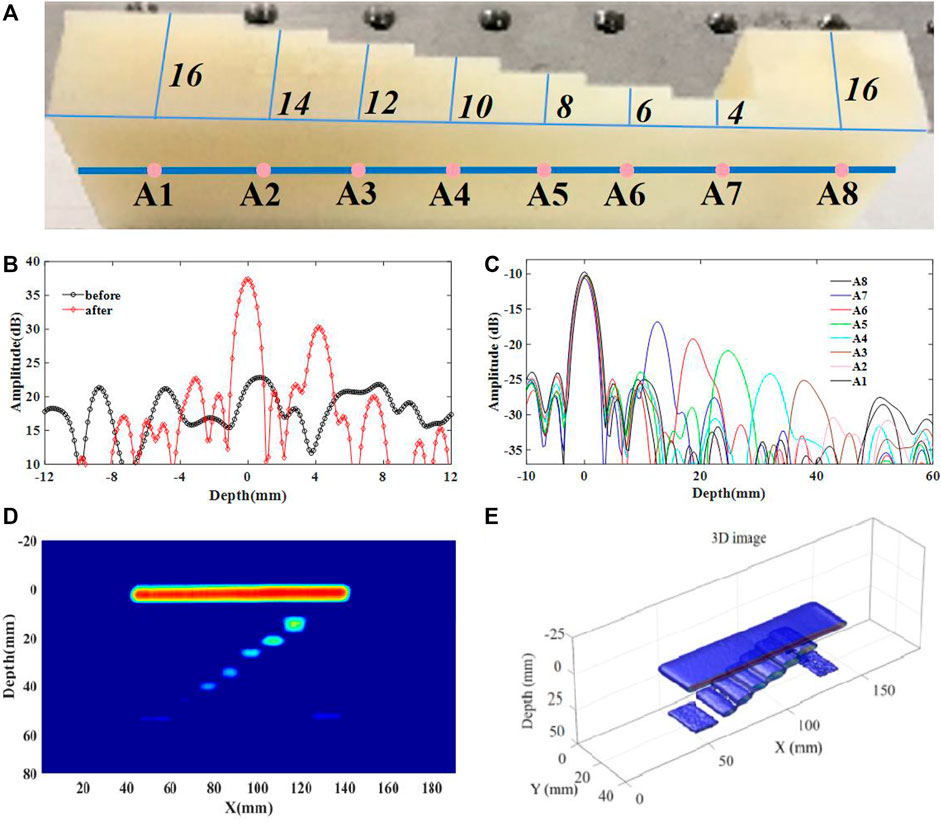
FIGURE 2. ABS sample: (A) photograph; (B) profile of A7 before and after calibration; (C) profiles of A1–A8; (D) B-scan image; (E) 3D image.
Result and Discussion
The differences in the raw materials and production processes, as well as long-term high-voltage loads and complex environmental conditions cause damage and degradation of materials and structures, internal defects, and potential safety hazards. Figure 3A depicts a high-voltage cable (35 kV) end after the sealing silicone rubber is removed; the tin foil simulates a metal shield. Usually in practical applications, no metal shield layer is present at the end of the cable (only an insulating layer and a wrapped conductor core are present), and the outermost part is the sealing silicone rubber. As shown in Figure 3B, the XLPE insulation has an outer diameter of 31.2 mm, a radial thickness of 11 mm, and a refractive index of 1.55. Two holes were prefabricated in the polyethylene insulation with a diameter of approximately 3 mm, among which, one hole was filled with water at a depth of approximately 20 mm, and the other hole was filled with air only at a depth of approximately 19 mm. The conductor core had seven copper conductors with a plum-shaped cross-section and an outer diameter of approximately 9.2 mm. The diameter of a single strand was approximately 3 mm. The other seven conductors were wound together in an overall spiral structure, as shown in Figure 3C.
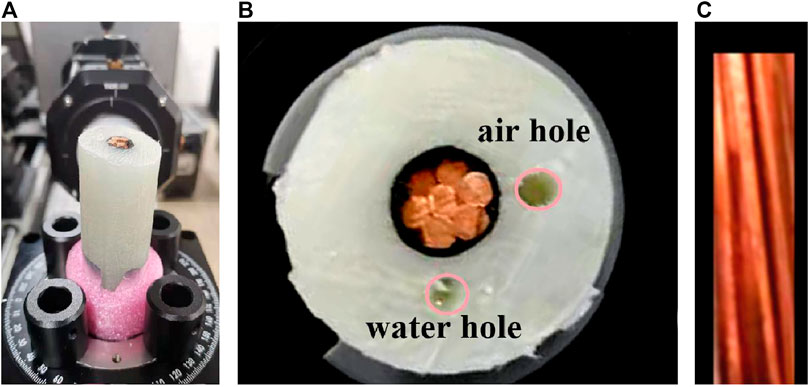
FIGURE 3. Cable sample. (A) Lateral view; (B) vertical view; (C) structure of the cable conductor core.
The cable under test was placed on an electrically controlled rotary table with the rotation axis of the cable column surface coaxial to the rotation axis of the electrically controlled rotary table. The THz signal was irradiated perpendicular to the rotation axis onto the sample surface, transmitted to the sample interior, and reflected by the internal conductor clusters. The echoes returned from the different interfaces were recorded for signal analysis and image reconstruction. The position was adjusted so that the focusing plane of the THz signal was close to the internal metal reflecting surface. The motorised rotary stage and acquisition of the THz signals were controlled so that 256 sweeps were acquired at each irradiation position and averaged. Subsequently, the electronically controlled rotary stage was rotated by 1°. After one rotation, the sample and electronically controlled turntable rose as a whole by 1 mm. When the desired test range is covered, a three-dimensional data cube of the sample can be obtained.
Figure 4A shows the C-scan image corresponding to the position of the outer surface of the cable. The horizontal coordinates represent the angle values of the rotation, and the vertical coordinates represent the height of the cable. The upper part of the image indicates air, and the lower red area indicates a layer of metal shield wrapped around the outer surface of the polyethylene insulation, with a contour consistent with the real sample and a missing corner at 180–210°, corresponding to the photo in Figure 3A. The metal shield reflected the THz waves directly and almost coincided with the interface of the outer surface of the XLPE insulation. The image of the area in the middle section shows that the reflectivity of the metal shield material was much greater than that of the XLPE material. Figure 4B shows a C-scan image corresponding to the location of the metal conductor core interface. The reflective surface imaging of the wire clusters shows concave and convex changes, resulting in a periodic variation in the reflected signal with the rotation angle. The signal reflected by the convex position was relatively strong, and relatively weak signals were reflected at the concave locations between the wires. There was a certain degree of deformation of the cable column, the rotation centre of the rotary table and the axis of the cable column were not completely coincident, and the thickness of the insulating material was not absolutely uniform, resulting in a certain distortion of the echo reflected back from the metal conductor. Nevertheless, the presence of six wires inside the conductor, as well as the spiral structure, could still be clearly observed. Two regions with very weak reflected signals were observed for 1) angles ranging between 0–25° and 355–360° and for the height range of 10–30 mm, as well as for 2) angles ranging between 90 and 120° and heights ranging between 10 and 29 mm. The weak echo signals in these two regions are caused by prefabricated holes in the insulating material. The incident THz signal was redirected by the spatial structure formed by the columnar holes, preventing the signal from reaching the surface of the conductor core, or the signal was not picked up by the detection device after it arrived and was reflected. Corresponding to the depth position in Figure 3B, when the depth reaches the prefabricated holes, scattered echoes can be observed in regions A and B in Figure 4B, as shown in Figure 4C. The interface of the hole created scattered echoes, and the effects of the water or air filled inside on the THz wave transmission were different, with region A corresponding to the water-filled hole structure and exhibiting a stronger scattered echo signal and region B corresponding to the air-filled hole with a weaker scattered echo signal relative to region A. This suggests that defects on the signal transmission path can be indirectly analysed by using the transmission of THz signals.
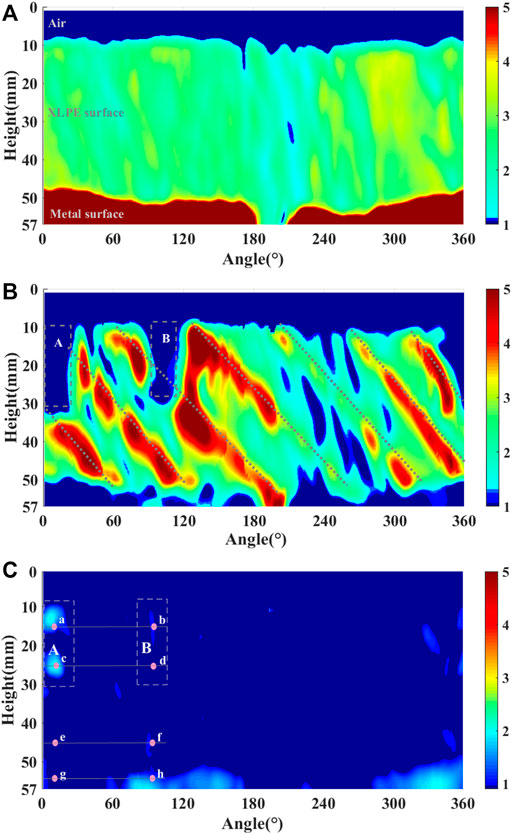
FIGURE 4. THz C-scan images. (A) Outer surface of the cable; (B) interface of the conductor core; (C) depth position of holes.
To observe the effect of the hole structure on the THz wave transmission in more detail, the one-dimensional (1D) A-scan distance images of points a, b, c, d, e, f, g, and h shown in Figure 4C were taken, corresponding to different locations, with heights of 15, 25, 45, and 55 mm and angles of 7° and 94°, respectively. Figure 5A is the 1D distance image of the original data at these positions. The strong reflection signal of the metal shielding layer corresponding to points g and h is approximately 5 times the reflection intensity of the outer surface of the insulating layer, which is in line with Fresnel’s law. In addition, no holes are present in the insulation layer at points e and f. The THz signal was equivalent to propagation in a homogeneous medium, and the signal returned upon reaching the metal conductor was stronger. In contrast, at points a, b, c, and d, the THz signal transmission passed through holes, except for a part of the signal forming a scattered echo, and the other part of the signal reached the metal conductor, reflecting and then passing through the cavity again to be detected. As points a and c corresponded to water hole, where the THz signal could barely pass through 3 mm of water, the signal could not continue to propagate, whereas points b and d corresponded to air hole, where the THz signal could continue to propagate to the metal wire interface and be detected after being reflected, despite high losses. In the actual transmission process, the structure of the air hole will also have a great influence on the transmission of the signal, which is equivalent to a negative lens. It can change the direction of the signal transmission, making the identification of echoes more difficult. In contrast, there were much more pronounced echoes on the metal interface at points e and f.
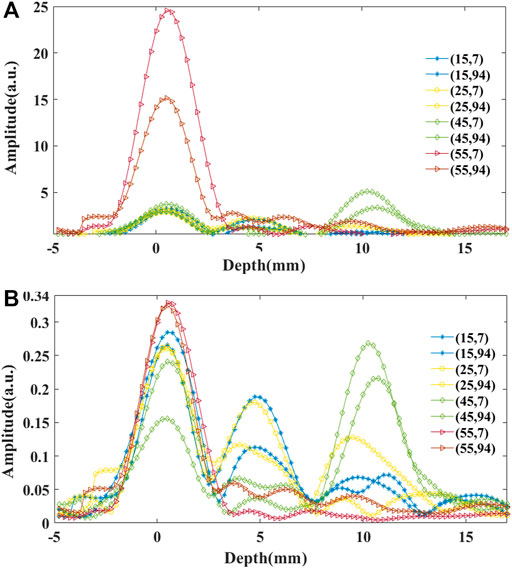
FIGURE 5. THz A-scan images of depth direction at different positions. (A) Raw data. (B) Normalised data.
Although not easily observed in raw data, the transmission characteristics of the scattered echo signals can be highlighted by normalising the signals, as shown in Figure 5B. After normalisation, the relative energies of the scattered echoes corresponding to the cavity locations at points a, b, c, and d were highlighted. The echo energy at the metal wire interface could also be identified, with those at points a, b, and c remaining small, although the reflection peak at point d became more pronounced at those locations. Despite the complex transmission process being influenced by the fine structure of the sample and the homogeneity of the material, the choice of the relative threshold helps to segment the different signal features.
To further identify the signal characteristics, the height values of 15, 25, 45, and 55 mm were still taken to construct the B-scan images of angle and depth positions, including the Cartesian and column coordinates. The image composed of cylindrical coordinates has better contrast with the spatial size of the real object, as shown in Figure 6. At height positions of 15 and 25 mm, the angle positions corresponded to the water hole in the insulation layer when the ranges were 355–360° and 0–25° and corresponded to the air hole with angles ranging between 90 and 120°. The effects of water hole and air hole on the transmission of the THz signals are different. Water absorbs THz signals very strongly, making it difficult for the signal to pass through the water holes, and the reflection at the interface between the water and insulation layer is stronger. The air holes partially permit signal transmission, and the THz signal undergoes multiple transmissions in the air hole, making the characteristics of the scattered echoes at ha more complex. As depicted in Figures 6A,B, the depth-dimensional signal at water hole contains the surface echo of the insulation layer and the scattered echoes of the water hole. The signal at the air hole similarly includes the surface echoes of the insulation layer, the air hole echoes, and the echoes of the metal conductor core interface. The characteristics of the scattered echoes of the air hole are more diversified. As displayed in Figure 6C, at the height position of 45 mm, no hole defects are observed in the insulation layer, and the signal characteristics are mainly shown as reflected echoes from the front surface of the insulation layer and the metal conductor core. As presented in Figure 6D, at the height position of 55 mm, only the reflected signal from the metal shield can be observed, and at angles of 180–210°, the metal shield is not covered, and the THz signal can penetrate the insulation layer to reach the metal conductor interface.
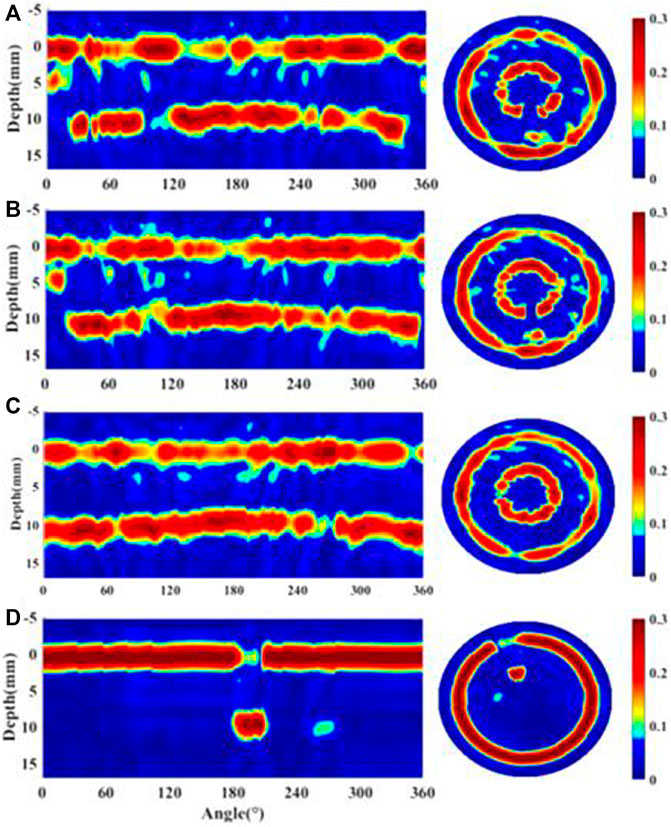
FIGURE 6. THz B-scan images at different height positions in Cartesian and column coordinates. (A) 15 mm; (B) 25 mm; (C) 45 mm; (D) 55 mm.
Therefore, as shown in Figure 7A, in the height range of 12–28 mm and the angle range of 1–20°, in the water hole position range, the signal characteristics of the A-scan image in the depth direction are similar, and they are consistent with the physical structure characteristics of the specimen in this area. Similarly, as shown in Figure 7B, at heights ranging between 12 and 28 mm, angles ranging between 95 and 112°, and the air hole position, the signal characteristics of the A-scan image in the depth direction is consistent with the physical structure characteristics of the air hole. At heights ranging between 35 and 48 mm and angles ranging between 1 and 360°, there are no air holes in the insulation, and the signal features highlight the interface between the front of the insulation and the metal conductor core, as shown in Figure 7C. At heights ranging between 12 and 28 mm and angles ranging between 130 and 350° as well, there are no air holes in the insulation layer, and the signal characteristics are consistent with the signal special in Figure 7C, as shown in Figure 7D. This also indicates that when there are air or water hole defects in the insulation layer, the signal characteristics will be different from those in the absence of defects, which provides a physical model reference for detecting and identifying the presence of defects.
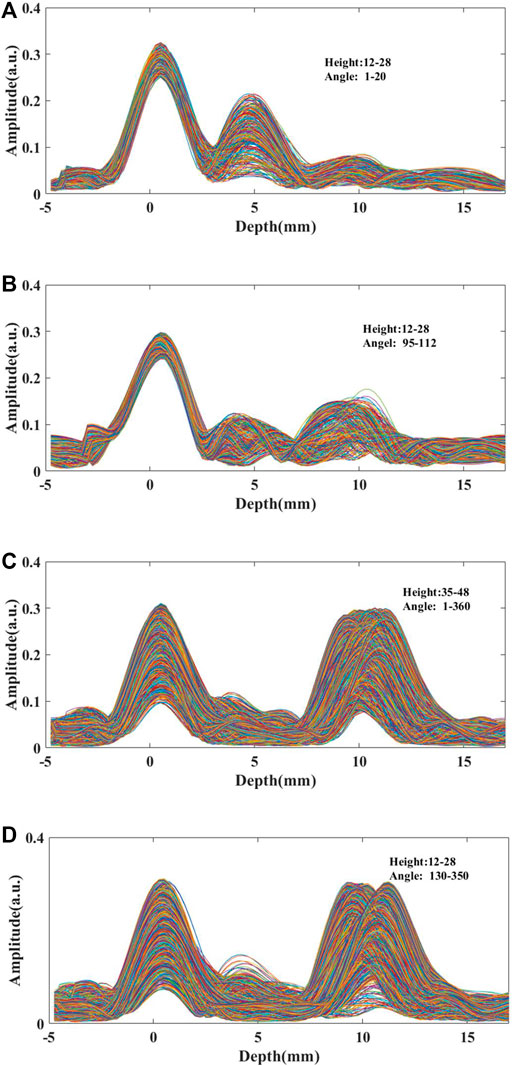
FIGURE 7. A-scan signal characteristics in different height and angle ranges. (A) Height: 12–28 mm, angle: 1–20°; (B) Height: 12–28 mm, angle: 95–112°; (C) Height: 35–48 mm, angle: 1–360°; (D) Height: 12–28 mm, angle: 130–350°.
After confirming the signal characteristics, the profile data corresponding to all height positions are reconstructed to map the 3D morphology of the cable structure. For the strongly reflected signals of the metal shield and metal conductor core, the 3D reconstruction is performed using the original data, as shown in Figure 8. Setting a higher threshold value can highlight the metal shield and wire structure, as shown in Figure 8A. The appropriate adjustment of the threshold value can show the morphology of the outer surface of the insulation material, and the overall structure presented is in good agreement with the physical structure dimensions of the cable, as shown in Figure 8B.
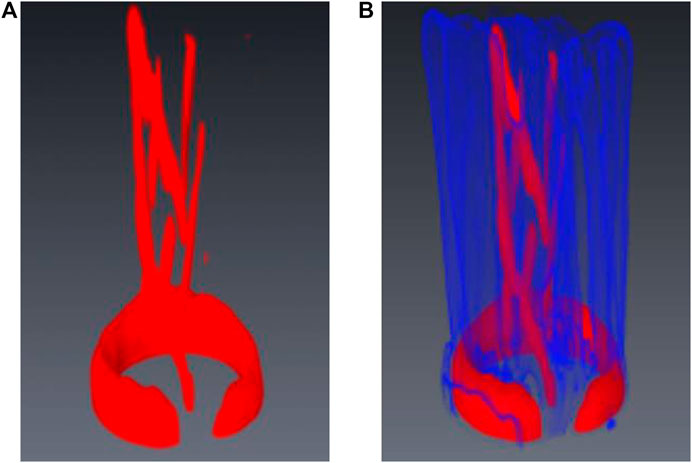
FIGURE 8. 3D THz images of the reconstructed high-voltage cable at different thresholds. (A) 4; (B) 3.
The normalised data is used for three-dimensional reconstruction, and a reasonable threshold is set. The results are shown in Figure 9. Although there are still some peculiar noises, the three-dimensional morphologies of the water holes and air holes in the insulating layer can be well identified under different viewing angles. The image morphology due to the water holes is directly observed in Figure 9A, and the image morphology due to the air holes is observed in Figure 9B, which visualises the effect of anomalous defects in the insulation layer on the THz transmission and facilitates the evaluation of the cable quality.
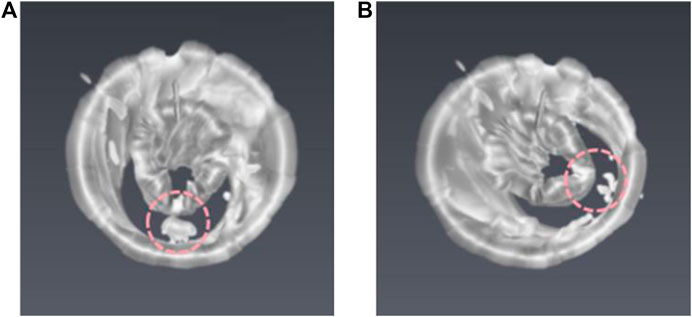
FIGURE 9. Reconstructed 3D THz images of the high-voltage cable from different perspectives. (A) Oblique view for the water hole; (B) oblique view for the air hole.
Furthermore, the automatic recognition of signal features was demonstrated by the PCA-SVM method [33–35]. All the data were set as a test set with a height range from 1 to 57 mm and angle range from 1 to 360°. First, PCA was used to reduce the dimensionality of the measured dataset. This can significantly save computation and almost has no loss of data reliability. The contribution rates of each principal component are listed in Table 1. The contribution rate of the principal component refers to the proportion of variance of the principal component in the total variance of the data. As shown in Figure 4 and Figure 7, the dataset can be roughly divided into five categories: air background, water hole, air hole, defection-free zone, and metal shield zone. A part of the signal from these five types of data zones is selected as a standard feature dataset and is trained to build signal feature models. The training sets are listed in Table 2.
The first four, five, six, and seven principal component features were used as data inputs, and the cumulative variance contribution rates were 77.2485%, 84.3089%, 88.2334%, and 90.3776%, respectively. The feature models were established using the SVM method with five types of features for training. The entire dataset is then predicted. The distribution of the classification eigenvalues for the different cumulative variance contribution rates are shown in Figures 10A–D, and consistent with the physical characteristics of actual specimens. The tomographic images are also in good agreement with the actual specimens but contained more interference information, which is shown in Figure 4C. The characteristic value distribution imaging obtained by the PCA-SVM method is more obvious and intuitive. In Figure 10A the X zones are identified as the air background and water holes; the Y zones are identified as the metal shield and water holes; the Z zones are indntified as the metal shield. In Figure 10B, they are identified as the air hole and a few water holes, a few metal shield and water holes, and a few metal shield. In Figure 10C, they are identified as the air hole and fewer water holes, fewer metal shield and water holes, and fewer metal shield. In Figure 10D, they are identified as the air hole and fewer water holes, only water holes, and defection-free. Compared with Figures 10A–D are more consistent with the physical characteristics. This indicates that a higher contribution rate of the cumulative variance results in a more reliable prediction result. Figures 10C,D are basically consistent and indicate that when the cumulative variance contribution rate reaches a certain value, the prediction results tend to be stable. Although there are still some singularities in classification recognition, it has played a significant role in early warning when facing the feature identification task of massive data. Combined with the corresponding 3D imaging shown in Figure 9, it can yield a more reliable conclusion. This allows human experts to efficiently focus on signal analysis that is difficult for machines to evaluate automatically, which helps improve the efficiency and reliability of the result analysis.
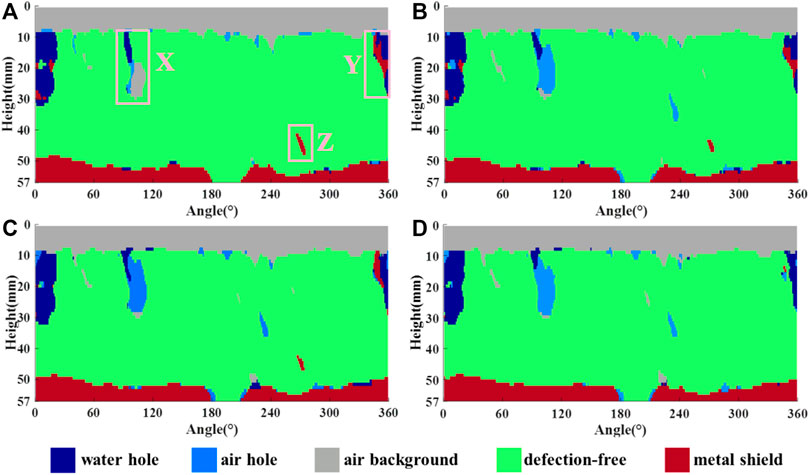
FIGURE 10. Distribution imaging of classification eigenvalues for different cumulative variance contribution rates. (A) 77.2485%; (B) 84.3089%; (C) 88.2334%; (D) 90.3776%.
Conclusion
We demonstrated that THz 3D NDT imaging technology can be applied to the detection of the internal structure of a high-voltage cable. The combination of machine learning classification with 3D imaging will improve the efficiency and reliability of automatic defect recognition. The results show a good application prospect. The FMCW system usually has lower imaging resolution than TDS system, but it is more suitable for using in field conditions. The system uses all-solid-state devices, so it is easier to achieve portability; The operating frequency range is 225–330 GHz, so it is less affected by atmospheric environment. With the development of more miniaturized, high-power, bandwidth FM transceiver devices, more integrated and portable equipment will not only be able to better meet the needs of actual cable testing application scenarios, but also can be extended to many other non-destructive testing applications.
Data Availability Statement
The original contributions presented in the study are included in the article/Supplementary Material, further inquiries can be directed to the corresponding author.
Author Contributions
Conceptualization, methodology, formal analysis, writing—original draft preparation, and visualization, ZZ; investigation, writing—review and editing, ZZ and XJ; data curation, JR, WY, GH, and HS; supervision, ZY and ZC; project administration, ZY; funding acquisition, ZY, and ZZ.
Funding
This work was supported in part by the National Key R&D Program of China (2020YFB2009303), the State Key Program of National Natural Science of China (61935001), and the Joint Fund of Aerospace Manufacturing of the National Nature Foundation of China (U1837202).
Conflict of Interest
The authors declare that the research was conducted in the absence of any commercial or financial relationships that could be construed as a potential conflict of interest.
Publisher’s Note
All claims expressed in this article are solely those of the authors and do not necessarily represent those of their affiliated organizations, or those of the publisher, the editors and the reviewers. Any product that may be evaluated in this article, or claim that may be made by its manufacturer, is not guaranteed or endorsed by the publisher.
References
1. Du BX, Li ZL, Yang ZR, Li J. Application and Research Progress of HVDC XLPE Cables[J]. High Volt Eng (2017) 43(2):14–24. doi:10.13336/j.1003-6520.hve.20170123002
2. Salah Khalil M. International Research and Development Trends and Problems of HVDC Cables with Polymeric Insulation. IEEE Electr. Insul. Mag. (1997) 13(6):35–47. doi:10.1109/57.637152
3. Densley R. An Investigation into the Growth of Electrical Trees in XLPE Cable Insulation. IEEE Trans. Elect. Insul. (1979) EI-14(3):148–58. doi:10.1109/TEI.1979.298215
4. Dissado LA. Predicting Electrical Breakdown in Polymeric Insulators. From Deterministic Mechanisms to Failure Statistics. IEEE Trans. Dielect. Electr. Insul. (2002) 9(5):860–75. doi:10.1109/TDEI.2002.1038669
5. Chen G, Tham C. Electrical Treeing Characteristics in XLPE Power Cable Insulation in Frequency Range between 20 and 500 Hz. IEEE Trans. Dielect. Electr. Insul. (2009) 16(1):179–88. doi:10.1109/TDEI.2009.4784566
6. Du BX, Ma ZL, Gao Y, Han T. Effect of Ambient Temperature on Electrical Treeing Characteristics in Silicone Rubber. IEEE Trans. Dielect. Electr. Insul. (2011) 18(2):401–7. doi:10.1109/TDEI.2011.5739443
7. Laurent C, Mayoux C. Analysis of the Propagation of Electrical Treeing Using Optical and Electrical Methods. IEEE Trans. Elect. Insul. (1980) EI-15(1):33–42. doi:10.1109/TEI.1980.298294
8. Watanabe E, Moriya T, Yoshizawa M. Ultrasonic Visualization Method of Electrical Trees Formed in Organic Insulating Materials. IEEE Trans. Dielect. Electr. Insul. (1998) 5(5):767–73. doi:10.1109/94.729701
9. Ueno H, Walter P, Cornelissen C, Schnettler A. Resolution Evaluation of Ultrasonic Diagnosis Tools for Electrical Insulation Devices and the Detection of Electrical Trees. IEEE Trans. Dielect. Electr. Insul. (2007) 14(1):249–56. doi:10.1109/TDEI.2007.302893
10. Thomas G, Flores-Tapia D, Pistorius S, Fernando N. Synthetic Aperture Ultrasound Imaging of XLPE Insulation of Underground Power Cables. IEEE Electr. Insul. Mag. (2010) 26(3):24–34. doi:10.1109/MEI.2010.5482785
11. Reid AJ, Zhou C, Hepburn DM, Judd MD, Siew WH, Withers P. Fault Location and Diagnosis in a Medium Voltage EPR Power Cable. IEEE Trans. Dielect. Electr. Insul. (2013) 20(1):10–8. doi:10.1109/TDEI.2013.6451336
12. Schurch R, Rowland S, Bradley R, Withers P. Imaging and Analysis Techniques for Electrical Trees Using X-Ray Computed Tomography. IEEE Trans. Dielect. Electr. Insul. (2014) 21(1):53–63. doi:10.1109/TDEI.2013.003911
13. Hu BB, Nuss MC. Imaging with Terahertz Waves. Opt. Lett. (1995) 20(16):1716–8. doi:10.1364/OL.20.001716
14. Karpowicz N, Zhong H, Zhang C, Lin K-I, Hwang J-S, Xu J, et al. Compact Continuous-Wave Subterahertz System for Inspection Applications. Appl. Phys. Lett. (2005) 86:054105. doi:10.1063/1.1856701
15. Zhang ZW, Cui WL, Zhang Y, Zhang CL. Terahertz Time-Domain Spectroscopy Imaging [J]. J Infrared Millim Waves (2006) 25(003):217–20. doi:10.1677/jme.1.02008
16. Quast H, Loffler T. 3D-terahertz-tomography for Material Inspection and Security. In: IRMMW-THz 2009. 34th International Conference on IEEE. Busan, South Korea: IEEE (2009). doi:10.1109/ICIMW.2009.5325639
17. Zhang Z, Wang K, Lei Y, Zhang Z, Zhao Y, Li C, et al. Non-destructive Detection of Pigments in Oil Painting by Using Terahertz Tomography. Sci. China Phys. Mech. Astron. (2015) 58(12):124202. doi:10.1007/s11433-015-5744-x
18. Friederich F, May K, Baccouche B, Matheis C, Bauer M, Jonuscheit J, et al. Terahertz Radome Inspection. Photonics (2018) 5(1):1–10. doi:10.3390/photonics5010001
19. Shen Y-C, Yang X-Y, Zhang Z-J. Broadband Terahertz Time-Domain Spectroscopy and Fast FMCW Imaging: Principle and Applications*. Chin Phys. B (2020) 29(7):078705. doi:10.1088/1674-1056/ab9296
20. Sato R, Komatsu M, Ohki Y, Fuse N, Nakamichi Y, Mizuno M, et al. Observation of Water Trees Using Terahertz Spectroscopy and Time-Domain Imaging. IEEE Trans. Dielect. Electr. Insul. (2011) 18(5):1570–7. doi:10.1109/TDEI.2011.6032826
21. Komatsu M, Sato R, Mizuno M, Fukunaga K, Ohki Y. Feasibility Study on Terahertz Imaging of Corrosion on a Cable Metal Shield. Jpn. J. Appl. Phys. (2012) 51:122405. doi:10.1143/JJAP.51.122405
22. Takahashi S, Hamano T, Nakajima K, Tanabe T, Oyama Y. Observation of Damage in Insulated Copper Cables by THz Imaging. NDT E Int. (2014) 61:75–9. doi:10.1016/j.ndteint.2013.10.004
23. Yan Z, Shi W, Hou L, Xu M, Yang L, Dong C, et al. Investigation of Aging Effects in Cross-Linked Polyethylene Insulated Cable Using Terahertz Waves. Mat. Res. Express (2017) 4(1):015304. doi:10.1088/2053-1591/aa5237
24. Lee I-S, Lee JW. Nondestructive Internal Defect Detection Using a CW-THz Imaging System in XLPE for Power Cable Insulation. Appl Sci (2020) 10(6):2055. doi:10.3390/app10062055
25. Xie SY, Yang F, Huang X, Yu X, Gao B. Air Gap Detection and Analysis of XLPE Cable Insulation Based on Terahertz Time Domain Spectroscopy[J]. Trans China Electrotech Soc (2020) 35(12):10. doi:10.19595/j.cnki.1000-6753.tces.190662
26. Li S, Cao B, Kang Y, Cui Y, Dong H. Nonintrusive Inspection of Moisture Damp in Composited Insulation Structure Based on Terahertz Technology. IEEE Trans. Instrum. Meas. (2021) 70:1–10. doi:10.1109/TIM.2021.3117360
27. Langenbach M, Roggenbuck A, Cámara Mayorga I, Deninger A, Thirunavukkuarasu K, Hemberger J, et al. Group Delay in THz Spectroscopy with Ultra-wideband Log-Spiral Antennae. J Infrared Milli Terahz Waves (2014) 35(11):918–31. doi:10.1007/s10762-014-0098-4
28. Chen B, Lou L, Tang K, Wang Y, Gao J, Zheng Y. A 13.5-19 GHz 20.6-dB Gain CMOS Power Amplifier for FMCW Radar Application. IEEE Microw. Wirel Compon. Lett. (2017) 27(4):377–9. doi:10.1109/LMWC.2017.2679047
29. Kwon D-H. Effect of Antenna Gain and Group Delay Variations on Pulse-Preserving Capabilities of Ultrawideband Antennas. IEEE Trans. Antennas Propagat. (2006) 54(8):2208–15. doi:10.1109/TAP.2006.879189
30. Dong YW, Liang XD, Ding CB. Non-linear Signal Processing for FMCW SAR[J]. J Electron Inf Technol (2010) 32(5):1034–9. doi:10.3724/SP.J.1146.2009.00582
31. Eichel PH, Ghiglia DC, Jakowatz CV. Speckle Processing Method for Synthetic-Aperture-Radar Phase Correction. Opt. Lett. (1989) 14(1):1–3. doi:10.1364/OL.14.000001
32. Bates RHT, Cady FM. Towards True Imaging by Wideband Speckle Interferometry. Opt Commun (1980) 32(3):365–9. doi:10.1016/0030-4018(80)90261-8
33. Cortes C, Vapnik V. Support-vector Networks. Mach Learn (1995) 20(3):273–97. doi:10.1007/BF00994018
34. Hotelling H. Analysis of a Complex of Statistical Variables into Principal Components. J Educ Psychol (1933) 24(6):417–41. doi:10.1037/h0071325
Keywords: terahertz, terahertz imaging, non-destructive testing, frequency modulated continuous wave, cross-linked polyethylene, 110.2970, 120.4290, 110.6795
Citation: Zhenwei Z, Jing X, Rui J, Yinghong W, Hao G, Siyi H, Cunlin Z and Yuejin Z (2022) Terahertz Non-Destructive Testing and Imaging of High-Voltage Cables. Front. Phys. 10:893145. doi: 10.3389/fphy.2022.893145
Received: 10 March 2022; Accepted: 13 April 2022;
Published: 28 April 2022.
Edited by:
Hichem Guerboukha, Brown University, United StatesReviewed by:
Lei Hou, Xi’an University of Technology, ChinaEhtasham Mustafa, Gomal University, Pakistan
Copyright © 2022 Zhenwei, Jing, Rui, Yinghong, Hao, Siyi, Cunlin and Yuejin. This is an open-access article distributed under the terms of the Creative Commons Attribution License (CC BY). The use, distribution or reproduction in other forums is permitted, provided the original author(s) and the copyright owner(s) are credited and that the original publication in this journal is cited, in accordance with accepted academic practice. No use, distribution or reproduction is permitted which does not comply with these terms.
*Correspondence: Zhao Yuejin, eWp6aGFvQGJpdC5lZHUuY24=
 Zhang Zhenwei
 Xu Jing1
