- 1Department of Physics and Astronomy “Ettore Majorana”, University of Catania, Catania, Italy
- 2Complexity Science Hub Vienna (CSH), Vienna, Austria
- 3INFN Sezione di Catania, Catania, Italy
The rise of disinformation in the last years has shed light on the presence of bad actors that produce and spread misleading content every day. Therefore, looking at the characteristics of these actors has become crucial for gaining better knowledge of the phenomenon of disinformation to fight it. This study seeks to understand how these actors, meant here as unreliable news websites, differ from reliable ones. With this aim, we investigated some well-known fake and reliable news sources and their relationships, using a network growth model based on the overlap of their audience. Then, we peered into the news sites’ sub-networks and their structure, finding that unreliable news sources’ sub-networks are overall disassortative and have a low–medium clustering coefficient, indicative of a higher fragmentation. The k-core decomposition allowed us to find the coreness value for each node in the network, identifying the most connectedness site communities and revealing the structural organization of the network, where the unreliable websites tend to populate the inner shells. By analyzing WHOIS information, it also emerged that unreliable websites generally have a newer registration date and shorter-term registrations compared to reliable websites. The results on the political leaning of the news sources show extremist news sources of any political leaning are generally mostly responsible for producing and spreading disinformation.
1 Introduction
The use of new technologies and the growing number of alternative information sources—often unreliable—have dramatically changed how news is delivered, hence the reading habits of online users. This has led to reviewing and redefining not only people’s beliefs and perceptions of source credibility [1] but also the way people assimilate information faster and more automatically than ever.
The 2016 US elections and the recent SARS-CoV-2 pandemic have put a spotlight on the inappropriate use of some of these technologies to boost the production and dissemination of fake news and deceptive content across the World Wide Web (Web, for short). The increase in the number of new domains, often created by internal or foreign actors to promote false information [2] and undermine public opinion, has further contributed to the problem of information overload, also driven by the absence of content regulation on the Internet [3], which guarantees the basic prerequisite of democracy (freedom of thought, belief, opinion, and expression), and by the ease of the process of buying a domain name and building a website. Website builders, such as Wix [4], GoDaddy [5], and Wordpress [6], help make one’s voice heard by offering basic plans that make it easy, fast, and user-friendly and are of low-cost to create, host, and manage the content of a website or blog, giving the possibility, for individuals or companies, to earn some extra money by placing ads and then converting web-traffic into revenue [7]. However, a large number of websites and their activities on the Web are difficult to access and monitor.
Since the 90s, the study of the Web has attracted the attention of scientific communities in an attempt to better understand its topological structure. The model proposed by Albert et al. [8], for instance, illustrated the Web as a huge network whose nodes are the Web pages, and the links between the Web pages (hyperlinks) are the edges. [9] found that on the Web and in most real-world networks the number of links follows a power-law degree distribution (scale-free property) [10, 11], revealing that a minority of nodes are highly connected (hubs), whereas the vast majority have smaller degrees than average.
By modeling the websites and pages on the Web, Broder et al. [12] discovered that it has a bow-tie structure, with most accessible pages in a giant strongly connected component (GSCC) and pages that have not been linked yet to the GSCC in the IN or OUT component (the sides of the bow tie). A recent study [13] has shown the presence, on the Web, of local bow-tie structures, as most websites tend to focus on specific topics and content, being able to rely on traffic from loyal online users and frequent visitors.
Although the attention of researchers has shifted to the study of communities that populate social media platforms and the spread of disinformation within these environments in recent years [14–21], the Web can still represent an important resource for the study of online disinformation, allowing researchers to investigate the role of websites and their relationships that emerge into complex social structures, identifying communities, meant here as groups of websites [22] that are more densely connected than others (sparse connections) and share similar features.
The identification of such communities within the Web can, therefore, allow the detection of websites spreading misleading information and fabricated news, using the “friend of a friend” mechanism proposed by [23], which states that if two nodes (e.g., websites 1 and 2) are strongly linked to another one (e.g., website 3), then with very high probability they are strongly linked to each other (triadic closure) [24].
Based on the above, this study focuses on websites’ similarities to examine groups of websites sharing similar characteristics such as audience overlap or WHOIS information (e.g., registration/expiration date) to understand how to detect the increasing number of groups of websites that may spread false content.
In particular, this study focuses on some well-known international unreliable websites, that is, websites that have published or shared misleading content across the Web over the past years and mainstream media outlets. For each selected website, information on audience overlap, that is, a Search Engine Optimization (SEO) metric that provides insights on the overlap of audience and topics across analyzed websites, is extracted in order to build sub-networks by adding competitors as nodes and connect them based on this metric. By combining all the sub-networks, we derived a full network of approximately 12,200 nodes. As real-world systems have distinct topologies, networks and sub-networks’ structural properties, such as degree size, clustering coefficient, cliques, and degree-assortativity, are analyzed to get valuable insights on website relationships, especially among those that spread (fake) news.
The significance of this study in relation to the field of disinformation is as follows:
• Different from research studies focusing on the analysis of users as fake news spreaders, in this work, attention is paid to websites as the source of news.
• In order to identify website communities, that is, websites that share similar characteristics, including fake news sharing, we use Complex Networks analysis for gathering insights on relationships among websites that share audience. As previously said, the audience overlap feature is an important metric in SEO, provided by intelligence tools such as Alexa [25] or SimilarWeb [26], and it may be useful for considering the problem of disinformation from a different perspective. In the current state of the art, the use of SEO metrics has not been widely employed to identify fake news sources and their connections.
2 Materials and Methods
2.1 Data Collection
We collected a list of unreliable websites due to the production of news created to deliberately misinform or deceive readers. The selection of these websites was based on the blacklists provided by international fact-checking websites (PolitiFact.com [27], poynter.org [28]) and the well-known reputable websites (csbnews.com [29]). Along with this list, we have a list of traditional, free, or least biased news sources which generally deliver reliable information supported by facts [20]. The list of unreliable and reliable news websites used for this study for building the sub-networks and then the full network are shown in Table 1.
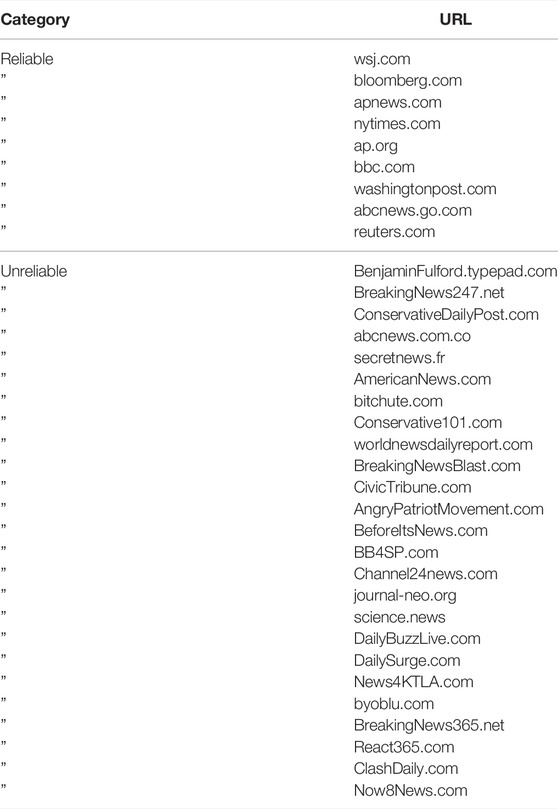
TABLE 1. Original list of unreliable/reliable news websites used for this study. Along the list of unreliable news websites that deliver false information to deliberately/unintentionally misinform or deceive readers, a list of mainstream and well-respected news sources that publish credible content was analyzed. Each website listed in this table represents the starting node in the network growth model.
Due to the huge number of unreliable websites that are registered every day worldwide, website selection was performed on some of the most frequently reported untrustworthy websites by well-known fact-checking websites.
For each website included in the original list (Table 1), we extracted up to five competitor websites based on audience overlap (AO) to get a representative sample of similar websites (competitors) for each website in our list. Specifically, the AO score indicates the similarity level between competitors and an analyzed website (target). Competitor analysis can provide valuable insights on potential competitors that could offer products or services (including news production and consumption) targeting the same audience as a particular target website (market segmentation). Information on AO is provided by external competitor analysis tools (e.g., Alexa or SimilarWeb) within SEO strategy.
Figure 1 illustrates the schematic iteration process to generate the final dataset comprising the initial list of reliable or unreliable news sources and their competitors. For each competitor, its audience overlap score is also collected. As shown in Figure 1 (dashed blue line box), once getting the first list of competitors of URL1 (iteration 1), the process runs again, now considering the list of competitors as target websites and collecting information on their competitors, extracting the AO scores. This process is repeated up to six iterations. A stopping criterion was set due to the exponential growth in the amount of data during the collection phase. We stopped the process after six iterations due to the “six-degree” phenomenon, which applies to many kinds of networks, including the social ones, and which should ensure that other websites are generally reached through an average of six websites [30–32]. As recent analyses on social networks have found that the average separation in a Facebook friend graph is less than four degrees [33, 34], this criterion should be enough to guarantee the distance distribution of websites, in a similar way to social networks, and a good sample of data.
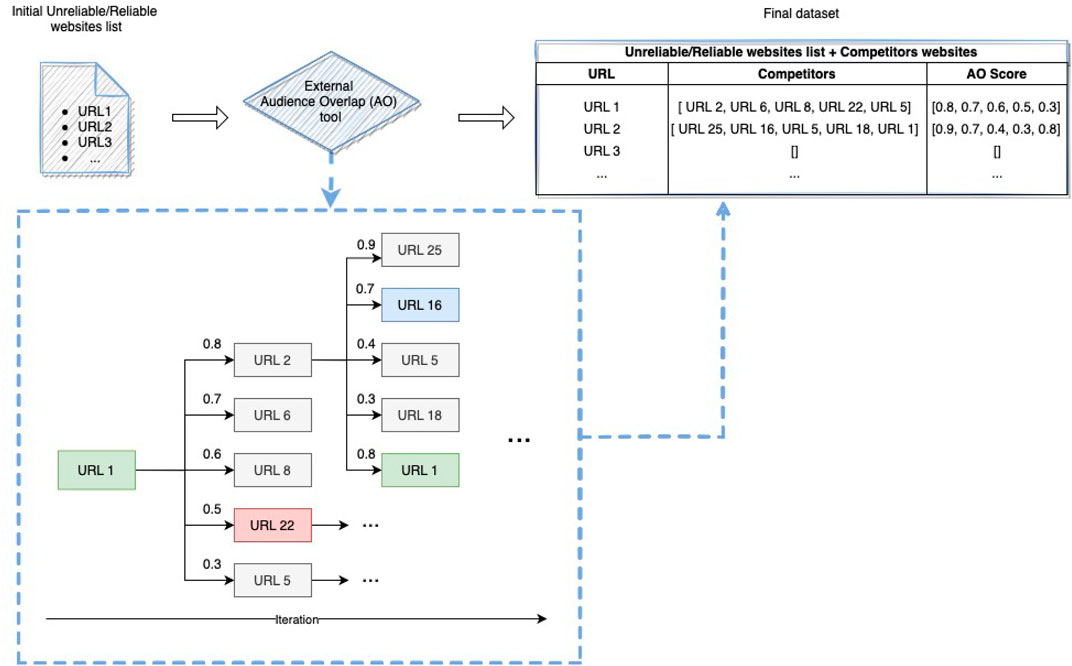
FIGURE 1. Data collection process. For each individual URL included in the list of reliable/unreliable websites (targets), competitors are extracted using external audience overlap (AO) tools. For each competitor extracted, the AO score, namely, an indicator of the similarity level between the competitor and the target, is also collected. The process for extracting AO information is repeated iteratively for each competitor, extracted at each iteration. Due to the exponential growth in the website population through iterations, we set a threshold (niter = 6) to stop the process.
Once getting all the information about competitors, a result dataset is created, removing any duplicate information. It is interesting to note that two or more websites may be competitors and present in their respective lists. However, due to the decreasing order of the overlap score and the limited number of competitors provided by SEO tools (generally up to 5), some websites may not be mutually present in the lists due to their higher similarity with other websites listed at the top. In order to not lose this information, the relationships, if any, between any two similar websites were considered reciprocal. Data was collected between July 2021 and August 2021.
The use of network analysis on these data allows us to represent nodes’ attributes and relationships in order to identify properties of the interactions that occur between the websites in the initial list, their competitors, and the competitors of their competitors.
For this purpose, we consider a graph, defined as G≔{V, E}, where V is the set of vertices, that is, websites (e.g., websites or blogs) within this context, and E≔{(i, j)|i, j ∈ V, i ≠ j, E ⊆ V × V} is the set of all pairs of distinct vertices, called edges, representing a relationship based on audience overlap between two websites i and j.
Therefore, the process illustrated in Figure 2 consists of adding, at each iteration, new nodes that connect to the existing nodes in the sub-network if they exhibit an audience overlap. We model this process as follows: let C be the set of cascades containing numbers of cascades as C = {c}. Each snapshot of cascade c at iteration n is described by a sub-graph
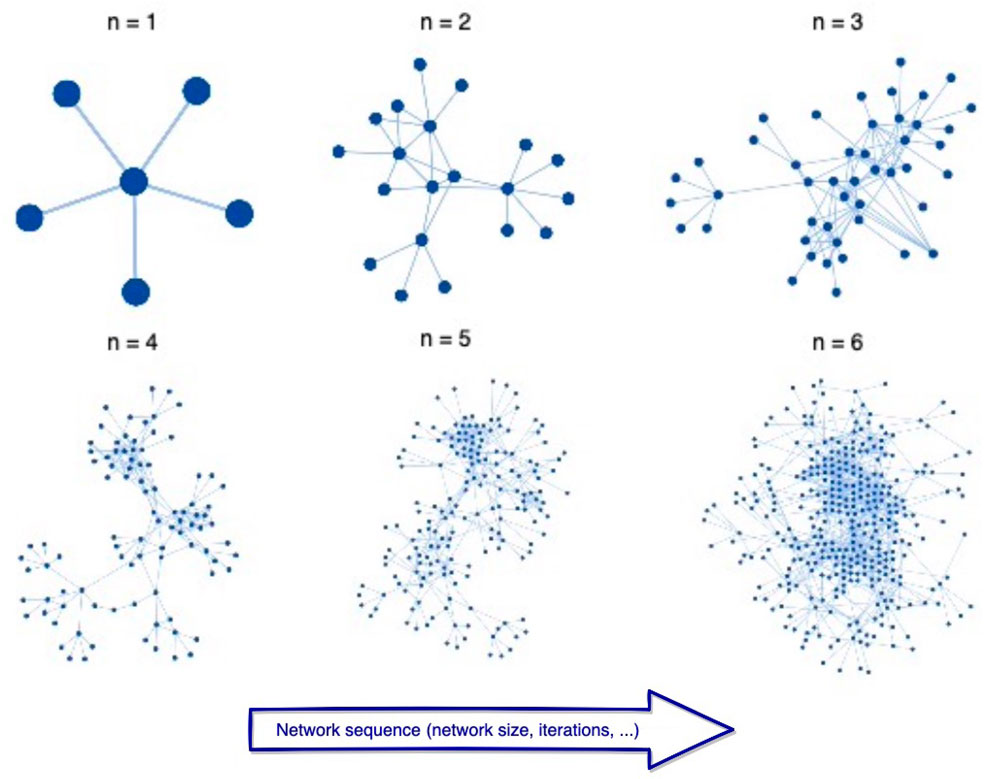
FIGURE 2. Sub-network growth process. Starting (n = 1) from a single node (site), at each iteration n, a representative sample—consisting of the top five nodes which present the highest audience overlap with the analyzed website—is added per each new node included in the sub-network. The nodes are linked to each other if there is a relationship based on audience overlap. The process stops after six iterations, according to the “six-degree separation” phenomenon, which states that nearly everyone is only six steps away.
By applying the process shown in Figure 2 to each website in Table 1, we built several sub-networks, one for each website in the list. From the union of all these sub-networks, we built the final full network.
2.2 Data Labeling
Once the network growth process is complete and all the websites are included in the final dataset, we assign to each of these websites a label that stems from two independent assessments as follows:
• A fact-checking assessment, where labels were assigned through the use of credible, trustworthy, and authoritative sources on the Web (e.g., fact-checking websites), which verify claims thanks to the effort of qualified staff (journalists, analysts, and other professionals) that play a key role in the identification of misleading online content;
• A scam inspection, where labels were assigned through reputation checker tools that help identify if websites are scam/fraudulent or infected with malware.
The above assessments help fix discrepancies in labeling criteria (which may impact the analysis) and improve label quality against final manual labeling. The labeling phase was performed in December 2021.
Based on the reported valuation on fact-checking (e.g., PolitiFact [27] and Poynter [28]) and scam-adviser websites (e.g., ScamAdviser [34]), websites are classified in a six-way classification schema. The schema includes the following macro-categories:
• True (1): the websites under this class are labeled with +1 and are news sources that share true or mostly true content, mostly verified by fact-checking organizations.
• Mostly True (0.5): this class includes news sources that contain mostly true content. They are labeled with 0.5.
• Mostly False (−0.5): this class includes news sources that contain mostly false content. They are labeled with −0.5.
• False (−1): this class includes news sources with articles containing no factual content, for which there is not yet a report/rating on fact-checking websites. They are labeled with −1.
• Neutral (0): this class includes all the websites not in the scope of this analysis (e.g., personal blogs that do not share any public-relevant content; shops; online services; download/streaming/betting/gambling platforms; adult content; and scam or negative reviewed websites). Because of their frequency, the following sub-categories within the neutral category are also identified:-scam/negative reviewed/crypto payments websites:- Downloading/streaming/gambling/betting/dating or adult-content websites;- Gossip, entertainment, and celebrity websites;- Malicious websites, that is, websites that attempt to install malware;- Medicine/vaccination-related websites;- Pseudo-science/religion/spiritualism-related websites;- Social platforms/Web Search Engines/forums;- War/military/gun-related websites;- Web services/online tools/SEO services;- Other languages websites, that is, websites whose content was not in English, Italian, Spanish, or French.
• Missing data (9): this class includes domains that are expired, parked, closed, or require login information. It was decided to keep URLs within this class rather than removing them from the dataset, as many websites, especially the suspicious and malicious ones, usually are short-lived [36]. They are informative for the purpose of this study.
Throughout this paper, the term “reliable” will be used to refer to websites within the categories “True” and “Mostly True,” whereas the term “unreliable” will be used to refer to websites within the categories “False” and “Mostly False.” These two categories also include the websites listed in Table 1.
The labels assigned are mutually exclusive. According to the scope of this work, priority was given to labels from fact-checking assessments rather than the scam ones. In fact, although all websites in the final list (about 12,200 distinct websites) have scam labels, only some are news websites. Accordingly, we assigned website labels to news (False/True) from fact-checking websites where present or performed a manual label assignment to identify news websites based on their content (Mostly False/True). As discussed above, we performed further sub-classification within the “Neutral” class. The distribution of websites inside the aforementioned macro-categories is as follows: 9,976 websites in the “Neutral” category; 509 websites in the “Mostly False” category; 489 websites in the “False” category; 134 websites in the “Mostly True” category; 254 websites in the “True” category; and 850 websites in “Missing data” category.
3 Results
3.1 Network Analysis
We built undirected, unweighted sub-networks, where each node represents a unique website, and an undirected link is added between two nodes whenever a website has an overlap of the audience with another website. Isolated nodes correspond to websites whose audience is too small to be detected. Once all data are collected for each website in the list and sub-networks are built, they are combined into one full network.
Figure 3 illustrates the full network formed by all the websites listed in Table 1 and their competitors, built by following the process described in Section 2.1. There are 12,107 non-isolated nodes and 18,161 links. Colors are assigned to nodes based on the macro-categories discussed in Section 2.2. Networks are generated using Graphistry, a GPU-accelerated platform that allows users to investigate more quickly and easily big networks and Python.
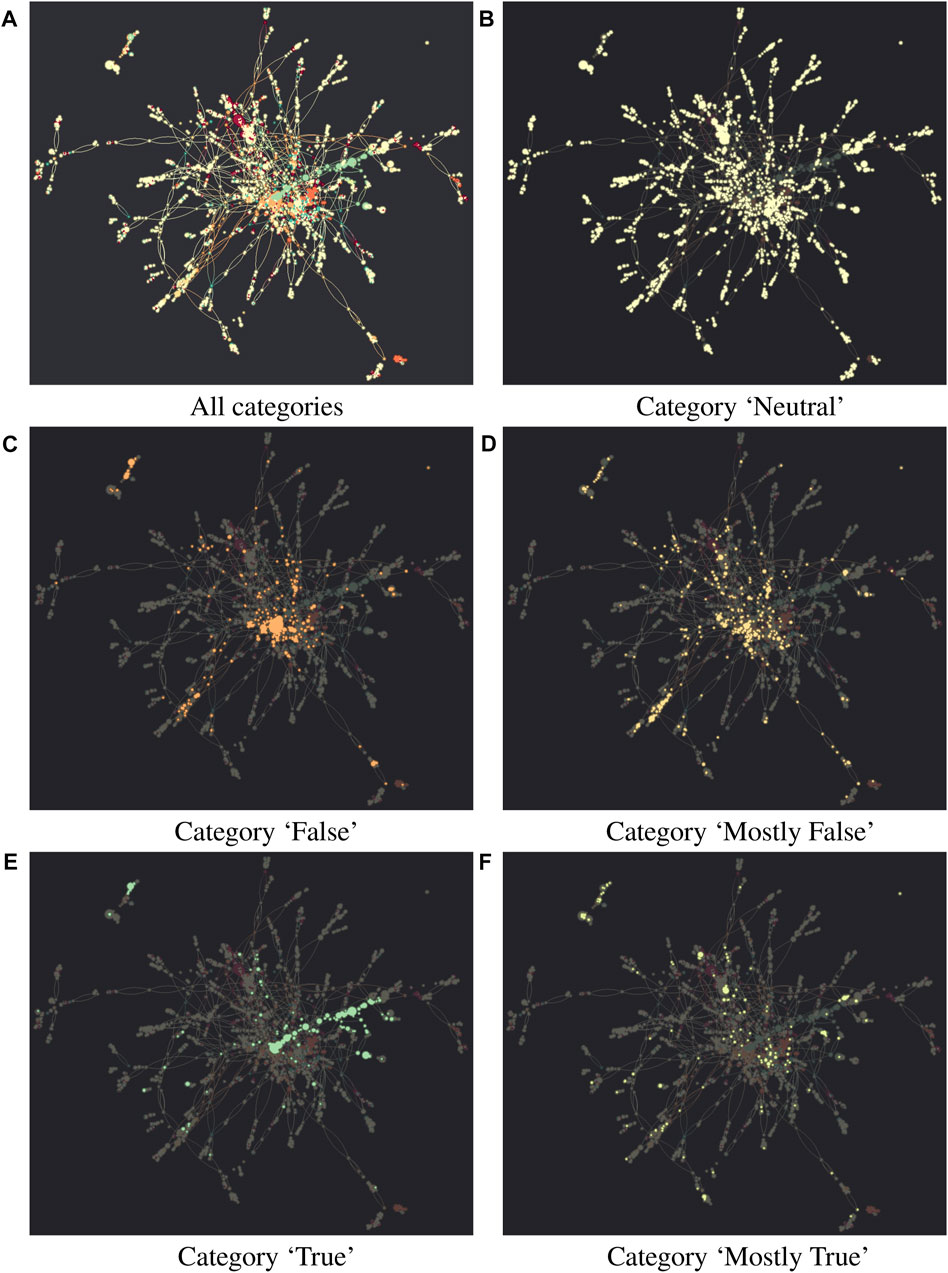
FIGURE 3. Full network (A) comprises websites whose relationships are based on audience overlap. Node size is proportional to node degree, while its color is determined by the attribute information associated with it, using a Spectral palette in Graphistry. In light yellow, there are websites in the “Neutral” category (B); in orange, there are websites in the “False” category (C); in light orange, there are websites in the “Mostly False” category (D); in dark sea green, there are websites in the “True” category (E); finally, in light green, there are websites in the “Mostly True” category (F). Included in the full network, in dark orange, there are websites in the “Download/Streaming/Betting and Adult content” category, while in red, there are websites in the “Scam/Negative reviewed/Crypto payment” category. Isolated (standalone) nodes are hidden in the figure.
Properties are assessed on the full network and each sub-network, at both the network (global) and node (local) level, using NetworkX, a Python package for the creation, manipulation, and exploration of complex networks. Global network properties include the number of nodes and links (both for individual and full networks), the number of connected components, degree, network density, and assortativity. Local network properties include node’s degree, average neighbor degree, and clustering coefficient. We selected these features to show that, even by analyzing simple properties, it is possible to distinguish websites, in particular news ones.
Table 2 reports summary statistics of the full network. As shown in Figure 3, the full network is not completely connected, consisting of three disjoint connected components, with sizes of 11,772, 376, and 9. The dominant connected component (giant component) of the network holds a large fraction of the total number of nodes (11,772) and links. The second large component (376 websites) is mostly Italian. It was generated by collecting audience overlap data from byoblu.com (Table 1), an Italian website known for posting misleading and conspiracy theory content.
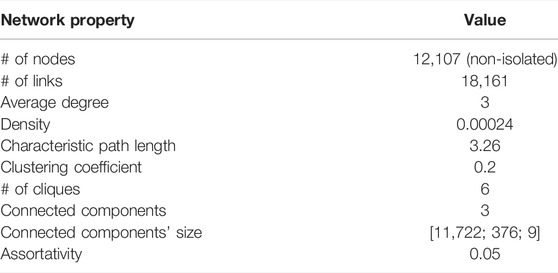
TABLE 2. Summary statistics of the full network. Network properties are assessed at a network (global) and node (local) level.
Assortativity and Clustering Coefficient
In order to determine homogeneity or heterogeneity of sub-networks, the assortativity measure is calculated for each sub-network created starting from each website in Table 1, after running the six-iteration process described in Section 2.1. The results in Table 3 show strong evidence for positive assortativity for websites within the category “Reliable,” except for www.ap.org; the assortative coefficient of the sub-networks of unreliable websites is negative overall, except for the values obtained from the sub-networks of clashdaily.com and conservativedailypost.com, respectively. The mean value
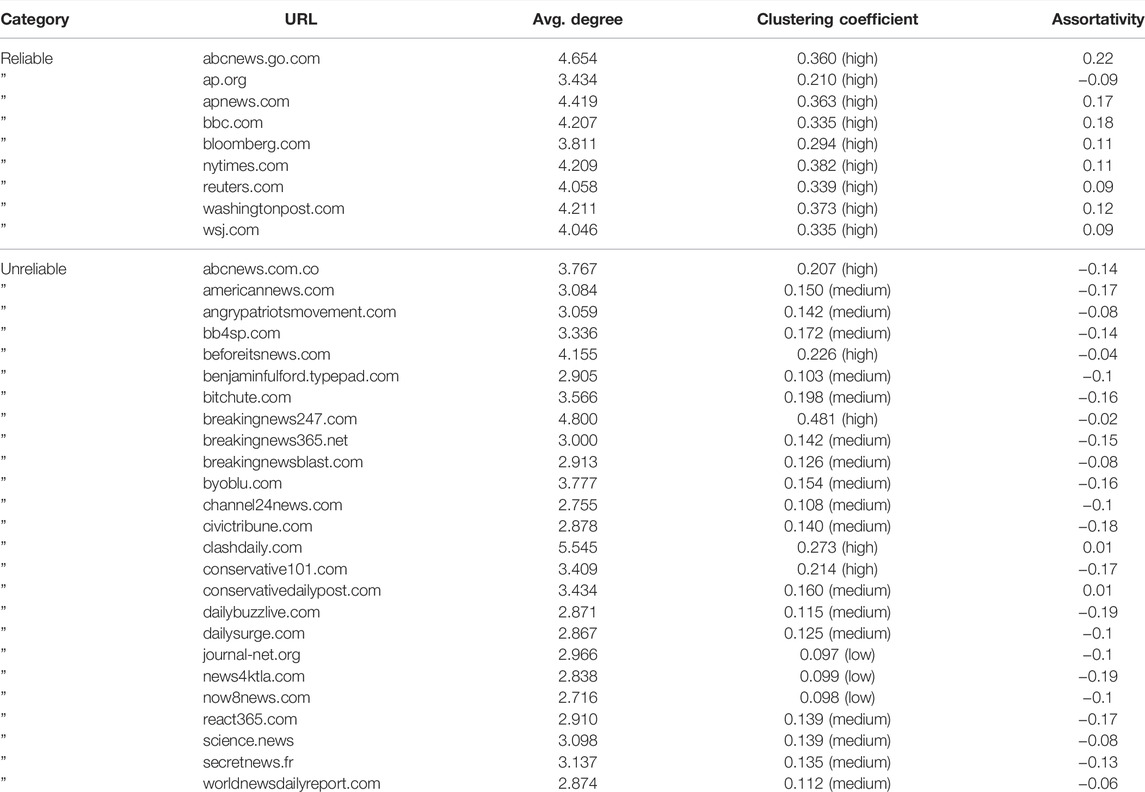
TABLE 3. Average degree, clustering coefficient, and assortativity of network datasets of reliable news sources versus unreliable news sources. Reliable news sources are generally positively assortative, with links between websites with similar characteristics, as opposed to unreliable ones. Sub-networks can also be classified by clustering coefficient. By investigating the unreliable websites, the clustering coefficient ranges from “low” (0) to “medium” (0.2) overall, while the clustering coefficient of reliable website sub-networks has higher values. This denotes that communities of websites sharing reliable news tend to be more clustered than unreliable ones.
Similarly, for the clustering coefficients,
An example of the sub-network structure of reliable and unreliable websites is shown in Figure 4.
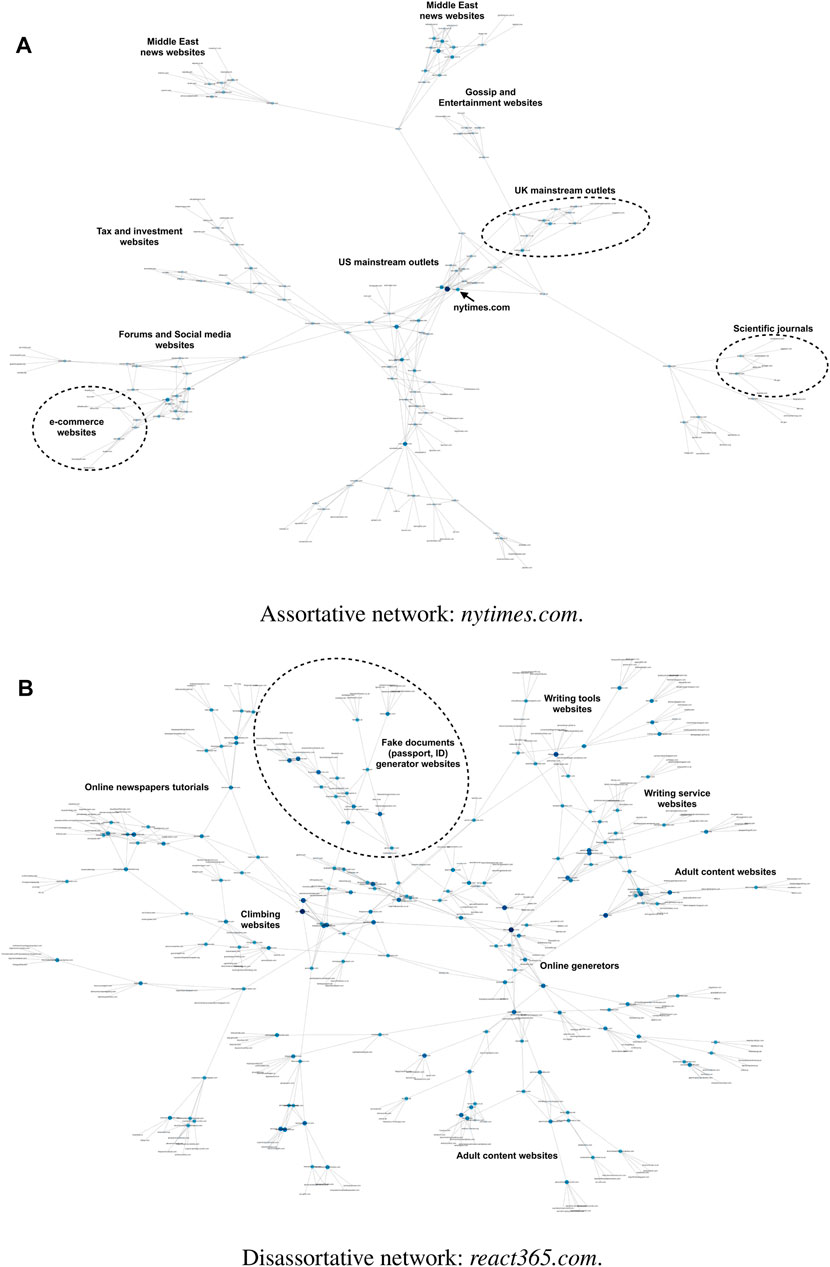
FIGURE 4. Example of assortative and disassortative real-world networks. The node’s size depends on the node’s degree. Also, the color depends on the degree using a sequential blue color map: the darker the node’s color, the higher the node’s degree. The sub-network in (A) is connected and there are no isolated nodes. The sub-network in (B) shows only the connected component (the standalone nodes are hidden). Most sub-networks, built from unreliable news sources, have isolated nodes, that is, websites for which there is no information on the overlap of the audience with other websites. These sub-networks exhibit disassortative behavior: this means that high degree nodes are less connected to each other.
In Table 3, each sub-network is characterized also within three different ranges of clustering coefficient [37]:
• Low: from 0 to 0.1;
• Medium: from 0.1 to 0.2;
• High: from 0.2 to 1.
Out of the websites in Table 1,
• Thirteen websites (approx. 38%) have a high clustering coefficient, that is, a clustering value between 0.2 and 1. Out of these 13 websites, 9 (approx. 69%) are under the “Reliable” category;
• Three websites (approx. 9%) show a low clustering coefficient (value between 0 and 0.1);
• The remaining websites (approx. 53%), all in the “Unreliable” category, have a medium clustering coefficient, with a value between 0.1 and 0.2.
The results listed in Table 3 above denote that communities of reliable news websites tend to be more clustered, whereas the sub-networks of unreliable news websites have a higher fragmentation (Figure 4).
k-Core Decomposition
To identify particular subsets of the full network (k-cores) [38], we filtered the nodes according to their label, mostly focusing on those that fell into the “Reliable” and “Unreliable” categories and on their nearest neighbors, regardless of the label of the latter. The k-core is then obtained by decomposing the network via recursive removal of least connected nodes (Figure 5), namely, those with a degree smaller than k, until the degree of all remaining nodes is larger than or equal to k [39]. Figure 6A shows the nested structure of a network of k-cores, consisting of a series of concentric “shells” from the outermost (periphery) at ks = 1—which includes all the network—to the innermost—which corresponds to the maximum k-core, at
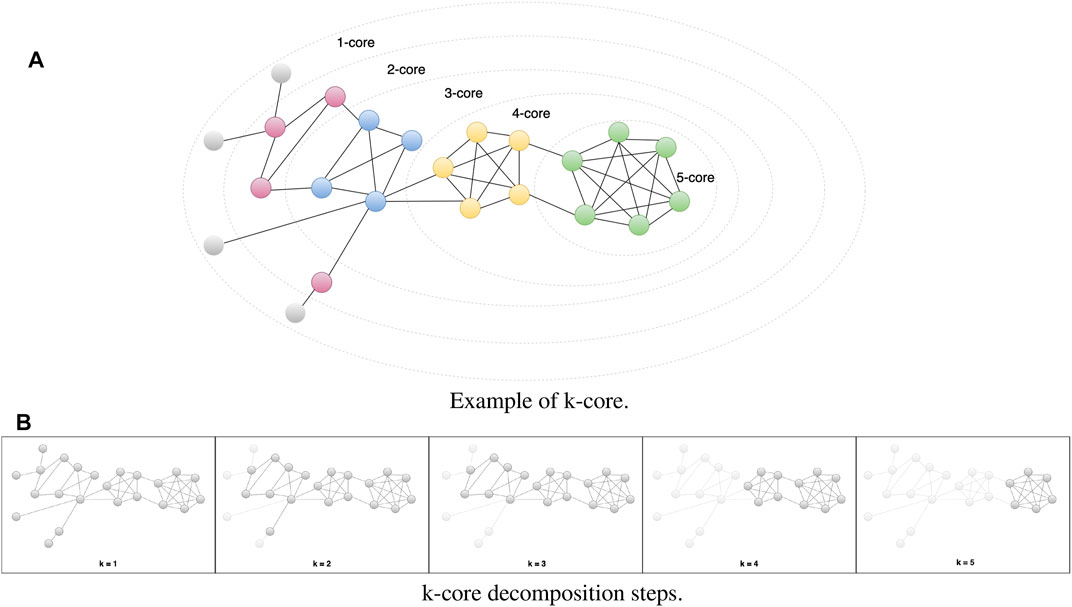
FIGURE 5. An example of the structure of k-cores in a network. The nodes are arranged in a series of concentric cores (A), each corresponding to a particular k-core. The color of the nodes corresponds to their coreness value k: k = 1 as grey; k = 2 as purple; k = 3 as blue; k = 4 as yellow; k = 5 as green. The panel in (B) shows an example of k-core decomposition via recursive removal of nodes to get the main cores.
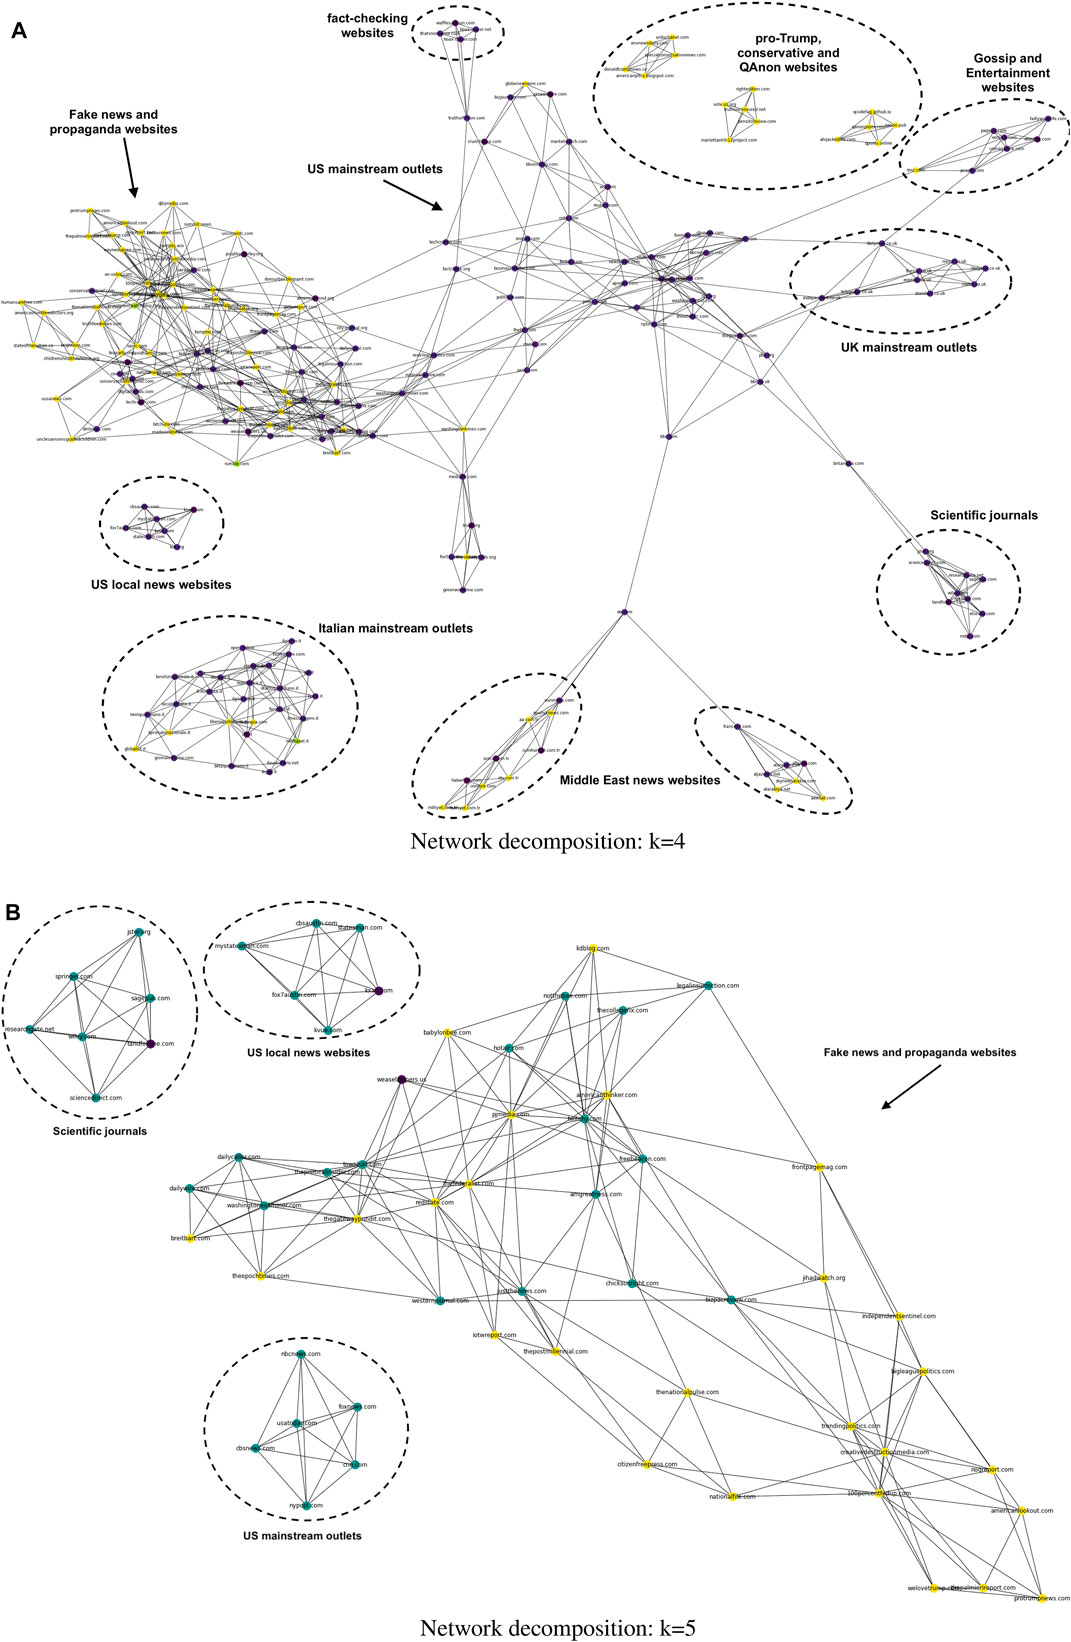
FIGURE 6. k-cores of the graph with reliable and unreliable news websites and their nearest neighbors. The remaining figures show the 4-core (A) and 5-core (B) in the filtered network. The colors in (A) and (B) refer to the labels assigned to each website: sea green nodes represent reliable websites (“True” or “Mostly True”); yellow nodes represent unreliable websites (“False” or “Mostly False”); and purple nodes are websites labeled as “Neutral.” Our results highlight the importance of core nodes for detecting disinformation spreaders. An example is provided in the 4-core network (A), where the small sub-network of Pro-Trump and conservative sites includes websites (e.g., urduchanel.com and donaldtrumpnews.co) linked to fake news and hyper-partisan content [41] .
When we applied the k-core algorithm [41], we were able to identify several cores at different k values that hold across several overlapping communities. The denser core, made up of nodes with the highest coreness, is at k = 5 (Figure 6B). The 5-core has a size of 62 websites across four substructures and reveals a big community of fake news, conspiracy, and propaganda websites. It also highlights the role of fact-checking websites as bridges between the groups of reliable and unreliable websites.
The unreliable websites tend to populate the inner k-shells, whereas reliable websites generally concentrate more on the outer k-shells. This result hints that unreliable websites could be more dependent on the survival of many reliable websites than vice versa.
3.2 Political Bias: Reliable Versus Unreliable News Sources
We assigned a political bias label only to the 1,240 distinct news sources [18, 43] identified in our dataset within reliable (“True” or “Mostly True”) or unreliable (“False” or “Mostly False”) categories. We derived the labels using the classification provided by MediaBias/FactCheck (MBFC) [43], an independent online media outlet that provides information on news sources’ media bias and content reliability rating the sources using the U.S. political spectrum: Extreme Left, Left, Left-centre, Least biased, Right-centre, Right, Far Right, and Extreme Right. Along this Left-Right scale (Figure 7), other labels were also assigned to our data (Table 4), according to the MBFC scale: Conspiracy-Pseudoscience, Satire, Fake News, Source pending review (i.e., websites under review in MBFC at the time of the analysis, performed in January 2022), and Not Available (i.e., websites with no information available).
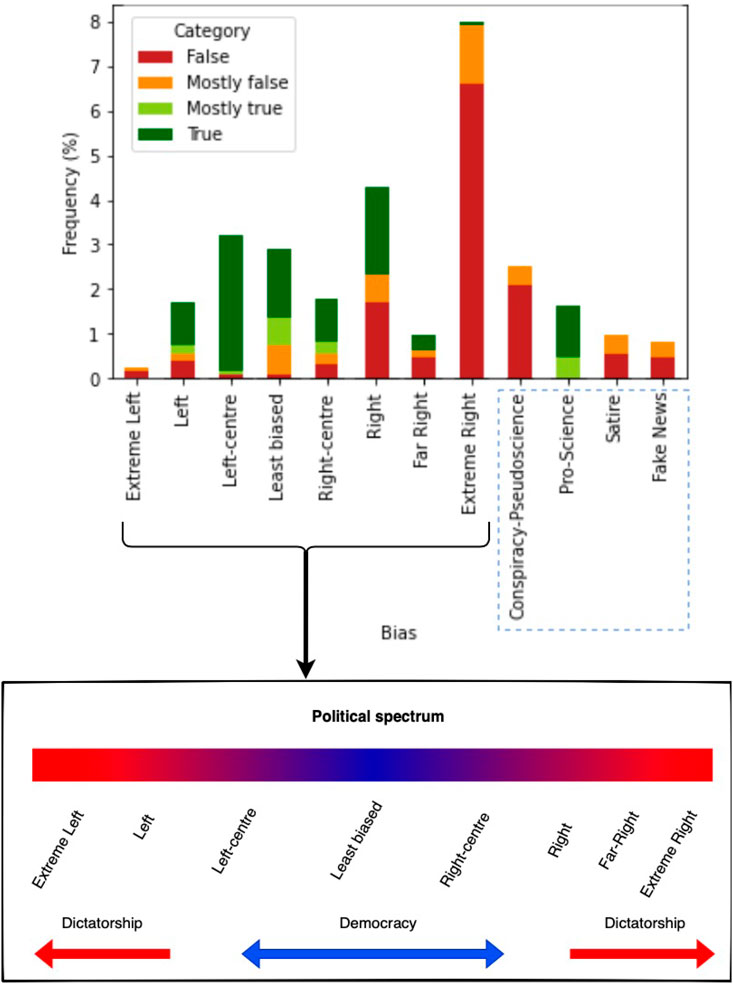
FIGURE 7. Political spectrum in news sources in the dataset. The x-axis displays the political leaning within one of the following categories (political spectrum): Extreme Left, Left, Left-centre, Least biased, Right-centre, Right, Far Right, and Extreme Right. According to the information provided by MediaBias/FactCheck website, the following four extra categories are also identified and displayed: Conspiracy-Pseudoscience, Pro-Science, Satire, and Source Pending Review. The y-axis reports the frequency as the percentage of the number of news sources in the different groups. Conservative and extremely conservative news sources are mostly identified as unreliable (“False” and “Mostly False”) than other sources.

TABLE 4. Relative frequency of news sources within right-left political spectrum by reliable (“True”/“Mostly true”) and unreliable (“False”/“Mostly false”) categories. Some news sources are listed by Media Bias/Fact Check (MBFC) as either Pro-Science, Conspiracy-Pseudoscience, Satire, or Fake News. The percentage denotes the proportion of the corresponding categories’ news sources on that bias. The review of 58% of news sources has not been completed by MBFC at the time of the analysis and c. 13% of news sources (mostly having .it, .net, .co.uk, .fr, .co, .mx, or .news as top-level domain) has not matched any result in MBFC database.
Based on labels provided by MBFC, we see in Figure 7 that the number of unreliable (“False” or “Mostly False”) news sources (circa 8%) which fall on the right-wing extremism is larger than the number of left extremist news sources. Regardless of the percentages, their results make sense and align well with the intuition that disinformation is politically charged and that extreme political views can produce biased information. News sources that overall exhibit a left or least bias tend to be more trustworthy than those extremely biased or have a moderate-to-strong right bias [45].
A Pearson chi-square test of independence was carried out to determine whether there is a relationship between the categorical variable of political-leaning (Bias) and the reliability of news sources. The following hypotheses were stated to examine it:
• H0: there is no relationship between political leaning and the reliability of news sources;
• H1: there is a relationship between political leaning and the reliability of news sources.
We set the alpha level (α) at 0.05. The result indicates a p-value equal to 2.013e−42: this means that there is a strong positive and significant correlation between the two variables compared to the null hypothesis.
3.3 Domain Registration/Expiration Date
After gathering information about the domain registration and expiration dates of all the websites in our dataset, we looked at the age distribution of the domains. Particularly, we focused on the age distribution of the classes of interest for this study, that is, reliable and unreliable websites. Information on registration and expiration dates was gathered from Wayback Machine and WHOIS, two large information databases on domain registration and availability. Figure 8 shows the box plots of domain registration dates for all the websites within unreliable and reliable categories. Box plots are informative charts on the distribution of data which include the following statistics:
• Minimum: it is shown at the far bottom of the chart, at the end of the lower whisker;
• First quartile (25th percentile): it is the bottom of the box;
• Median: it is shown as a line that divides the box into two parts;
• Mean: it is indicated by a triangle in the box;
• Third quartile (75th percentile): it is shown at the top of the box;
• Maximum: it is shown at the top of the box, at the bottom of the upper whisker;
• Outliers: if any, they are indicated by small circles outsides the box.
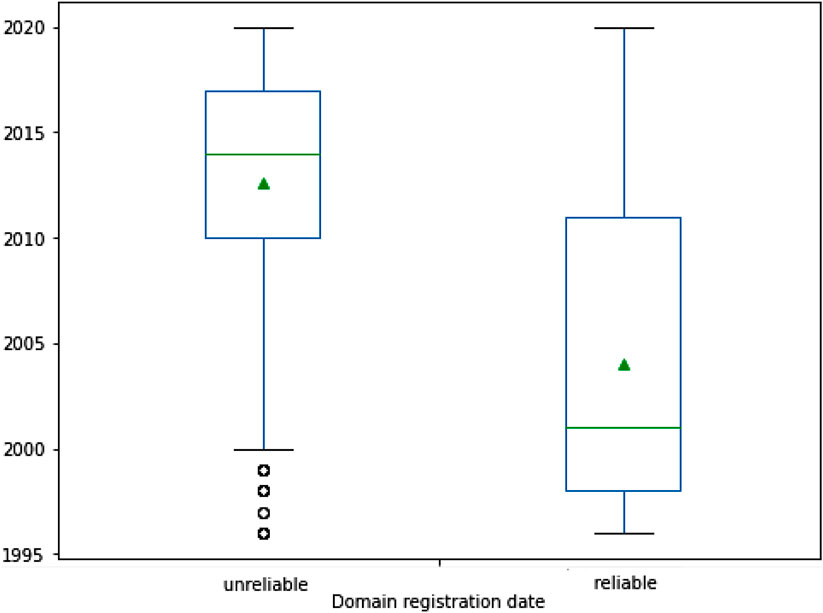
FIGURE 8. Box plots denoting the distribution of domain registration dates to unreliable and reliable news sources. Box plot shows five statistics: the minimum value (at the end of the lower whisker), the first quartile (the bottom of the box), the median (the line in the box), the third quartile (at the top of the box), and the maximum value (at the end of the upper whisker). The mean value is indicated by a small triangle in the box. Data distribution is skewed to the left in the unreliable data, where the mean is less than the median. Unreliable news sources generally have more recent registration dates than reliable ones that instead developed their reputation over the years. Outliers are present in the unreliable dataset: they are indicated by small circles outside the box.
The domain registration date distribution of the unreliable set of data (box plot on the left in Figure 8) exhibits a clear negative skewness versus the distribution of domain registration dates of the reliable data, which instead exhibits a positive skewness of the distribution. This aligns with the intuition that fake news or misleading content is published or shared more likely by newer websites [46]. Although disinformation is not a recent problem, certainly the new technological tools and their easy accessibility have led, in recent years, to the amplification of this problem, making it more challenging.
Domains registered for a short period are often favored by bad actors to spread disinformation (Figure 9). Websites used for illegal or malicious purposes (including phishing, malware, and scam) are generally registered for a shorter registration/renewal period than websites created for legitimate purposes, or they are no longer available because they were archived or suspended for violation of terms of services. This can be explained as once identified as malicious and reported, these websites are seized or shut down. An example is provided by piracy websites, for example, torrent and streaming websites, or direct download platforms (Figure 9B). Many piracy websites go offline after a while, or they are shut down due to copyright violations and illegal file-sharing: therefore, owners of such domains usually do not register a domain for longer than a couple of years.
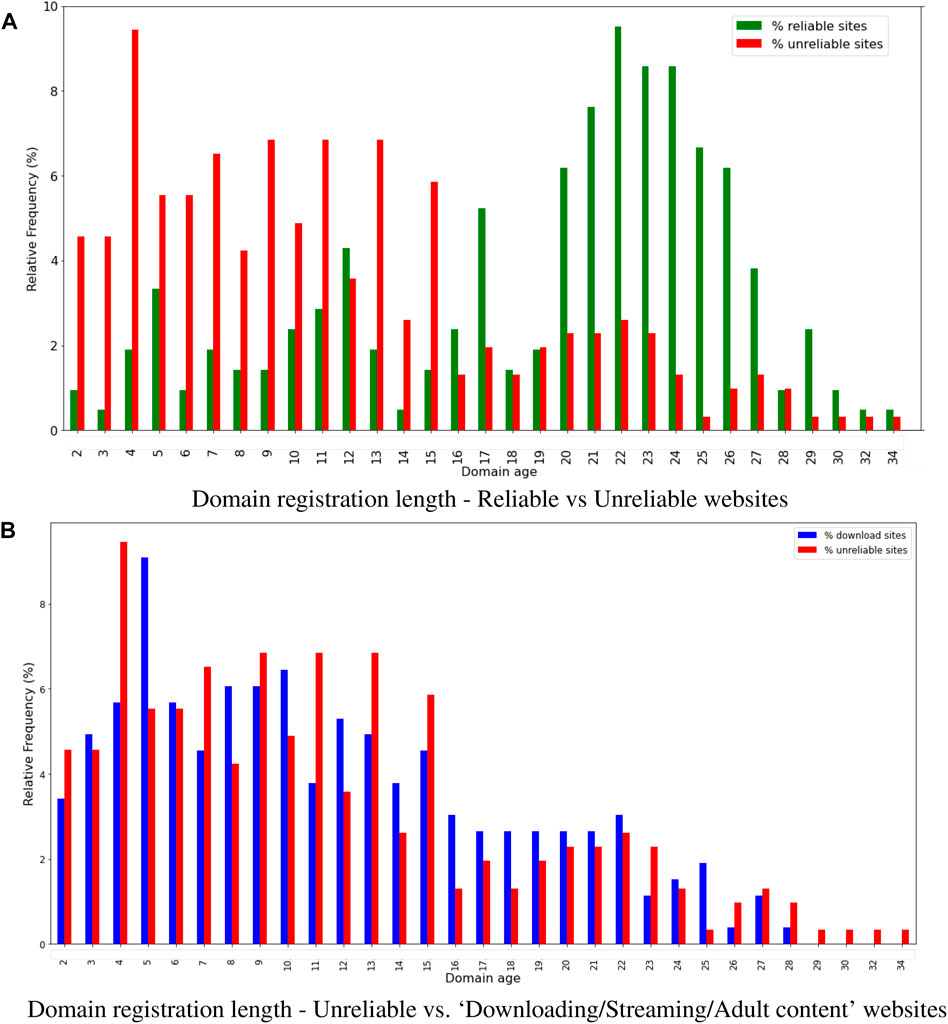
FIGURE 9. Domain registration length (registration/renewal period). The plot (A) displays the domain registration length, meant as the number of years the domain renewal cost is paid in advance, calculated in the reliable and unreliable datasets. Webmaster says Search Engine gives more preference to the domains registered for a long time because domains that are bought for the spamming Web are generally registered for not more than a year. Newly registered domains are often favored by bad actors for malicious purposes (including phishing, malware installation, scam, or fake news spread) and are generally registered for not more than 5 years. An example is provided by illegal piracy websites (B) such as torrent or streaming websites or also direct download platforms. Many websites go offline after a while or are shut down due to copyright violations and illegal file-sharing; therefore, owners of such domains usually do not register a domain for longer than a couple of years.
4 Discussion
Fake news has always existed. The Trojan horse, used by the Ancient Greeks during the Trojan War, is probably one of the first and most well-known examples of deception. In the last century, specifically through the years of Nazism and Fascism, censorship and propaganda were largely used for political purposes, aiding the one-party (e.g., Fascism party, National Socialist parties) in establishing their systems, supporting and promoting their ideology [47], and playing upon people’s fears and anxiety as well as upon their emotions and prejudices [48–50].
Undoubtedly, what has changed throughout the centuries is the way and the speed with which information is produced, disseminated, and consumed [51, 52]. The Web and new technologies and social platforms have made the world interconnected and helped information spread across the world. Accordingly, the Web represents an ideal place to “hide” disinformation in order to influence public opinion, damage reputation by disseminating lies, promote propaganda, and interfere in political elections [53]. Therefore, it is crucial to timely identify “bad actors”, that is, sources (humans or bots), which spread false content in order to fight online disinformation.
This study aimed to investigate the relationships between websites spreading deceptive content across the Web, trying to characterize them by comparing these websites with those deemed reliable. Therefore, we used a multidisciplinary approach to more easily detect and analyze the communities of unreliable websites, if any. Specifically, we extracted AO data, using SEO tools, and WHOIS information. Although this type of information has been extensively researched separately (SEO data mainly in marketing strategies, WHOIS data mainly for CyberSecurity activities), this study represents the first attempt to combine and explore it within the context of disinformation. The results seem to be promising: in fact, from an initial list of 34 websites, 25 of which were deemed unreliable, using the AO information of each website, we could identify approximately 880 websites that publish and/or share misinformation and are linked to those initially selected, directly or through other websites.
In order to investigate the relationships between websites, we used the Complex Networks theory, focusing not only on the full network but also on the sub-networks (built starting from the initial list of websites we selected) that created it. Although the sub-networks analysis is unusual, it made sense in this context. In fact, by definition, we have built the sub-networks starting from a website, reliable or unreliable, and this allowed us to obtain information about each sub-network and its structure.
As illustrated in Section 3, from a network perspective, the analysis and comparison of these sub-networks have highlighted important properties as being able to characterize—therefore distinguish—the websites considered reliable from those considered unreliable. In particular, the assortativity measure, generally analyzed in social networks [54], has shown the presence of a strong tendency for reliable news websites to be connected to each other [55].
One possible explanation for this result may be as follows: the sub-networks of reliable websites tend to be assortative because their audience often prefer to visit websites that are, or have links to, other websites that are similar to them. Moreover, sub-network clustering coefficient values for reliable news websites suggest that there are tightly connected communities in which most of the website’s competitors are themselves competitors (Figure 4A). Therefore, most audience concentrates only on a few websites, mostly the same, as also revealed by the sub-networks’ growths illustrated in Figure 10. As shown in Figure 10, it appears that both population sizes slowly grow up to the fourth iteration; then, the population associated with the unreliable websites jumps up at the fifth iteration, continuing to grow faster than that one of the reliable websites. However, a few exceptions were also identified, especially when some unreliable websites did not have many competitors due to the low volume of traffic and/or poor visibility.
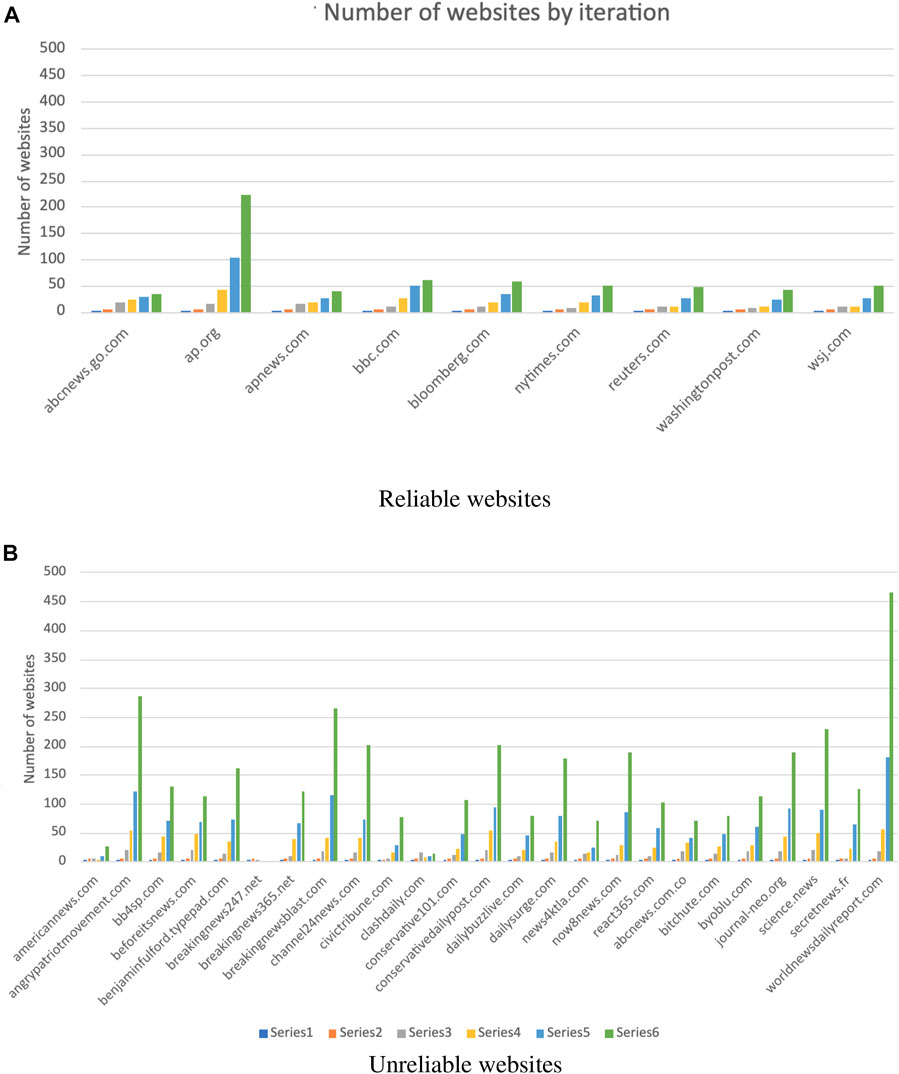
FIGURE 10. Sub-networks growth by iteration. The charts show the number of websites (y-axis) collected at each iteration (series) using the AO tool. The comparison of unreliable sub-networks and reliable sub-networks growth rates showed that the growth rate of the reliable sub-networks is lower than that of the unreliable sub-network through the iterations (A) Reliable websites. (B) Unreliable websites.
The fast growth of the number of nodes within the sub-networks of unreliable websites can also be explained by looking at the example provided in Figure 10, where the sub-network built from the website react365.com exhibits a high fragmentation. This is very common in sub-networks built starting from unreliable websites, as also highlighted by their disassortative tendency, with highly connected nodes linked with poorly connected nodes. This tendency might be explained by considering the strategies adopted by fake and unreliable websites to spread disinformation, also looking at their audience’s behavior. It may happen in fact that mirror websites or sub-domains are created (“divide et impera” strategy; it is also employed to disrupt unity and cohesion in public opinion) to avoid detection tools and continue to spread content online to seek a wider and more loyal audience, then a greater possibility for disinformation. A well-known example of this is news-front.info (https://securingdemocracy.gmfus.org/russias-affront-on-the-news-how-newsfronts-persistence-past-social-media-bans-demonstrates-the-need-for-vigilance/).
Figure 4 illustrates an interesting result about audience Web searching behavior when we analyze the two types of sub-networks. It is possible to note that the audience of unreliable websites also consults fraudulent websites (e.g., generators of false documents/ID). This result might reveal possible underlying suspicious activities associated with online users from unreliable websites [56].
We also considered the k-core decomposition of the full network by filtering websites within unreliable or reliable categories. Such decomposition allowed us to uncover the structural network’s properties, determining the most stable interactions among websites through the network’s shells of increasing centrality. Information on the structure of maximal sub-networks, meant as communities of nodes with minimum degree k, has indeed indicated the presence of groups of websites showing the property of being more connected because of the increasing centrality. Among these, we found the following:
• At k = 4: QAnon, Pro-Trump, conspiracy, and propaganda websites alongside more trustworthy sources;
• At k = 5 (maximal sub-network): fake news, conspiracy, and propaganda websites alongside more trustworthy sources.
The k-core decomposition appears, then, as a very interesting and useful additional tool for the analysis of complex networks, not only in areas such as social sciences [57], biology [58, 59], and ecology [60] but also in the context of disinformation detection.
By analyzing the domain registration length, meant as the time period between the registration and the expiration dates, of websites included within the “Reliable” or “Unreliable” category, we found that websites used for malicious purposes are generally registered for a shorter period compared to websites created for legitimate purposes (Figure 9A). In terms of SEO strategies, bad actors may also be more interested in buying expired domain names or use mirror websites [61] to disseminate false information.
The ease with which websites can be created and managed without big expense or effort has therefore contributed to the problem of online disinformation. Furthermore, similar to what happens with piracy websites [62] and with Dark Web marketplaces [63], one might expect that closing a fake news website would make a minimal and short-lived difference in the amount of fake content consumption, as this would lead users to migrate to other websites.
The political bias of news sources also plays a key role in disinformation’s spread, as shown in Figure 7. Our findings align with results got from other research works [45, 64, 65], confirming that fake news and misleading content are published and/or shared more likely by people on the extreme right-wing than people on the left-wing. This can be explained by the fact that conservatives generally have higher vulnerability to political misperceptions and lower trust in media than liberals [66–68].
5 Conclusion
Infodemic has become a critical issue for modern society due to new technologies and social platforms that have made it easier to generate and disseminate information across the Web by internal and/or foreign actors that can create new fake accounts or websites or change the existing ones. Timely identification of the bad actors that spread false content has become a crucial element in fighting online disinformation in the early stages.
This research work can be seen as a first step toward the identification of disinformation spreaders through a multidisciplinary approach that combines the use of audience overlap, a well-known metric in marketing strategies for Search Engine Optimization, and the use of Complex Networks to visualize and analyze the relationships among websites via browsing behavior of online users to discover hidden relationships between websites.
The interplay between users’ browsing behavior—which represents a digital fingerprint—and disinformation mechanisms is a still unexplored research direction that may shed light on the website communities, which form and emerge while users navigate the Web, by analyzing SEO features and WHOIS data.
In this study, site sub-networks were built using a growth network model, in which the competitors of the analyzed websites were linked together, where there was an audience overlap. Different from previous research works that were more focused on the analysis of the full network, in this study, much attention has been paid to each sub-network built from a news source, looking at possible differences between the structures of sub-networks built from reliable news sources and those built from unreliable news sources. In summary, we have found the following:
• Sub-networks’ properties such as assortativity and clustering coefficient can characterize news sources, as the sub-networks built from unreliable websites are generally highly fragmented and with a disassortative tendency. Also, the use of the k-core decomposition has highlighted groups of websites that, overall, spread misleading content, capturing how well they are linked to each other. In particular,
- reliable news sources are positively assortative, having links between websites with similar characteristics; this is opposed to unreliable ones, which present highly connected nodes linked with poorly connected ones;
- communities of websites sharing reliable news tend to be more clustered than unreliable ones;
• In terms of WHOIS data, how the public domain registers can contain helpful information has also been shown, which could be used to detect the websites involved in the spread of disinformation. Specifically,
- it has been found that domains associated with unreliable news sources are generally registered for a short stretch of time or might be bought via domain flipping;
• The political leanings of the news sources analyzed in this study have shown that right-wing or extremist websites play a major role in spreading disinformation. In fact,
- the number of unreliable news sources that fall on the right-wing extremism is larger than the number of left extremism news sources;
- conservative and extremely conservative news sources are mostly identified as more unreliable than other sources.
We also acknowledge the limitations that might exist in the current study. The approach described in this study might be related to the size of the sample of analyzed websites, which might be small if compared to the multitude of websites that spread misleading content every day and have not been discovered yet. However, the iterative data collection mechanism may allow researchers interested in investigating fake news websites to reach them by extending the number of degrees of separation from the target website. Other limitations might be as follows:
• Websites that spread misleading content might not have AO information, as they might be low-traffic and/or short-lived. This might reduce the number of websites to be collected;
• The overlap score might be updated on a weekly or monthly basis, so steady monitoring would be required. One might expect that data may change over time. In fact, similar to the case of posts on Social Networks, which can be reviewed, or followers/following/friendship relationships, which can be removed/added, also the case of websites’ relationships based on SEO metrics may change over time as websites can be closed down and domains can be sold for other purposes, and new competitors could enter the list;
• Bias might occur using external tools (e.g., for audience overlap, media bias and fact-check, and WHOIS data).
Finally, future research might include studying how both site networks and relationships among websites evolve over time, analyzing the spread of information across the Web (via Web Search Engines) and/or on social media (e.g., Twitter and Facebook).
Data Availability Statement
The datasets presented in this study are available upon request in the following online repository: https://github.com/valesdn/news_sources_analysis_complex_networks.
Author Contributions
VM collected and analyzed the data. AR supervised the study. Both the authors reviewed the article.
Funding
The authors acknowledge the financial support of the project PRIN 2017WZFTZP “Stochastic Forecasting in Complex Systems” and also the project MOSCOVID of Catania University.
Conflict of Interest
The authors declare that the research was conducted in the absence of any commercial or financial relationships that could be construed as a potential conflict of interest.
Publisher’s Note
All claims expressed in this article are solely those of the authors and do not necessarily represent those of their affiliated organizations or those of the publisher, the editors, and the reviewers. Any product that may be evaluated in this article, or claim that may be made by its manufacturer, is not guaranteed or endorsed by the publisher.
References
1. Westerman D, Spence PR, Van Der Heide B. Social media as Information Source: Recency of Updates and Credibility of Information. J Comput-mediat Comm (2014) 19:171–83. doi:10.1111/jcc4.12041
2.Justicegov. Justicegov (2020). Available from: www.justice.gov (Accessed January 22, 2022).
3. Rodrigues UM, Xu J. Regulation of Covid-19 Fake News Infodemic in china and india. Media Int Aust (2020) 177:125–31. doi:10.1177/1329878X20948202
4.Wix. Wix (2006). Available from: https://www.wix.com (Accessed February 21, 2022).
5.GoDaddy. GoDaddy (1997). Available from: https://www.godaddy.com (Accessed February 21, 2022).
6.Wordpress. Wordpress (2003). Available from: https://www.wordpress.com (Accessed February 21, 2022).
7.Sitelike. Sitelike (2021). Available from: https://www.sitelike.org (Accessed August 20, 2021).
8. Albert R, Jeong H, Barabási A-L. Diameter of the World-wide Web. Nature (1999) 401:130–1. doi:10.1038/43601
9.Barabási A.-L, Albert R. Emergence of Scaling in Random Networks. Science (1999) 286:509-12. 10.1126/science.286.5439.509
10. Newman M, Barabási AL, Watts DJ. The Structure and Dynamics of Networks. Princeton, NJ, USA: Princeton University Press (2006).
11. Adamic LA, Huberman BA, Barabasi AL, Albert R, Jeong H, Bianconi G. Power-law Distribution of the World Wide Web. Science (2000) 287:2115. doi:10.1126/science.287.5461.2115a
12. Broder A, Kumar R, Maghoul F, Raghavan P, Rajagopalan S, Stata R, et al. Graph Structure in the Web. Computer Networks (2000) 33:309–20. doi:10.1016/s1389-1286(00)00083-9
13. Fujita Y, Kichikawa Y, Fujiwara Y, Souma W, Iyetomi H. Local bow-tie Structure of the Web. Appl Netw Sci (2019) 4. doi:10.1007/s41109-019-0127-2
14. Ruffo G, Semeraro A, Giachanou A, Rosso P. Surveying the Research on Fake News in Social media: A Tale of Networks and Language (2021).
15. Del Vicario M, Bessi A, Zollo F, Petroni F, Scala A, Caldarelli G, et al. The Spreading of Misinformation Online. Proc Natl Acad Sci U.S.A (2016) 113:554–9. doi:10.1073/pnas.1517441113
16. Stella M, Ferrara E, De Domenico M. Bots Increase Exposure to Negative and Inflammatory Content in Online Social Systems. Proc Natl Acad Sci U.S.A (2018) 115:12435–40. doi:10.1073/pnas.1803470115
17. Shao C, Ciampaglia GL, Varol O, Yang K-C, Flammini A, Menczer F. The Spread of Low-Credibility Content by Social Bots. Nat Commun (2018) 9. doi:10.1038/s41467-018-06930-7
18. Cinelli M, Quattrociocchi W, Galeazzi A, Valensise CM, Brugnoli E, Schmidt AL, et al. The Covid-19 Social media Infodemic. Sci Rep (2020) 10:16598. doi:10.1038/s41598-020-73510-5
19. Gallotti R, Valle F, Castaldo N, Sacco P, De Domenico M. Assessing the Risks of 'infodemics' in Response to COVID-19 Epidemics. Nat Hum Behav (2020) 4:1285–93. doi:10.1038/s41562-020-00994-6
20. Pierri F, Piccardi C, Ceri S. Topology Comparison of Twitter Diffusion Networks Effectively Reveals Misleading Information. Sci Rep (2020) 10. doi:10.1038/s41598-020-58166-5
21. Caldarelli G, De Nicola R, Petrocchi M, Pratelli M, Saracco F. Flow of Online Misinformation during the Peak of the Covid-19 Pandemic in italy. EPJ Data Sci (2021) 10. doi:10.1140/epjds/s13688-021-00289-4
22. Burgess M, Adar E, Cafarella M. Link-Prediction Enhanced Consensus Clustering for Complex Networks. PLOS ONE (2016) 11:e0153384–23. doi:10.1371/journal.pone.0153384
24. Bianconi G, Darst RK, Iacovacci J, Fortunato S. Triadic Closure as a Basic Generating Mechanism of Communities in Complex Networks. Phys Rev E (2014) 90:042806. doi:10.1103/PhysRevE.90.042806
25.Alexa. Alexa (1996). Available from: https://www.alexa.com/ (Accessed February 21, 2022).
26.Similarweb. Similarweb (2007). Available from: https://www.similarweb.com (Accessed February 21, 2022).
27.PolitiFact. PolitiFact (2007). Available from: https://www.politifact.com (Accessed February 21, 2022).
28.Poynter. Poynter (1975). Available from: https://www.poynter.org (Accessed February 21, 2022).
29.CBSNews. CBSNews (1927). Available from: https://www.cbsnews.com (Accessed February 21, 2022).
31. Travers J, Milgram S. An Experimental Study of the Small World Problem. Sociometry (1969) 32:425–43. doi:10.2307/2786545
32. Barabási A-L. Network Science. Phil Trans R Soc A (2013) 371:20120375. doi:10.1098/rsta.2012.0375
33. Daraghmi EY, Yuan S-M. We Are So Close, Less Than 4 Degrees Separating You and Me! Comput Hum Behav (2014) 30:273–85. doi:10.1016/j.chb.2013.09.014
34.Facebook. Three and a Half Degrees of Separation (2016). Available from: https://research.fb.com (Accessed August 20, 2021).
35.ScamAdvisercom. ScamAdvisercom (2012). Available from: https://www.scamadviser.com (Accessed February 21, 2022).
36. Samarasinghe N, Mannan M. On Cloaking Behaviors of Malicious Websites. Comput Security (2021) 101:102114. doi:10.1016/j.cose.2020.102114
37. Montes F, Jaramillo AM, Meisel JD, Diaz-Guilera A, Valdivia JA, Sarmiento OL, et al. Benchmarking Seeding Strategies for Spreading Processes in Social Networks: an Interplay between Influencers, Topologies and Sizes. Sci Rep (2020) 10:3666. doi:10.1038/s41598-020-60239-4
38. Montresor A, De Pellegrini F, Miorandi D. Distributed K-Core Decomposition. IEEE Trans Parallel Distrib Syst (2013) 24:288–300. doi:10.1109/TPDS.2012.124
39. Alvarez-Hamelin J, Dall’Asta L, Barrat A, Vespignani A. K-core Decomposition: A Tool for the Visualization of Large Scale Networks. Adv Neural Inf Process Syst (2005) 18.
40. Malvestio I, Cardillo A, Masuda N. Interplay between $$k$$-Core and Community Structure in Complex Networks. Sci Rep (2020) 10. doi:10.1038/s41598-020-71426-8
41. Batagelj V, Zaveršnik M. An O(m) Algorithm for Cores Decomposition of Networks. CoRR cs.DS/0310049 (2003).
42.Mediamattersorg. Mediamattersorg (2018). Available from: https://www.mediamatters.org (Accessed January 22, 2022).
43. Pennycook G, Rand DG. Fighting Misinformation on Social media Using Crowdsourced Judgments of News Source Quality. Proc Natl Acad Sci U.S.A (2019) 116:2521–6. doi:10.1073/pnas.1806781116
44.Mediabiasfactcheckcom. MediaBias/FactCheck (2015). Available from: https://mediabiasfactcheck.com (Accessed February 20, 2022).
45. Bovet A, Makse HA. Influence of Fake News in Twitter during the 2016 Us Presidential Election. Nat Commun (2019) 10. doi:10.1038/s41467-018-07761-2
46. Mazzeo V, Rapisarda A, Giuffrida G. Detection of Fake News on Covid-19 on Web Search Engines. Front Phys (2021) 9:685730. doi:10.3389/fphy.2021.685730
47. Yourman J. Propaganda Techniques within Nazi germany. J Educ Sociol (1939) 13. doi:10.2307/2262307
48. Martel C, Pennycook G, Rand DG. Reliance on Emotion Promotes Belief in Fake News. Cogn Res (2020) 5:47. doi:10.1186/s41235-020-00252-3
49. Salvi C, Iannello P, Cancer A, McClay M, Dunsmoor J, Antonietti A. Going Viral: How Fear, Socio-Cognitive Polarization and Problem-Solving Influence Fake News Detection and Proliferation during Covid-19 Pandemic. Front Commun (2021) 5. doi:10.3389/fcomm.2020.562588
50. Ecker UKH, Lewandowsky S, Cook J, Schmid P, Fazio LK, Brashier N, et al. The Psychological Drivers of Misinformation Belief and its Resistance to Correction. Nat Rev Psychol (2022) 1:13–29. doi:10.1038/s44159-021-00006-y
51. Vosoughi S, Roy D, Aral S. The Spread of True and False News Online. Science (2018) 359:1146–51. doi:10.1126/science.aap9559
52. Talwar S, Dhir A, Singh D, Virk GS, Salo J. Sharing of Fake News on Social media: Application of the Honeycomb Framework and the Third-Person Effect Hypothesis. J Retailing Consumer Serv (2020) 57:102197. doi:10.1016/j.jretconser.2020.102197
53.Justicegov. United states Seizes Domain Names Used by iran’s Islamic Revolutionary Guard Corps (2020). figshare. Available from: www.justice.gov (Accessed February 20, 2022).
54. Mulders D, de Bodt C, Bjelland J, Pentland AS, Verleysen M, de Montjoye YA. Improving Individual Predictions Using Social Networks Assortativity. In: 2017 12th International Workshop on Self-Organizing Maps and Learning Vector Quantization, Clustering and Data Visualization (WSOM) (2017). p. 1–8. doi:10.1109/wsom.2017.8020023
55. Cero I, Witte TK. Assortativity of Suicide-Related Posting on Social media. Am Psychol (2019) 75:365–79. doi:10.1037/amp0000477
56. Wang W, Shirley K. Breaking Bad: Detecting Malicious Domains Using Word Segmentation. In: IEEE Web 2.0 Security and Privacy Workshop (W2SP) (2015).
57. Seidman SB. Network Structure and Minimum Degree. Social Networks (1983) 5:269–87. doi:10.1016/0378-8733(83)90028-X
58. Kong Y-X, Shi G-Y, Wu R-J, Zhang Y-C. K-Core: Theories and Applications. Phys Rep (2019) 832:1–32. doi:10.1016/j.physrep.2019.10.004
59. Emerson AI, Andrews S, Ahmed I, Azis TK, Malek JA. K-core Decomposition of a Protein Domain Co-occurrence Network Reveals Lower Cancer Mutation Rates for interior Cores. J Clin Bioinforma (2015) 5:1. doi:10.1186/s13336-015-0016-6
60. Burleson-Lesser K, Morone F, Tomassone MS, Makse HA. K-core Robustness in Ecological and Financial Networks. Sci Rep (2020) 10. doi:10.1038/s41598-020-59959-4
61.wwwsecuringdemocracygmfusorg. Russia’s Affront on the News: How Newsfront’s Circumvention of Social media Bans Demonstrates the Need for Vigilance (2021). Available from: securingdemocracy.gmfus.org (Accessed February 20, 2022).
62. Aguiar L, Claussen J, Peukert C. Catch Me if You Can: Effectiveness and Consequences of Online Copyright Enforcement. Inf Syst Res (2018) 29:656–78. doi:10.1287/isre.2018.0778
63. Elbahrawy A, Alessandretti L, Rusnac L, Goldsmith D, Teytelboym A, Baronchelli A. Collective Dynamics of Dark Web Marketplaces. Sci Rep (2020) 10:18827. doi:10.1038/s41598-020-74416-y
64. Narayanan V, Barash V, Kelly J, Kollanyi B, Neudert LM, Howard P. Polarization, Partisanship and Junk News Consumption over Social media in the Us (2018).
65. Chen W, Pacheco D, Yang KC, Menczer F. Neutral Bots Probe Political Bias on Social media. Nat Commun (2020) 12:5580.
66. van der Linden S, Panagopoulos C, Roozenbeek J. You Are Fake News: Political Bias in Perceptions of Fake News. Media, Cult Soc (2020) 42(3):460–70. doi:10.1177/0163443720906992
67. Garrett RK, Bond RM. Conservatives' Susceptibility to Political Misperceptions. Sci Adv (2021) 7:eabf1234. doi:10.1126/sciadv.abf1234
Keywords: complex networks, fake news, disinformation, audience overlap, search engine optimization
Citation: Mazzeo V and Rapisarda A (2022) Investigating Fake and Reliable News Sources Using Complex Networks Analysis. Front. Phys. 10:886544. doi: 10.3389/fphy.2022.886544
Received: 28 February 2022; Accepted: 06 May 2022;
Published: 22 June 2022.
Edited by:
Haroldo V. Ribeiro, State University of Maringá, BrazilReviewed by:
Marija Mitrovic Dankulov, University of Belgrade, SerbiaFabiano Lemes Ribeiro, Universidade Federal de Lavras, Brazil
Copyright © 2022 Mazzeo and Rapisarda. This is an open-access article distributed under the terms of the Creative Commons Attribution License (CC BY). The use, distribution or reproduction in other forums is permitted, provided the original author(s) and the copyright owner(s) are credited and that the original publication in this journal is cited, in accordance with accepted academic practice. No use, distribution or reproduction is permitted which does not comply with these terms.
*Correspondence: Valeria Mazzeo, dmFsZXNkbkBnbWFpbC5jb20=
 Valeria Mazzeo
 Andrea Rapisarda