- 1Institute of Signal Processing and Transmission, Nanjing University of Posts and Telecommunications (NUPT), Nanjing, China
- 2Key Lab of Broadband Wireless Communication and Sensor Network Technology, Ministry of Education, Nanjing University of Posts and Telecommunications, Nanjing, China
In this study, we propose a scheme to capture the amplitude and phase profile of the orbital angular momentum (OAM) beam based on coherent detection. In the scheme, the OAM beam to be measured is interfered with a local plain wave which is prepared at the receiver, and two charge-coupled devices (CCDs) are used to record the constructive and destructive interference patterns. By setting the phase of the plain wave to π/2 and π, one can extract the amplitude and phase profile of the OAM beam from the two interference patterns. We verify the feasibility of the scheme by simulation and experiments. The results show that both amplitude and phase profiles of single OAM and OAM superposition modes can be captured by using the proposed scheme, and the proposed scheme shows strong robustness even under the presence of atmospheric turbulence.
1 Introduction
Orbital angular momentum (OAM) of light is an attractive degree of freedom for fundamental studies in classical communications [1, 2] and quantum information processing [3–5]. Since the first demonstration of that, an eiℓθ vortex phase structure of a circularly symmetric beam was found to have ℓℏ units of OAM in 1992, where ℏ is Planck’s constant [6], OAM has become a useful information carrier in a variety of applications [2, 7–9]. It is shown that OAM can be used together with polarization to increase the channel capacity of communication systems [10]. The usage of OAM multi-level encoding bases can increase the tolerance of quantum key distribution (QKD) systems against eavesdropping [11]. The multiplexing of OAM modes is also demonstrated to greatly increase the bandwidth efficiency both in free-space (FSO) and fiber optical communication systems [2, 12, 13].
Therefore, it is important to detect the OAM mode at the receiver end. Until now, there have been a lot of works focusing on this task [14–16]. The simplest way to detect an OAM beam is performing a projection measurement [2], where the OAM mode with ℓ topological charge is first transferred to a flat phase beam by being illuminated on a forked hologram with − ℓ and then detected by a power detector. Later, a technique for separating OAM modes by using a Mach–Zehdner interferometer at the single-photon level was presented [17]. To efficiently sort N OAM modes simultaneously, Berkhout et al. proposed a separating method based on the transformation from Cartesian to log-polar [18]. Also, the separation diffraction limitation was overcome by using the fan-out technique [19]. Simulations and experiments demonstrated that the separating method could distinguish the different OAM modes simultaneously with a detector array [20–22]. Thereafter, an efficient separating orbital angular momentum mode with radial varying phase was proposed [23]. Then, multiplane-light conversion, spiral transformation, and metasurfaces for combined OAM and SAM analysis were used to detect the OAM mode [24–28]. Recently, deep learning techniques were used to detect the OAM mode [29]. Also, the amplitude and phase quadratures of vortex beams are detected for testifying the quantum entanglement of vortex beams [30–34]. However, there are fewer studies carried out on capturing both the amplitude and phase profile of the OAM beam simultaneously.
In this study, we propose a scheme to capture the amplitude and phase profile of the OAM mode based on the coherent detection method. In the scheme, the receiver uses a beam splitter to integrate the OAM beam to be measured with a plain wave modulated with different phases to produce two interference patterns. Also, two charge-coupled devices (CCDs) are used to capture these patterns. By changing the phase of the plain wave with π/2 and π, one can obtain the amplitude and phase profiles of the OAM modes, including the single OAM mode and the superposition OAM mode, from the two CCD patterns.
There are some advantages of our scheme: 1) the proposed scheme could capture the amplitude and phase profile of the OAM mode simultaneously, 2) the proposed scheme can detect the single/superposition OAM modes, and 3) the scheme has strong robustness even under atmospheric turbulence.
2 Theory
Figure 1 shows the schematic diagram of the proposed scheme to capture the amplitude and phase profile of the orbital angular momentum mode based on the coherent detection method. The receiver uses a beam splitter to integrate the OAM beam to be measured Ein with a plain wave ELO modulated with different phase φPM to produce the interference patterns. The plain wave ELO is generated by a local oscillator and is then modulated by a phase modulator to obtain the phase φPM. The interference patterns E+ and E− are exported from the two outputs of the beam splitter. Two CCDs are used to capture the interference pattern from the two outputs of the beam splitter. By changing the phase φPM of the plain wave with π/2 and π, one can capture the amplitude and phase profile of the OAM beam Ein based on the interference pattern obtained from the CCDs.
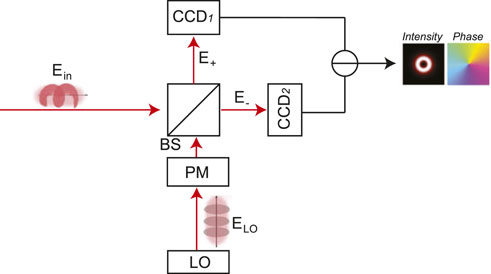
FIGURE 1. Scheme to capture the amplitude and phase profile of the OAM mode based on the coherent detection method. LO: local oscillator. PM: phase modulator. BS: beam splitter.
The OAM mode to be measured Ein is assumed to be described as
where r and θ are the radial and azimuthal coordinates, respectively; R(r) and exp(jℓθ) denote the amplitude and spatial phase of the beam, respectively; ℓ is the OAM topological charge, which is an integer; R(r) could be different mode structures, such as Laguerre–Gaussian modes or Bessel–Gaussian modes; and ω is the frequency of the OAM beam.
A plain wave ELO is generated by a local oscillator (LO) at first and is defined as
Then, it is modulated a phase by a phase modulator (PM),
where φPM is the phase modulated by the phase modulator.
After that, a beam splitter is used to combine the received OAM beam Ein and the plain wave ELO to produce interference patterns. The interference patterns E+ and E− are exported from the beam splitter, i.e.,
and
Two CCDs are used to detect the interference patterns. The interference pattern obtained by CCD1 should be |E+(r, θ, t)|2, and the interference pattern obtained by CCD2 should be |E−(r, θ, t)|2. One can obtain the difference between |E+(r, θ, t)|2 and |E−(r, θ, t)|2 as
During detection, φPM is given two values for two measurements. For the first time, the modulated phase φPM is set to π/2. For the second time, the modulated phase φPM is set to π. Since Eq. 6 is related with φPM, we define the difference |E+(r, θ, t)|2 − |E−(r, θ, t)|2 as a function f(φPM), i.e.,
By setting the phase φPM of the plain wave to π/2 and π individually, we can obtain the light field distribution of the OAM beam Ein based on the interference pattern obtained from the two CCDs, that is,
and
Therefore, the amplitude profile should be
and the phase profile should be
3 Results and discussion
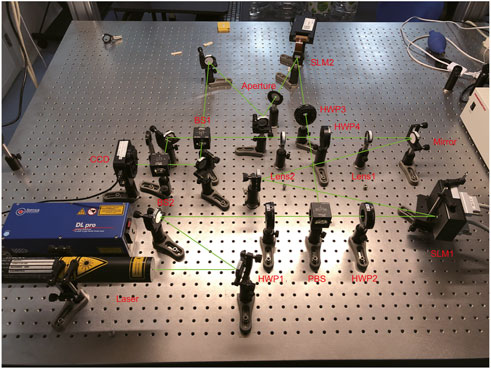
In this section, we discuss the performance of the proposed scheme. The experimental setup for the proposed scheme is shown in Figure 2. A linear fundamental mode Gaussian beam (waist radius ω0 = 0.8mm) at a wavelength of 633 nm is generated by a He–Ne laser (Thorlabs, Model HRP020-1). After being reflected by two mirrors, the beam passes through a half-wave plate (HWP1) to adjust the intensity ratio of the two Gaussian beams after splitting. A polarization beam splitter (PBS) is used to separate and polarize the incident Gaussian beam to two beams. Then, each Gaussian beam passes through a half-wave plate (HWP1 and HWP2) to match the polarization direction of the Spatial Light Modulator (SLM1, Hamamatsu, Model X10468-07, SLM2, Holoeye, Model PLOTO-VIS-006-A). After that, each Gaussian beam is diffracted by a computer-controlled SLM. SLM1 carries a phase hologram of π/2 or π (the same function as the phase modulator), and SLM2 carries a special phase hologram for the LG mode of different topological charges ℓ. The Gaussian beam needs to pass through another half-wave plate (HWP3) to equalize the polarization of the two beams so as to satisfy with the superposition conditions. At the same time, one aperture is used to filter out the first-order diffracted light from the diffracted beam, and two convex lenses (focal length f1 = 100 mm, f2 = 200 mm) are used to amplify the Gaussian beam. Thereafter, the two outcoming beams interfere at a beam splitter (BS1). For simultaneous measurement, two mirrors and beam splitter (BS2) are used to focus the two output beams of BS1 on a plane so that the two output beams can be captured by one CCD (Thorlabs, Model BC106N-VIS/M, 989 × 745 pixels of 8.8 mm × 6.6 mm size) at one time.
Then, we demonstrate the proposed scheme for the single OAM mode in Figure 3. The upper part is the simulation results, and the lower part is the experimental results. The topological charges ℓ for the measured OAM mode are setup to ℓ = −2, ℓ = 2, ℓ = 4, and ℓ = 6. In order to compare the performance, we also list the intensity and phase distribution of the input OAM beam (z = 0) and the input OAM beam (z = 1000 m) at the first two rows, where z is the propagation distance. It is can observed that the intensity and phase distribution are diverged with the propagation distance in comparison with for the input OAM beam (z = 0). Images obtained by CCD1 and Images obtained by CCD2 are the interference patterns obtained by CCD1 and CCD2, respectively, representing the constructive and destructive interference patterns, and Reconstructed results are the amplitude and phase profile of the OAM beam recovered by the proposed scheme. The simulation and experimental results show that our scheme has the ability to capture the amplitude and phase profile of the input OAM beam Ein accurately. For example, the interference patterns formed by the input OAM beam with ℓ = 2 is a “pinwheel-shaped” pattern with two stripes and clockwise rotation both in simulation and experiment, while they are “pinwheel-shaped” pattern with two stripes and counterclockwise rotation for the input OAM beam with ℓ = −2. Comparing with the simulation results, the experimental results show the same characteristic distribution of the interference patterns and phase patterns, including the rotation direction and number of “pinwheel-shaped” stripes, but with some blurring in the patterns, which is caused by the noise in experiment. Light irradiance distribution further demonstrates the consistency among the input OAM beams, the simulation results, and the experimental results. Here, the input OAM beams are those OAM beams with propagation distance (z = 1000 m). Since there always exists the propagation of the beams in experiment, we use the input OAM beams with propagation distance for comparison.
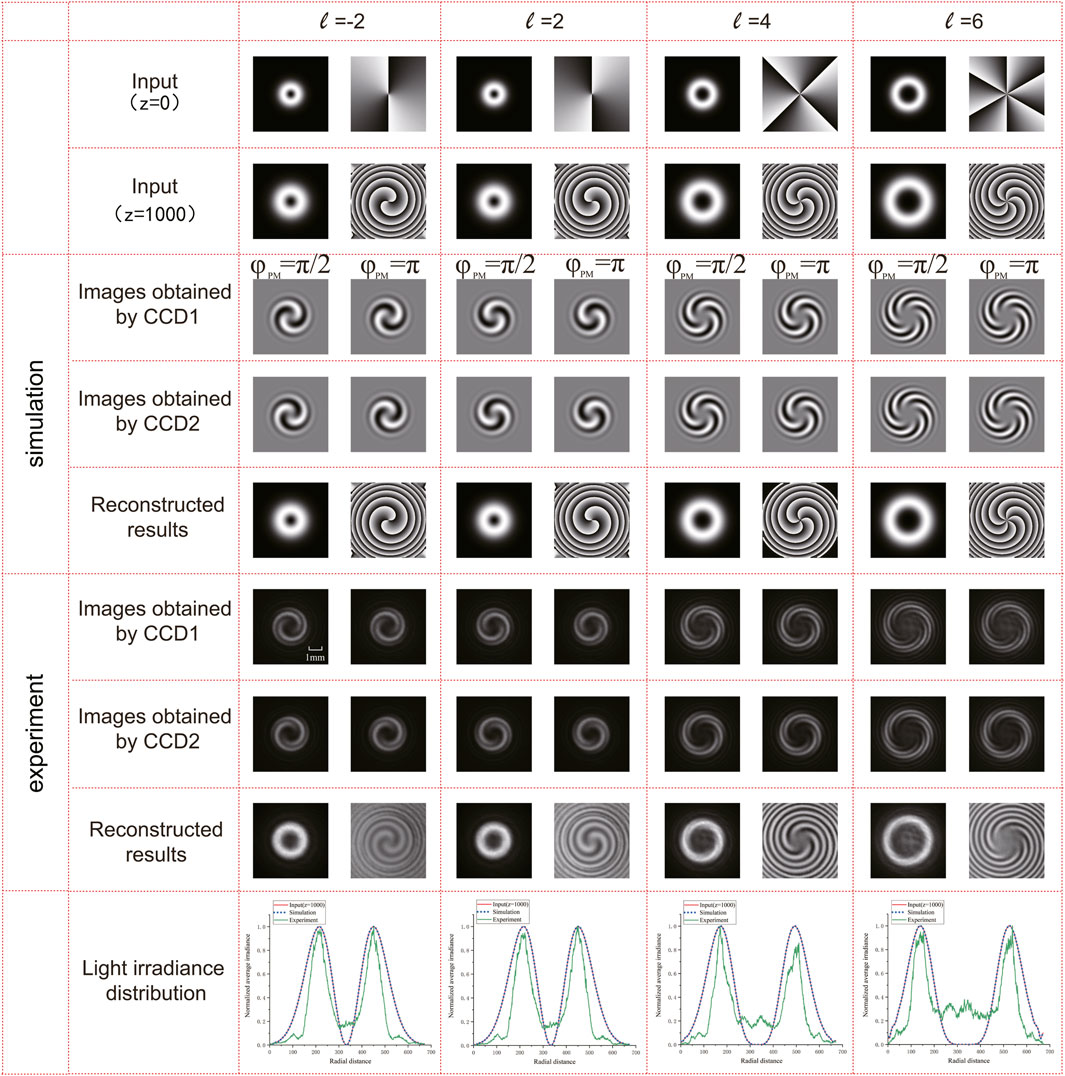
FIGURE 3. Simulation and experimental results of the proposed scheme to capture the amplitude and phase profile of single OAM beam Ein.
Then, we further verify the case when the incident beam is an OAM superposition beam in Figure 4. Here, the selected OAM superposition beams are composed by two or three OAM modes, such as ℓ = −3, 3, ℓ = 2, − 4, ℓ = 3, 8, and ℓ = 2, − 4, 8. Also, the intensity and phase profile of the superposition OAM beams are demonstrated in the first and the second row, followed by the interference patterns obtained at CCD1 and CCD2, and the last row is the recovered results by using the proposed scheme. Different from the single OAM mode, the intensity profile of the superposition OAM modes becomes bright and dark petal patterns, and the singular points in the phase profile are more complex, especially for the superposition mode composed by more OAM modes. The upper part is the simulation results, and the lower part is the experimental results. The simulation and experimental results show that both interference patterns and captured amplitude and phase patterns have the same distribution, including the number and shape of petals. It is indicated that our proposed scheme also has the ability to capture the amplitude and phase profile of the OAM superposition beam Ein accurately. Light irradiance distribution also demonstrates the similarity among the input OAM beams, the simulation results, and the experimental results.
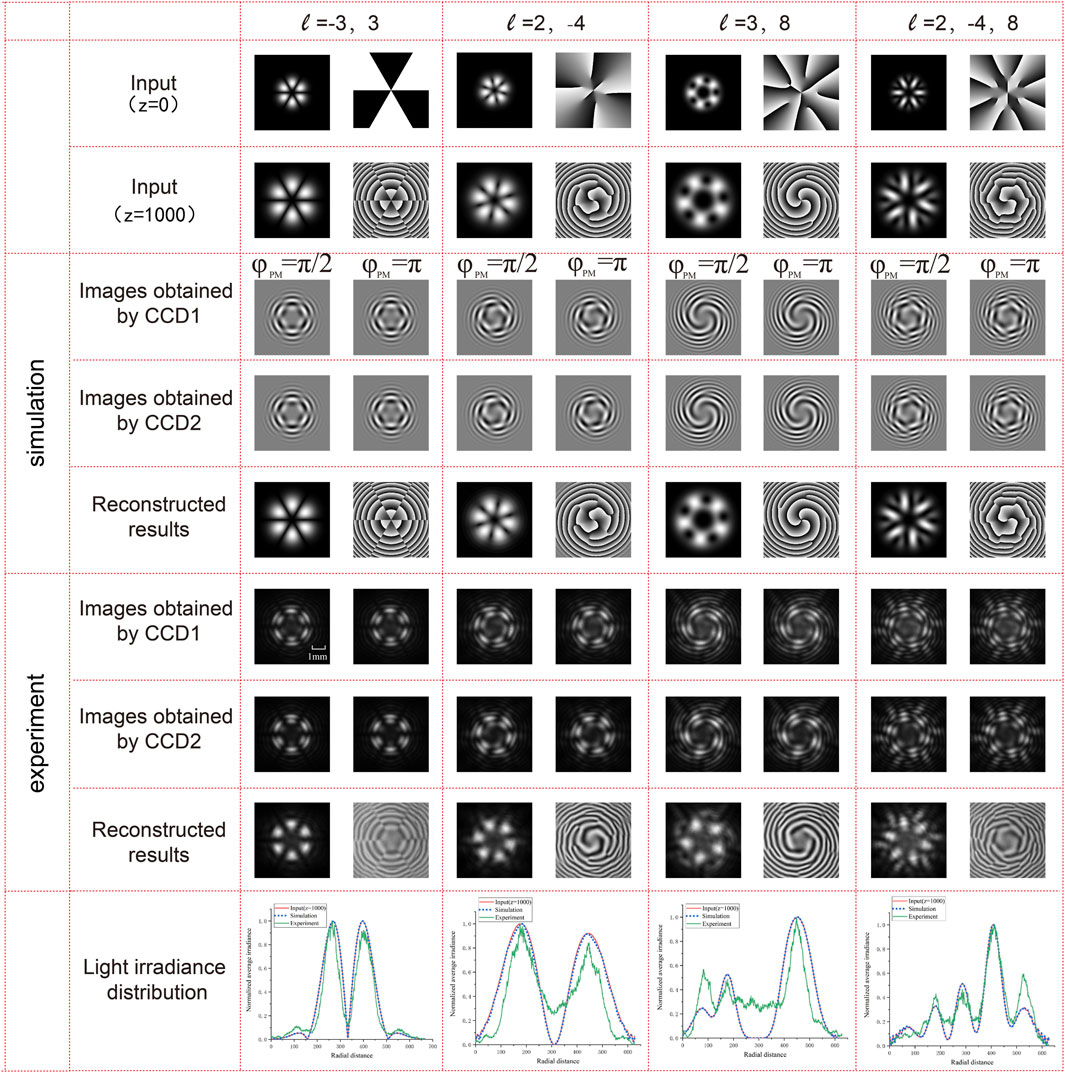
FIGURE 4. Simulation and experimental results of the proposed scheme to capture the amplitude and phase profile of OAM superposition beam Ein.
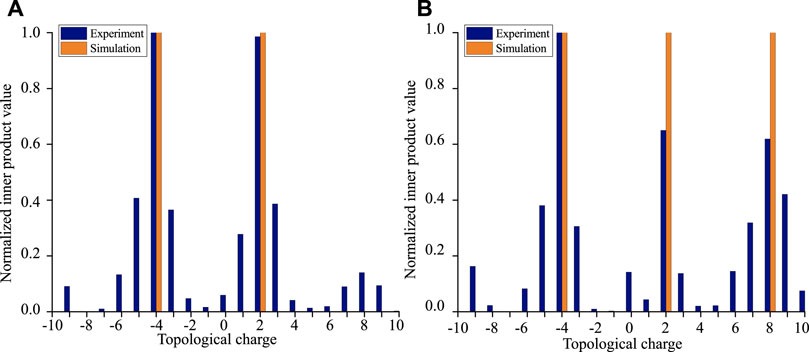
Based on the mutual orthogonality of OAM beams with different topological charges, we can obtain the topological charge composition of OAM superposition beams according to the reconstructed amplitude and phase profile. Firstly, the amplitude and phase profile are combined into an OAM beam, and then the topological charge composition of OAM superposition beams can be obtained by inner product with OAM beams with different topological charges (ℓ = 10, − 9, …, 9, 10). Figure 5 shows the inner product results of OAM superposition beams with ℓ = 2, − 4 and ℓ = 2, − 4, 8. It can be seen from the figure that we can detect the topological charge of OAM superposition beams based on the reconstructed amplitude and phase profile. There are some differences between the simulation and experiment detection results. The reason is that it is hard to locate the center of the experimental “reconstructed result”, and an insignificant misalignment will cause mode crosstalk. However, one can still judge the topological charge composition according to the experimental intensity distribution.
Next, we discuss the robustness of the proposed scheme when the OAM beam is propagated under atmospheric turbulence (AT) in Figure 6. Here, we use random phase screen model simulating atmospheric turbulence [35, 36]. The simulated parameters for the random phase screen are set as follows. The wavelength λ is 633nm, the space Δz between the two random phase screen is 200m, the beam waist ω0 is 0.1m, the outer scale is L0 = 50m, and the inner scale is l0 = 0.001m. The topological charge of the input OAM beam is ℓ = 5. The atmospheric refractive index structure constant
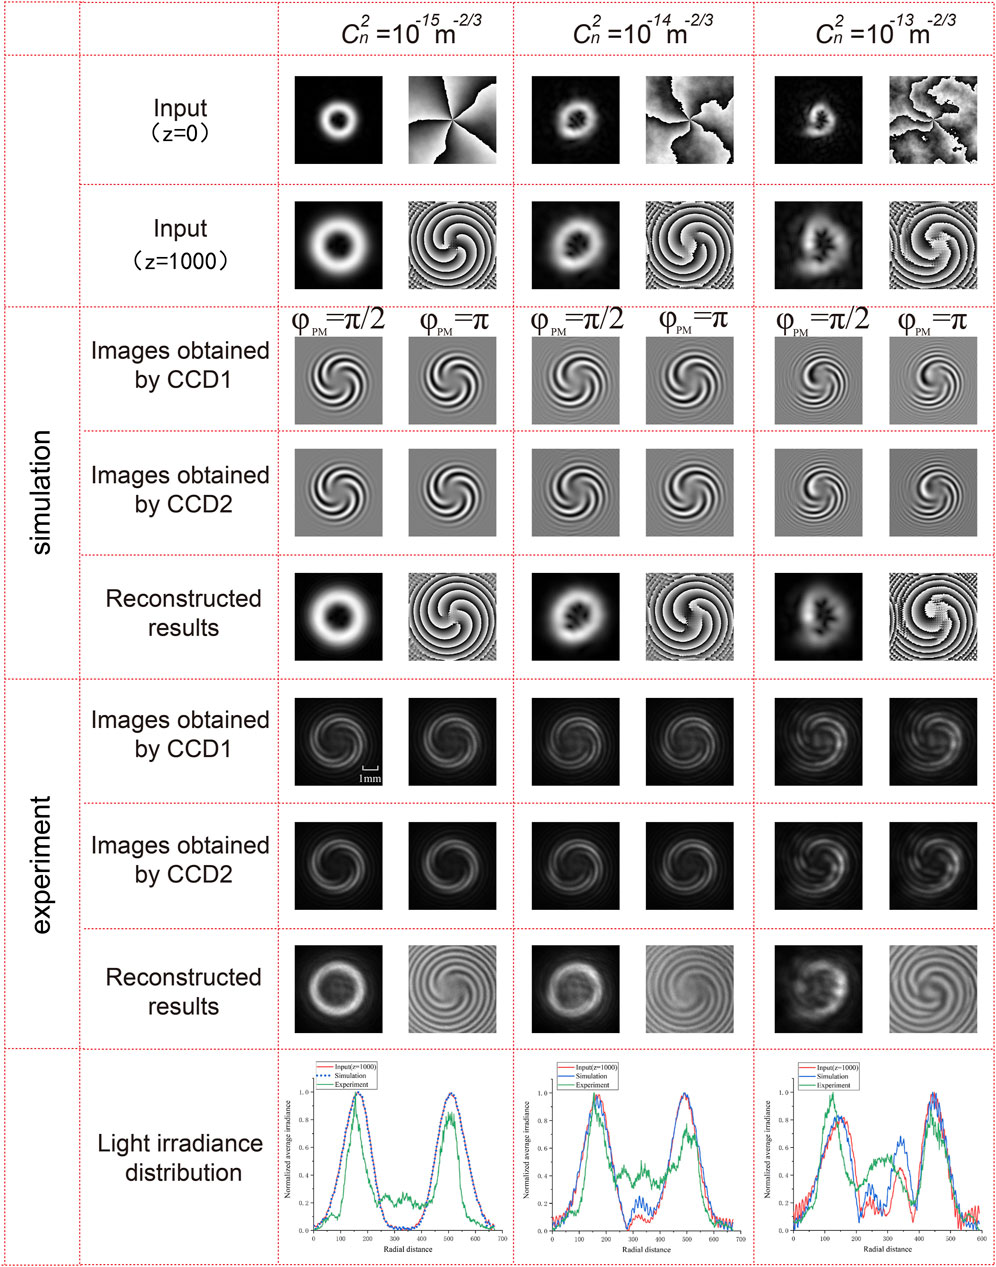
FIGURE 6. Simulation and experimental results of the proposed scheme to capture the amplitude and phase profile of the OAM beam (ℓ = 5) under the presence of atmospheric turbulence.
The peak signal-to-noise ratio (PSNR) is often used to quantitatively estimate the recovered image quality [37], which is defined as
where MAXI is the maximum possible pixel value of the image. MSE is the mean square error of the image, which is defined as
where g(xi, yj) and f(xi, yj) are gray-values in (xi, yj) for the original and reconstructed images, respectively. M × N is the pixel of the image. Generally, the higher PSNR is, the better quality of reconstructed image is.
Finally, we calculated the peak signal-to-noise ratio (PSNR) of amplitude and phase profile captured by simulation and experiment results mentioned above to illustrate the similarity between simulation and experiment results. Table 1 shows the peak signal-to-noise ratio of the simulation and experiment results. “Amplitude” denotes the PSNR for recovered amplitude part, and “phase” denotes the PSNR for the recovered phase part.
4 Conclusion
In this study, we have proposed a scheme to capture the amplitude and phase profile of the incident OAM beam based on the coherent detection. With the interference between the measured OAM beam and a local plain wave, the amplitude and phase profile of the measured OAM beam could be captured by the calculation on the detection results in CCDs. The simulation and experimental results have showed that both amplitude and phase profiles can be detected by using the proposed scheme not only for the single OAM mode but also for the OAM superposition mode. Furthermore, the amplitude and phase profiles of the measured OAM beam can even be detected under the presence of atmospheric turbulence. Our method can capture the amplitude and phase profile of the input OAM beam, regardless of whether the input beam passes through atmospheric turbulence or not. At the same time, compared with the previous method which can only obtain the amplitude profile, our method can obtain amplitude and phase profile simultaneously, that is, our method can obtain more information about the beam, so it will be more conducive for detecting topological charges in strong atmospheric turbulence environment.
Data availability statement
The original contributions presented in the study are included in the article/Supplementary Material; further inquiries can be directed to the corresponding author.
Author contributions
SZ, QQ, and LW contributed to conception and design of the study. LW performed the simulation analysis and QQ performed the experimental verification. SZ and QQ wrote the first draft of the manuscript. SZ and LW presented the revision of the manuscript. All authors contributed to manuscript revision, read, and approved the submitted version.
Funding
National Natural Science Foundation of China (NSFC) (61871234, 62001249). This work was supported in part by Open Research Fund Program of the State Key Laboratory of Low-Dimensional Quantum Physics, Tsinghua University under Grant KF201909.
Conflict of interest
The authors declare that the research was conducted in the absence of any commercial or financial relationships that could be construed as a potential conflict of interest.
Publisher’s note
All claims expressed in this article are solely those of the authors and do not necessarily represent those of their affiliated organizations, or those of the publisher, the editors, and the reviewers. Any product that may be evaluated in this article, or claim that may be made by its manufacturer, is not guaranteed or endorsed by the publisher.
References
1. Willner AE, Huang H, Yan Y, Ren Y, Ahmed N, Xie G, et al. Optical communications using orbital angular momentum beams. Adv Opt Photon (2015) 7:66–106. doi:10.1364/AOP.7.000066
2. Wang J, Yang JY, Fazal IM, Ahmed N, Yan Y, Huang H, et al. Terabit free-space data transmission employing orbital angular momentum multiplexing. Nat Photon (2012) 6:488–96. doi:10.1038/nphoton.2012.138
3. Malik M, Erhard M, Huber M, Krenn M, Fickler R, Zeilinger A. Multi-photon entanglement in high dimensions. Nat Photon (2016) 10:248–52. doi:10.1038/nphoton.2016.12
4. Wang XL, Cai XD, Su ZE, Chen MC, Wu D, Li L, et al. Quantum teleportation of multiple degrees of freedom of a single photon. Nature (2015) 518:516–9. doi:10.1038/nature14246
5. Zhang W, Ding DS, Dong MX, Shi S, Wang K, Liu SL, et al. Experimental realization of entanglement in multiple degrees of freedom between two quantum memories. Nat Commun (2016) 7:13514. doi:10.1038/ncomms13514
6. Allen L, Beijersbergen MW, Spreeuw RJC, Woerdman JP. Orbital angular momentum of light and the transformation of Laguerre-Gaussian laser modes. Phys Rev A (1992) 45:8185–9. doi:10.1103/PhysRevA.45.8185
7. Mair A, Vaziri A, Weihs G, Zeilinger A. Entanglement of the orbital angular momentum states of photons. Nature (2001) 412:313–6. doi:10.1038/35085529
8. Molina-Terriza G, Torres JP, Torner L. Twisted photons. Nat Phys (2007) 3:305–10. doi:10.1038/nphys607
9. Barreiro JT, Wei TC, Kwiat PG. Beating the channel capacity limit for linear photonic superdense coding. Nat Phys (2008) 4:282–6. doi:10.1038/nphys919
10. Malik M, O’Sullivan M, Rodenburg B, Mirhosseini M, Leach J, Lavery MPJ, et al. Influence of atmospheric turbulence on optical communications using orbital angular momentum for encoding. Opt Express (2012) 20:13195–200. doi:10.1364/OE.20.013195
11. Bourennane M, Karlsson A, Björk G. Quantum key distribution using multilevel encoding. Phys Rev A (2001) 64:012306. doi:10.1103/PhysRevA.64.012306
12. Bozinovic N, Yue Y, Ren Y, Tur M, Kristensen P, Huang H, et al. Terabit-scale orbital angular momentum mode division multiplexing in fibers. Science (2013) 340:1545–8. doi:10.1126/science.1237861
13. Boffi P, Martelli P, Gatto A, Martinelli M. Mode-division multiplexing in fibre-optic communications based on orbital angular momentum. J Opt (2013) 15:075403. doi:10.1088/2040-8978/15/7/075403
14. Leach J, Padgett MJ, Barnett SM, Franke-Arnold S, Courtial J. Measuring the orbital angular momentum of a single photon. Phys Rev Lett (2002) 88:257901. doi:10.1103/PhysRevLett.88.257901
15. Gibson G, Courtial J, Padgett MJ, Vasnetsov M, Pas’ko V, Barnett SM, et al. Free-space information transfer using light beams carrying orbital angular momentum. Opt Express (2004) 12:5448–56. doi:10.1364/OPEX.12.005448
16. Krenn M, Fickler R, Fink M, Handsteiner J, Malik M, Scheidl T, et al. Communication with spatially modulated light through turbulent air across Vienna. New J Phys (2014) 16:113028. doi:10.1088/1367-2630/16/11/113028
17. Leach J, Courtial J, Skeldon K, Barnett SM, Franke-Arnold S, Padgett MJ. Interferometric methods to measure orbital and spin, or the total angular momentum of a single photon. Phys Rev Lett (2004) 92:013601. doi:10.1103/PhysRevLett.92.013601
18. Berkhout GCG, Lavery MPJ, Courtial J, Beijersbergen MW, Padgett MJ. Efficient sorting of orbital angular momentum states of light. Phys Rev Lett (2010) 105:153601. doi:10.1103/PhysRevLett.105.153601
19. Mirhosseini M, Malik M, Shi Z, Boyd RW. Efficient separation of the orbital angular momentum eigenstates of light. Nat Commun (2013) 4:2781. doi:10.1038/ncomms3781
20. Li C, Jiang R, Wang L, Zhao SM. Simulations of high efficient separation of orbital-angular-momentum of light. J Nanjing Univ Post Telecommun (2016) 36:47–52. doi:10.14132/j.cnki.1673-5439.2016.03.007
21. Huang H, Milione G, Lavery MPJ, Xie G, Ren Y, Cao Y, et al. Mode division multiplexing using an orbital angular momentum mode sorter and MIMO-DSP over a graded-index few-mode optical fibre. Sci Rep (2015) 5:14931. doi:10.1038/srep14931
22. Huang H, Ren Y, Xie G, Yan Y, Yue Y, Ahmed N, et al. Tunable orbital angular momentum mode filter based on optical geometric transformation. Opt Lett (2014) 39:1689–92. doi:10.1364/OL.39.001689
23. Li C, Zhao SM. Efficient separating orbital angular momentum mode with radial varying phase. Photon Res (2017) 5:267–70. doi:10.1364/PRJ.5.000267
24. Fontaine NK, Ryf R, Chen H, Neilson DT, Kim K, Carpenter J. Laguerre-Gaussian mode sorter. Nat Commun (2019) 10:1865. doi:10.1038/s41467-019-09840-4
25. Wen YH, Chremmos I, Chen YJ, Zhu JB, Zhang YF, Yu SY. Spiral transformation for high-resolution and efficient sorting of optical vortex modes. Phys Rev Lett (2018) 120:193904. doi:10.1103/PhysRevLett.120.193904
26. Lei T, Fang JC, Xie ZW, Yuan XC. High-resolution cylindrical vector beams sorting based on spin-dependent fan-out optical geometric transformation. Opt Express (2019) 27:20901–9. doi:10.1364/OE.27.020901
27. Ruffato G, Capaldo P, Massari M, Mafakheri E, Romanato F. Total angular momentum sorting in the telecom infrared with silicon Pancharatnam-Berry transformation optics. Opt Express (2019) 27:15750–64. doi:10.1364/OE.27.015750
28. Wang BM, Wen YH, Zhu JB, Chen YJ, Yu SY. Sorting full angular momentum states with Pancharatnam-Berry metasurfaces based on spiral transformation. Opt Express (2020) 28:16342–51. doi:10.1364/OE.393859
29. Cox MA, Celik T, Genga Y, Drozdov AV. Interferometric orbital angular momentum mode detection in turbulence with deep learning. Appl Opt (2022) 61:D1–D6. doi:10.1364/AO.444954
30. Pan XZ, Yu S, Zhou YF, Zhang K, Zhang K, Lv SC, et al. Orbital-angular-momentum multiplexed continuous-variable entanglement from four-wave mixing in hot atomic vapor. Phys Rev Lett (2019) 123:070506. doi:10.1103/PhysRevLett.123.070506
31. Li SJ, Pan XZ, Ren Y, Liu HZ, Yu S, Jing JT. Deterministic generation of orbital-angular-momentum multiplexed tripartite entanglement. Phys Rev Lett (2020) 124:083605. doi:10.1103/PhysRevLett.124.083605
32. Wang W, Zhang K, Jing JT. Large-scale quantum network over 66 orbital angular momentum optical modes. Phys Rev Lett (2020) 125:140501. doi:10.1103/PhysRevLett.125.140501
33. Liu SS, Lou YB, Jing JT. Orbital angular momentum multiplexed deterministic all-optical quantum teleportation. Nat Commun (2020) 11:3875. doi:10.1038/s41467-020-17616-4
34. Chen YX, Liu SS, Lou YB, Jing JT. Orbital angular momentum multiplexed quantum dense coding. Phys Rev Lett (2021) 127:093601. doi:10.1103/PhysRevLett.127.093601
35. Zhao SM, Wang L, Zou L, Gong LY, Cheng WW, Zheng BY, et al. Both channel coding and wavefront correction on the turbulence mitigation of optical communications using orbital angular momentum multiplexing. Opt Commun (2016) 376:92–8. doi:10.1016/j.optcom.2016.04.075
36. Zhao SM, Leach J, Gong LY, Ding J, Zheng BY. Aberration corrections for free-space optical communications in atmosphere turbulence using orbital angular momentum states. Opt Express (2012) 20:452–61. doi:10.1364/OE.20.000452
Keywords: orbital angular momentum detection, coherent detection, amplitude and phase profile, superposition mode, atmospheric turbulence
Citation: Zhao S, Qiao Q and Wang L (2022) Capturing the amplitude and phase profile of the vortex beam based on coherent detection. Front. Phys. 10:879826. doi: 10.3389/fphy.2022.879826
Received: 20 February 2022; Accepted: 18 July 2022;
Published: 17 August 2022.
Edited by:
Gianluca Ruffato, University of Padua, ItalyReviewed by:
Jietai Jing, East China Normal University, ChinaGuoquan Zhou, Zhejiang Agriculture and Forestry University, China
Yangjian Cai, Soochow University, China
Copyright © 2022 Zhao, Qiao and Wang. This is an open-access article distributed under the terms of the Creative Commons Attribution License (CC BY). The use, distribution or reproduction in other forums is permitted, provided the original author(s) and the copyright owner(s) are credited and that the original publication in this journal is cited, in accordance with accepted academic practice. No use, distribution or reproduction is permitted which does not comply with these terms.
*Correspondence: Shengmei Zhao, emhhb3NtQG5qdXB0LmVkdS5jbg==
 Shengmei Zhao1,2*
 Quanqing Qiao