
95% of researchers rate our articles as excellent or good
Learn more about the work of our research integrity team to safeguard the quality of each article we publish.
Find out more
ORIGINAL RESEARCH article
Front. Phys. , 20 May 2022
Sec. Low-Temperature Plasma Physics
Volume 10 - 2022 | https://doi.org/10.3389/fphy.2022.879092
This article is part of the Research Topic Particle Interaction With Afterglow Plasma and Non-Quasi-Neutral Plasma View all 5 articles
In an experiment, the power that sustains a plasma was extinguished, so that microspheres, which had been levitated, fell downward toward a lower electrode. At the beginning of their fall, the microspheres were self-organized with a crystalline structure. This structure was found to be preserved as the microspheres accelerated all the way to the lower electrode. Although microspheres had, in this afterglow plasma, large positive charges of 12,500 e, their interparticle repulsion was unable to significantly alter the crystalline arrangement of the microspheres, as they fell. After their impact on the lower electrode, the microspheres bounced upward, and only then was the crystalline structure lost.
A dusty plasma, also known as a complex plasma, contains small solid particles as well as electrons, ions, and gas [1–4]. The solid particles usually collect more electrons than ions, so that they gain a negative electrical charge. When the particles are microns in size, the charge can be thousands of elementary charges [1–4]. Due to the large charge, the Coulomb interactions between two micron-size solid particles can be so strong that the interparticle potential energy exceeds the particle kinetic energy. In that situation, as a charged component of the plasma, the solid particles are said to be strongly coupled [1–12], even when the electrons and ions remain weakly coupled.
When they are strongly coupled, charged particles can arrange themselves in an organized structure. When their potential energy is sufficiently large, this structure can be crystalline, with particles arranged in rows with a nearly equal spacing. Such dust crystals are common in laboratory experiments with dusty plasmas, especially when the solid particles are all equally charged, or nearly so. To assure that charges are nearly equal, the particles that are used are often precision microspheres, made of silica or a polymer, melamine formaldehyde. Such microspheres are available commercially, with a size dispersion as small as a few percent, in terms of their diameter.
Experiments with crystalline structure in dusty plasmas began nearly 30 years ago [13–16], and since then there have been numerous publications, including [5, 9, 10, 17–40] to mention just a few. These experiments were generally done with the plasma in a powered state, with a high voltage applied to electrodes to sustain the ionization of the gas. Operating with steady power allows the experimenter to levitate the microspheres, using an upward electrical force due to a negative potential on a lower electrode. When the power is switched off, this levitation abruptly ceases, and the microspheres fall, so that they land on the lower electrode within milliseconds. Until recently, the situation when the power had been switched off was usually considered by experimenters to be just the end of an experiment, and not the experiment itself. Now, however, the response of microspheres to afterglow-plasma conditions, immediately after the plasma power is switched off, is gaining more attention [41–66].
In the first one or 2 ms of an afterglow plasma, the electrons and ions leave the plasma volume, and their charges are absorbed on the chamber walls [49, 59]. The electrons leave somewhat more rapidly, so that it is possible for the microsphere to collect an excess of ions. With this excess collection of ions, the microsphere’s charge can reverse polarity, becoming positive and remaining so during the rest of the afterglow [41, 57, 62–64, 67]. With this positive charge, the microspheres experience a vertical electric force, due to the potential on the lower electrode. If the lower electrode retains a negative potential at all times, the newly positive microspheres are pushed downward, so that they fall with a larger acceleration than due to gravity alone, as reported recently [41].
In this paper, we report an experiment to investigate what happens to the crystalline structure of a collection of microspheres, as they fall toward the lower electrode. Before performing this experiment, we expected that we would observe a strong horizontal repulsion among the microspheres, as they fell, so that the crystalline structure would be lost. In fact, however, we found that the crystalline structure was preserved as the cloud of microspheres fell, with no significant disorder developing until the microspheres landed on the lower electrode. After they landed, at a velocity of 712 mm/s, the microspheres bounced, and only then was the structure lost. These results for a falling dust crystal were made possible by imaging the microspheres not only from the side, as in the previous experiment [41], but also from the top so that the crystalline structure could be viewed before and after switching off the power that sustained the plasma.
An experiment was performed in the afterglow of a dusty plasma, using instrumentation based on that of Ref. [41]. During the steady application of radio-frequency power, a single layer of microspheres was levitated above a horizontal electrode. These microspheres self-organized into a dust crystal. Later, the radio-frequency power was abruptly switched off. Both before and after this event we imaged the microspheres using not only a side-view camera as in Ref. [41], but also a top-view camera to allow us to characterize the structure.
The chamber, sketched in Figure 1, was powered by a 13 MHz capacitively coupled radio-frequency waveform, with 336 Vpp amplitude. The horizontal lower electrode, which was 16.25 cm diameter, was powered, while the remainder of the chamber was grounded. A dc self-bias of −171 V developed naturally on the lower electrode, while the plasma was powered. Argon at a steady pressure of 8 mTorr was used, with minimal gas flow.
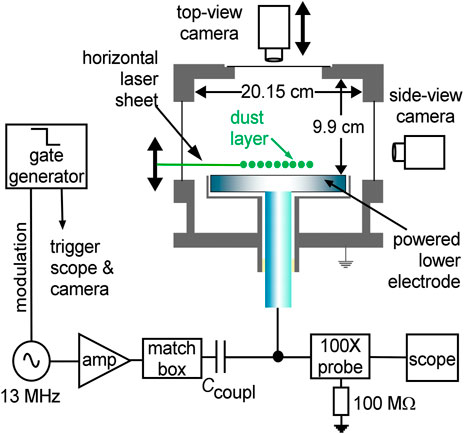
FIGURE 1. Side-view sketch of the experimental setup. A single layer of microspheres was levitated above the lower electrode, which was powered by a radio-frequency waveform. The plasma power was switched off at t = 0 by modulating the 13 MHz oscillator signal using the gate generator. During the subsequent afterglow, the capacitor Ccoupl maintained a negative bias on the lower electrode. A top-view camera, for viewing the 2D structure, was mounted on a vertical translation stage, so that the camera could be repositioned at a different height. To illuminate the microspheres, two laser sheets were used: a horizontal sheet at 532 nm (produced by optics mounted on a vertical translation stage) and a vertical sheet at 671 nm (not shown here).
The microspheres used were melamine-formaldehyde (MF) polymer. The manufacturer’s [68] specifications were 8.69 μm diameter and 1.51 g/cm3 density. After turning on the plasma, we introduced about 2,500 microspheres by agitating a dispenser located above the plasma. They settled into a horizontal layer, 13.9 mm above the lower electrode. At that time, the microspheres were negative charge estimated as -14,000 e, as explained in Ref. [41] where the conditions were nearly identical to those of the present experiment. Due to this large negative charge, the microspheres were levitated upward by the negative dc bias on the lower electrode. Within seconds of being introduced into the plasma chamber, the cloud of microspheres self-organized for form a 2D crystalline structure, with a lattice constant [8, 69] of typically b = 0.58 mm.
To produce an afterglow plasma, a square-wave modulation was applied to the 13 MHz oscillator, causing it to suddenly switch off at time t = 0. Thereafter, the lower electrode no longer had an oscillating voltage that could accelerate electrons and thereby sustain the ionization, and the background plasma extinguished within 2 ms. Even after the background plasma of electrons and ions was gone, the lower electrode retained a large negative bias, due to the coupling capacitor Ccoupl shown in Figure 1.
As explained in detail in Ref. [41], there is an evolution, with different time scales, for the abundance and energy of electrons and ions, after turning off the rf power. Within a first few microseconds, the energetic electrons are cooled by colliding with the neutral gas atoms. And after that, in next few hundreds of microseconds, the slow electrons are lost to the chamber walls. Thereafter, only ions remain in the plasma chamber that too lost to the chamber walls within a time of t < 2 ms.
The microspheres can develop a positive charge during the time interval when only ions are present (after the first few hundreds of microseconds and before t < 2 ms). Having this positive charge, the microspheres were accelerated downward more forcefully than by gravity alone, due to attraction toward the lower electrode, which still had a negative bias. The value of the positive charge was +12,500 e, as determined by measuring the downward acceleration, using the method developed in Ref. [41]. It took 40 ms for the microspheres to fall 13.9 mm and impact on the lower electrode.
Two cameras were used to image the cloud of microspheres. These were both 12-bit Phantom v5.2 cameras. A side-view camera was used as in Ref. [41], operated at 600 frames/sec, allowing us to image the cloud of microspheres as it fell. For this experiment, we also used a top-view camera, to image the 2D structure of the cloud. This camera was mounted on a vertical translation stage, so that we could adjust the height of its image plane.
Laser sheets were used to illuminate the cloud. A vertical sheet of 671 nm was used for the side-view camera, while the horizontal sheet was 532 nm. The horizontal sheet was for the top-view camera, and the optics that produced this sheet included a vertical translation stage, matching the one for the camera, so that the camera remained in focus, with the same magnification, as the horizontal sheet was moved. The lenses of both cameras were fitted with interference filters, so that only the desired wavelength of light was imaged. The imaging resolution was 0.037 mm and 0.034 mm per pixel, for the top and side-view cameras, respectively.
The horizontal laser sheet was at first positioned to illuminate a plane at 13.9 mm above the lower electrode, where the microspheres were levitated during steady plasma operation. After recording an image, we then lowered the laser sheet to 0.9 mm (which is the lowest that was practical for our setup) above the lower electrode, and moved the top-view camera downward by the same displacement. This re-positioning of the optics required about 1 min, and it was performed while the plasma continued to be steadily powered.
We then triggered the modulation, turning off the rf power and causing the plasma to extinguish. As the cloud of microspheres were falling, we captured an image when they were at a height of 0.9 mm.
The procedure described above allowed capturing, in a single experimental run, an image of the microspheres about a minute before they were dropped, and then again as they were falling. We verified that additional runs were consistent. For example, in some of these additional runs, we imaged the microspheres at other heights during the fall.
Beginning at t = 0, when the rf power was extinguished, the side-view camera recorded the motion of the microspheres as they fell to the lower electrode, and then bounced. This motion was characterized using the side-view camera that recorded a total of 250 ms at 600 frames/sec. A movie is provided in the Media, Supplementary Material.
We verified that additional runs were consistent. For example, in some of these additional runs, we imaged the microspheres at other heights during the fall.
Figure 2 shows a superimposed image of frames from the side-view camera, as the microspheres fell. This figure includes 7 of the 24 frames that were captured at 600 frames/sec during the fall. Examining this figure, we can see that the microspheres were accelerated, and they fell mostly straight down. The acceleration was measured and used to calculate the residual charge of +12,500 e, using Eq. 12 of Ref. [41].
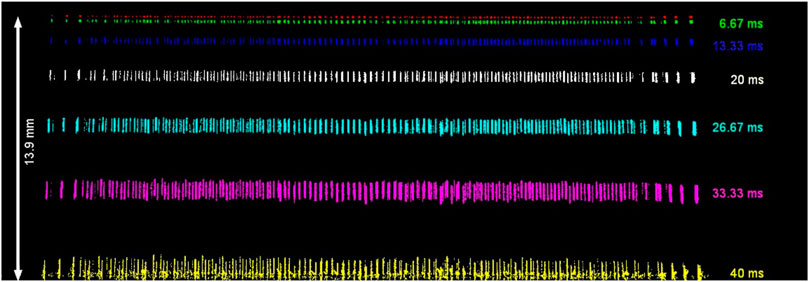
FIGURE 2. Side-view images of falling microspheres. Shown here is a superposition of every fourth image recorded during the fall. This result reveals that the motion is mainly a downward acceleration, with a slight outward displacement, which are quantified in the main text. The top-most image was recorded at t = 0, which was the moment that the radio-frequency power was switched off; the other images were recorded at later times, as indicated in the legend.
For this paper, our primary analysis of the side-view camera data is a characterization of horizontal motion, as the microspheres fell. One might expect a significant horizontal repulsion among the similarly charged microspheres, but we find that in fact there is very little horizontal displacement.
We analyzed the coordinates of the microspheres in Figure 2, using ImageJ software [70]. For the two outermost microspheres that are visible on the right and left edges of Figure 2, we measured the outward horizontal displacements and found them to be 0.44 and 0.46 mm, on the left and right side, respectively. These values are based on a comparison of the horizontal positions at t = 0 and t = 40 ms.
The outward deviation from the vertical, for the outermost microspheres, was only about 32 milliradians, or 1.9°. This value is calculated straightforwardly from the horizontal displacement of 0.45 mm on each side, during the time required to fall 13.9 mm.
To gain some physical insight into the reason from the small outward deviation, we can mention a simple calculation of the interparticle repulsion, to show how small it is. Consider just two charged microspheres, on a horizontal plane, separated as in the experiment. Using the measured values of the microspheres charge +12,500 e and the initial separation of 0.58 mm, we can calculate the horizontal Coulomb force as 1.07 × 10⁻¹³ N (This is a simple calculation, relevant to the conditions after t > 2 ms when the electrons and ions have departed, leaving no space charge to cause Debye shielding.) Using this calculated value of the force, along with the known mass of the microspheres, we obtain the horizontal displacement of only 0.16 mm during the time interval of 40 ms, for a system of just two microspheres. The actual displacement can be larger than this estimate, due to the additional repulsion from the other 2,500 microspheres in the experiment, especially for the farthest outlying microspheres which we measured to have a displacement of 0.45 mm on each side. Essentially, the reason that the horizontal displacement is so small, in this experiment, is that the time is too short for the microspheres to move much due to interparticle repulsion. And the reason that the time is short is simply that there is a large vertical force that can rapidly drive the microspheres down to the lower electrode. (If the vertical force were somehow reduced, then the time would be longer, and the horizontal displacements could be larger than in our experiment.)
After the microspheres impacted on the lower electrode at 712 mm/s, we observe that they bounced. This bouncing motion is seen in Figure 3, which was obtained from the side-view camera. Seven frames were superimposed, beginning at t = 42 ms.
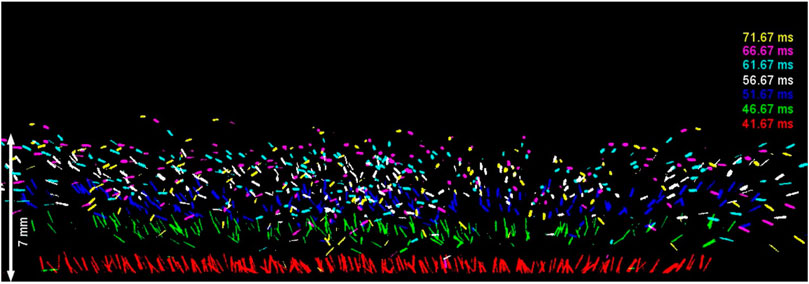
FIGURE 3. Side-view images of microspheres bouncing from the electrode surface. This is a superposition of every third frame from the side-view camera. The bottom-most image was recorded immediately at t = 41.67 ms, immediately after impact, and the other images were recorded at later times, as indicated in the legend. A bouncing microsphere has not only vertical motion but also lateral scattering, which destroys the crystalline structure that the cloud of microspheres had before impact.
The microspheres did not bounce directly upward, but instead scattered with irregular lateral components to their motion. Due to this horizontal component, the crystalline structure of the cloud of microspheres was completely lost, after impact. The irregularity of this horizontal motion might be explained by a microscopic roughness of the lower electrode’s surface, which was finished on a lathe. Since the microsphere radius is only 8.69 µm, we expect that the microscopic roughness of the surface finish could account for the observed horizontal motion.
The vertical bounce height was generally about one-half of the original height. This indicates that the collision had a significantly elastic character, as the melamine-formaldehyde microspheres impacted on the stainless-steel electrode. We cannot say whether the impact caused a change of the microsphere’s charge. If that charge did change, so would the electric potential energy of a microsphere as it rebounded, which would complicate any effort to quantify the fraction of the incident kinetic energy that was retained in the impact.
During steady plasma operation, with the radio-frequency power on, the microspheres were arranged in a crystalline pattern, seen in Figure 4A. This bit-map image of a dust crystal was recorded by the top-view camera, when it was adjusted to image at a height of 13.9 mm.
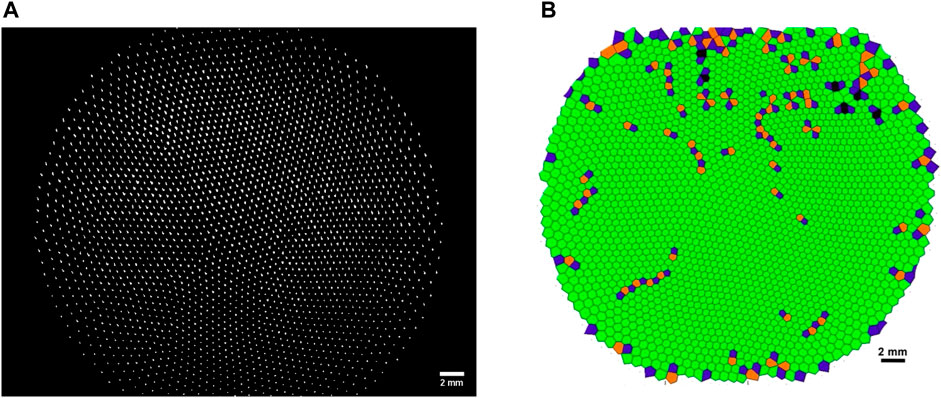
FIGURE 4. Top-view image (A) of the 2D dust crystal when the plasma was on, and the microspheres were levitated steadily at a height of 13.9 mm above the lower electrode. The crystalline structure in the microsphere arrangement seen in (A) is verified by the Voronoi diagram (B), which we obtained by analyzing the coordinates of microspheres in (A). Defects are highlighted in different colors to indicate five and seven-fold polygons, as compared to the six-fold polygons for a crystal.
Using this bit-map image as an input, we obtained the x-y coordinates of individual microspheres. This image analysis was done using ImageJ software [70], following the prescription of Ref. [71] for the moment method of measurement.
While the plasma was steadily powered, the structure in Figure 4A is mainly hexagonal, which is to say that there is a six-fold symmetry to the arrangement of neighboring microspheres. A few microspheres had five or seven nearest neighbors, as seen in the Voronoi diagram in Figure 4B. A Voronoi diagram is made by first identifying the line segments, called bonds, between nearest neighbors, so that they are arranged as triangles. A cell of the Voronoi diagram is then constructed as a polygon by bisecting the bonds [9, 10, 72]. We calculated Voronoi diagrams using IDL software, with an input of x-y coordinates of the microspheres. The defect fraction was 5.7%, meaning that 5.7% of the microspheres had either five or seven nearest neighbors. These defects, which are colored differently in the Voronoi diagram, were especially concentrated at the outer perimeter of the cloud, while the central region had a lesser abundance of defects.
Later, in the afterglow conditions at t > 0, we recorded another image of the microspheres as they fell. This image, recorded at a height of 0.9 mm, is shown in Figure 5A, which reveals that the microspheres still had the same hexagonal structure, even after the plasma had been switched off and the microspheres had almost completed their fall to the lower electrode.
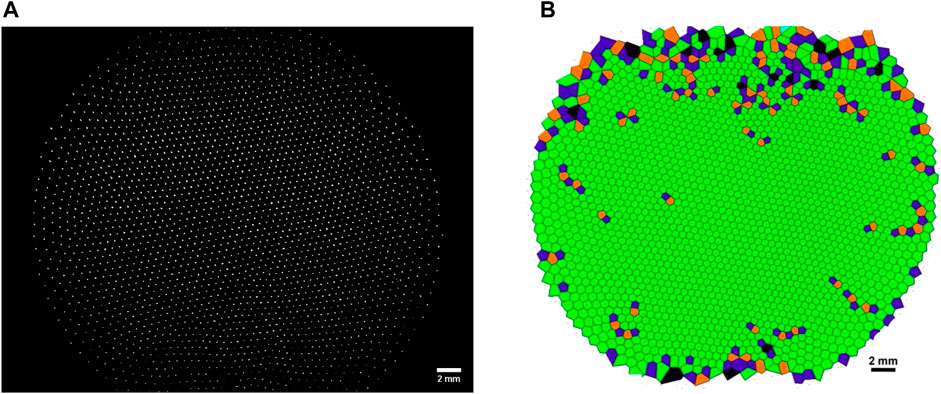
FIGURE 5. Top-view image (A) of falling microspheres recorded when they were at a height of 0.9 mm above the lower electrode. The Voronoi diagram (B) of the microsphere arrangements just before impact on the electrode is not much different from that when the plasma was on, as seen in Figure 4B. This resemblance confirms that the crystalline structure of the cloud of microspheres was largely preserved as it fell.
Along with the bit-map image of the cloud of microspheres in Figure 5A, we also present the corresponding Voronoi diagram in Figure 5B. Once again, there are only a few defects in the crystalline structure of the cloud of microspheres. The defect fraction of 5.2% was almost unchanged as the microspheres fell. We can see that the crystalline structure was largely preserved, as dust crystal fell.
For a better comparison of the microspheres as viewed from the top, in Figures 4A, 5A, the two images are superimposed in Figure 6. From this figure, we can see how the microspheres were displaced horizontally very little, as they fell toward the lower electrode. This result, which is consistent with the observations from the side-view imaging, is due to the brevity of the time of fall, as we explained in Section 3.1.
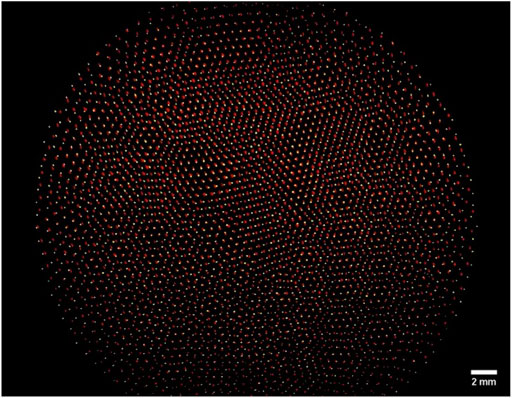
FIGURE 6. Superimposed image of two top-view images of the dust crystal recorded at heights of 13.9 mm (red) and 0.9 mm (yellow), with plasma power on and off, respectively. These images were recorded about 1 min apart; during the time interval between we moved the horizontal laser sheet and top-view camera downward to record the image at 0.9 mm.
A close examination of Figure 6 reveals that the diameter of the cloud expanded slightly during the fall. Aside from that expansion, other small differences in the two images are detectable mainly in regions where defects are numerous. Defects are generally known to cause an increase in horizontal motion, even during steady operation of the plasma [10, 13, 16, 37, 73, 74], which is a phenomenon described as dynamical heterogeneity [75, 76].
As an additional indicator of structure, we present a pair correlation function, g(r), in Figure 7. This function, also known as the radial distribution function, represents the probability of finding a particle at a given distance from another [10, 20, 34, 73, 77, 78]. For a perfect 2D crystal at a zero temperature, g(r) would be a series of delta functions as a function of distance. These peaks will broaden and diminish in height as the temperature increases, and as translational order diminishes [37, 73, 78].
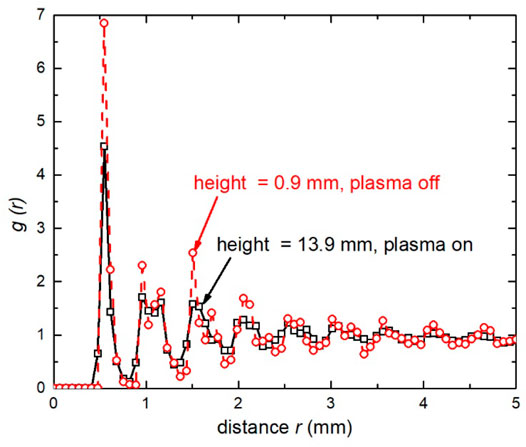
FIGURE 7. Pair correlation function g(r), which indicates the probability of finding two particles at given separation r. These experimental data were obtained from top-view camera images: Figure 4A with plasma on and steadily levitated microspheres, as compared to Figure 5A with plasma off and falling microspheres. The close resemblance of these two curves is further confirmation that the microscopic structure of the cloud of microspheres did not change significantly, as it fell to the lower electrode.
To obtain Figure 7, we calculated g(r) using an input of measured coordinates of microspheres. Those coordinates were obtained by analyzing two images, Figure 4A with the plasma power on, and Figure 5A as the microspheres were falling after the plasma was switched off. A standard method was used, counting microspheres within annual rings of radius r, which were centered on the location of a microsphere, and dividing by the area of the ring [37].
The pair correlation function in Figure 7 confirms that the structure was largely unchanged, as the cloud of microspheres fell. If the structure had instead become more disorganized, the peaks in g(r) would have broadened. Instead, the peaks actually became higher and more distinctive, indicating that the translational order of the microspheres did not decrease, but actually increased, as they fell.
Crystalline arrangements of microspheres are commonly observed in dusty plasmas [5, 9, 10, 13–40]. These dust crystals have, until now, usually been observed with the electrical power switched on, to sustain the background plasma of electrons and ions. That background plasma serves the purposes of sustaining a charge on each microsphere, and providing a sheath electric field that levitates and confines the microspheres. When the plasma is switched off, the levitation ends abruptly, and the cloud of microspheres falls.
The experiment reported here answers two questions. First, is the crystalline structure preserved as the microspheres fall? Second, when microspheres land on the lower electrode, do they bounce, or do they stick to the solid surface?
By imaging a 2D cloud of microspheres from both the top and side, we found that the cloud of microspheres sustained its crystalline microscopic structure as it fell, when the radio-frequency power that sustained the plasma was switched off. The transverse displacement of microspheres during the fall was minimal, in this particular experiment, with a downward acceleration of 17.8 m/s2. After impact on the lower electrode, we found that the microspheres bounced from its surface, and scattered laterally so that the crystalline arrangement ceased after impact.
The raw data supporting the conclusion of this article will be made available by the authors, without undue reservation.
NC performed the experiment and data analysis. JG supervised the project. Both authors contributed to writing the paper.
This work was supported by the Army Research Office under MURI Grant No. W911NF-18-1-0240, United States Department of Energy Grant No. DE-SC0014566, NASA/JPL RSA No. 1663801, and National Science Foundation Grant No. PHY-1740379.
The authors declare that the research was conducted in the absence of any commercial or financial relationships that could be construed as a potential conflict of interest.
All claims expressed in this article are solely those of the authors and do not necessarily represent those of their affiliated organizations, or those of the publisher, the editors and the reviewers. Any product that may be evaluated in this article, or claim that may be made by its manufacturer, is not guaranteed or endorsed by the publisher.
We thank M. Bakas and E. Thimsen for helpful discussions, and we thank A. Kananovich for technical assistance.
The Supplementary Material for this article can be found online at: https://www.frontiersin.org/articles/10.3389/fphy.2022.879092/full#supplementary-material
1. Shukla PK, Mamun AA. Introduction to Dusty Plasma Physics. Bristol: Institute of Physics Pub (2002).
2. Tsytovich VN, Morfill G, Vladimirov SV, Thomas HM. Elementary Physics of Complex Plasmas. Lecture Notes in Physics. 1st ed., 731. Berlin, HeidelbergImprint: Springer Berlin HeidelbergSpringer (2008).
3. Bonitz M, Henning C, Block D. Complex Plasmas: a Laboratory for strong Correlations. Rep Prog Phys (2010) 73(6):066501. doi:10.1088/0034-4885/73/6/066501
4. Melzer A, Physics of Dusty Plasmas : An Introduction. 1st. ChamImprint: Springer International PublishingSpringer (2019).
5. Fortov VE, Molotkov VI, Nefedov AP, Petrov OF. Liquid- and Crystallike Structures in Strongly Coupled Dusty Plasmas. Phys Plasmas (1999) 6(5):1759–68. doi:10.1063/1.873434
6. Murillo MS. Static Local Field Correction Description of Acoustic Waves in Strongly Coupling Dusty Plasmas. Phys Plasmas (1998) 5(9):3116–21. doi:10.1063/1.873037
7. Murillo MS. Strongly Coupled Plasma Physics and High Energy-Density Matter. Phys Plasmas (2004) 11(5):2964–71. doi:10.1063/1.1652853
8. Quinn RA, Goree J. Experimental Investigation of Particle Heating in a Strongly Coupled Dusty Plasma. Phys Plasmas (2000) 7(10):3904–11. doi:10.1063/1.1286988
9. Feng Y, Goree J, Liu B. Solid Superheating Observed in Two-Dimensional Strongly Coupled Dusty Plasma. Phys Rev Lett (2008) 100(20):205007. doi:10.1103/PhysRevLett.100.205007
10. Ruhunusiri WDS, Goree J, Feng Y, Liu B. Polygon Construction to Investigate Melting in Two-Dimensional Strongly Coupled Dusty Plasma. Phys Rev E (2011) 83(6):066402. doi:10.1103/PhysRevE.83.066402
11. Singh Dharodi V, Kumar Tiwari S, Das A. Visco-elastic Fluid Simulations of Coherent Structures in Strongly Coupled Dusty Plasma Medium. Phys Plasmas (2014) 21(7):073705. doi:10.1063/1.4888882
12. Bailung Y, Chutia B, Deka T, Boruah A, Sharma SK, Kumar S, et al. Vortex Formation in a Strongly Coupled Dusty Plasma Flow Past an Obstacle. Phys Plasmas (2020) 27(12):123702. doi:10.1063/5.0022356
13. Chu JHIL. Direct Observation of Coulomb Crystals and Liquids in Strongly Coupled Rf Dusty Plasmas. Phys Rev Lett (1994) 72(25):4009–12. doi:10.1103/PhysRevLett.72.4009
14. Thomas H, Morfill GE, Demmel V, Goree J, Feuerbacher B, Mohlmann D. Plasma Crystal - Coulomb Crystallization in a Dusty Plasma. Phys Rev Lett (1994) 73(5):652–5. doi:10.1103/PhysRevLett.73.652
15. Hayashi Y, Tachibana K. Observation of Coulomb-Crystal Formation from Carbon Particles Grown in a Methane Plasma. Jpn J Appl Phys (1994) 33(6):L804–L6. doi:10.1143/Jjap.33.L804
16. Chu JH, Lin I. Coulomb Lattice in a Weakly Ionized Colloidal Plasma. Physica A (1994) 205(1-3):183–90. doi:10.1016/0378-4371(94)90498-7
17. Fortov VE. Overview of Ordered Dust Structures in Dusty Plasmas. Phys Scripta (2004) T107:90–7. doi:10.1238/Physica.Topical.107a00090
18. Hariprasad MG, Bandyopadhyay P, Arora G, Sen A. Experimental Observation of a Dusty Plasma crystal in the Cathode Sheath of a DC Glow Discharge Plasma. Phys Plasmas (2018) 25(12):123704. doi:10.1063/1.5079682
19. Hartmann P, Douglass A, Reyes JC, Matthews LS, Hyde TW, Kovács A, et al. Crystallization Dynamics of a Single Layer Complex Plasma. Phys Rev Lett (2010) 105(11):115004. doi:10.1103/PhysRevLett.105.115004
20. Hartmann P, Kalman GJ, Donkó Z, Kutasi K. Equilibrium Properties and Phase Diagram of Two-Dimensional Yukawa Systems. Phys Rev E (2005) 72(2):026409. doi:10.1103/PhysRevE.72.026409
21. Hartmann P, Rosenberg M, Kalman GJ, Donkó Z. Ground-state Structures of Superparamagnetic Two-Dimensional Dusty Plasma Crystals. Phys Rev E (2011) 84(1):016409. doi:10.1103/PhysRevE.84.016409
22. Hebner GA, Riley ME, Johnson DS, Ho P, Buss RJ. Direct Determination of Particle-Particle Interactions in a 2D Plasma Dust Crystal. Phys Rev Lett (2001) 87(23):235001. doi:10.1103/PhysRevLett.87.235001
23. Jaiswal S, Hall T, LeBlanc S, Mukherjee R, Thomas E. Effect of Magnetic Field on the Phase Transition in a Dusty Plasma. Phys Plasmas (2017) 24(11):113703. doi:10.1063/1.5003972
24. Jaiswal S, Thomas E. Melting Transition of Two-Dimensional Complex Plasma crystal in the DC Glow Discharge. Plasma Res Express (2019) 1(2):025014. doi:10.1088/2516-1067/ab1f30
25. Knapek CA, Samsonov D, Zhdanov S, Konopka U, Morfill GE. Recrystallization of a 2D Plasma Crystal. Phys Rev Lett (2007) 98(1):015004. doi:10.1103/PhysRevLett.98.015004
26. Kostadinova EG, Guyton F, Cameron A, Busse K, Liaw C, Matthews LS, et al. Transport Properties of Disordered Two-Dimensional Complex Plasma crystal. Contrib Plasm Phys (2018) 58(2-3):209–16. doi:10.1002/ctpp.201700111
27. Melzer A, Schweigert VA, Schweigert IV, Homann A, Peters S, Piel A. Structure and Stability of the Plasma crystal. Phys Rev E (1996) 54(1):R46–R9. doi:10.1103/PhysRevE.54.R46
28. Nefedov AP, Petrov OF, Molotkov VI, Fortov VE. Formation of Liquidlike and Crystalline Structures in Dusty Plasmas. Ieee T Plasma Sci (2001) 29(2):210–5. doi:10.1109/27.923696
29. Nosenko V, Goree J, Ma ZW, Dubin DHE, Piel A. Compressional and Shear Wakes in a Two-Dimensional Dusty Plasma crystal. Phys Rev E (2003) 68(5):056409. doi:10.1103/PhysRevE.68.056409
30. Nosenko V, Goree J, Skiff F. Bispectral Analysis of Nonlinear Compressional Waves in a Two-Dimensional Dusty Plasma crystal. Phys Rev E (2006) 73(1):016401. doi:10.1103/PhysRevE.73.016401
31. Nosenko V, Nunomura S, Goree J. Nonlinear Compressional Pulses in a 2D Crystallized Dusty Plasma. Phys Rev Lett (2002) 88(21):215002. doi:10.1103/PhysRevLett.88.215002
32. Nunomura S, Goree J, Hu S, Wang X, Bhattacharjee A, Avinash K. Phonon Spectrum in a Plasma Crystal. Phys Rev Lett (2002) 89(3):035001. doi:10.1103/PhysRevLett.89.035001
33. Nunomura S, Samsonov D, Goree J. Transverse Waves in a Two-Dimensional Screened-Coulomb Crystal (Dusty Plasma). Phys Rev Lett (2000) 84(22):5141–4. doi:10.1103/PhysRevLett.84.5141
34. Petrov OF, Vaulina OS, Fortov VE, Molotkov VI, Lipaev AM, Chernyshev AV, et al. Transport of Microparticles in Weakly Ionized Gas-Discharge Plasmas under Microgravity. Microgravity - Sci Tech (2005) 16(1):311–6. doi:10.1007/BF02945997
35. Pieper JB, Goree J, Quinn RA. Experimental Studies of Two-Dimensional and Three-Dimensional Structure in a Crystallized Dusty Plasma. J Vac Sci Technol A (1996) 14(2):519–24. doi:10.1116/1.580118
36. Qiao K, Hyde TW. Structural Phase Transitions and Out-Of-Plane Dust Lattice Instabilities in Vertically Confined Plasma Crystals. Phys Rev E (2005) 71(2):026406. doi:10.1103/PhysRevE.71.026406
37. Quinn RA, Cui C, Goree J, Pieper JB, Thomas H, Morfill GE. Structural Analysis of a Coulomb Lattice in a Dusty Plasma. Phys Rev E (1996) 53(3):R2049–R52. doi:10.1103/PhysRevE.53.R2049
38. Williams JD, Thomas E, Couëdel L, Ivlev AV, Zhdanov SK, Nosenko V, et al. Kinetics of the Melting Front in Two-Dimensional Plasma Crystals: Complementary Analysis with the Particle Image and Particle Tracking Velocimetries. Phys Rev E (2012) 86(4):046401. doi:10.1103/PhysRevE.86.046401
39. Zhdanov SK, Nosenko V, Thomas HM, Morfill GE, Couëdel L. Observation of Particle Pairing in a Two-Dimensional Plasma crystal. Phys Rev E (2014) 89(2):023103. doi:10.1103/PhysRevE.89.023103
40. Zhdanov SK, Thoma MH, Morfill GE. Spontaneous Disordering of a Two-Dimensional (2D) Plasma crystal. New J Phys (2011) 13(1):013039. doi:10.1088/1367-2630/13/1/013039
41. Chaubey N, Goree J, Lanham SJ, Kushner MJ. Positive Charging of Grains in an Afterglow Plasma Is Enhanced by Ions Drifting in an Electric Field. Phys Plasmas (2021) 28(10):103702. doi:10.1063/5.0069141
42. Chen X, Hogan CJ. Nanoparticle Dynamics in the Spatial Afterglows of Nonthermal Plasma Synthesis Reactors. Chem Eng J (2021) 411:128383. doi:10.1016/j.cej.2020.128383
43. Chen X, Seto T, Kortshagen UR, Hogan CJ. Size and Structural Characterization of Si Nanocrystal Aggregates from a Low Pressure Nonthermal Plasma Reactor. Powder Tech (2020) 373:164–73. doi:10.1016/j.powtec.2020.06.026
44. Denysenko IB, Mikikian M, Azarenkov NA. Dust Dynamics during the Plasma Afterglow. J Phys D: Appl Phys (2021) 55(9):095201. doi:10.1088/1361-6463/ac3539
45. Denysenko IB, Stefanović I, Azarenkov NA, Burmaka GP. Effect of Secondary Emission on the Argon Plasma Afterglow with Large Dust Density. Phys Plasmas (2015) 22(2):023702. doi:10.1063/1.4907225
46. Denysenko IB, Stefanović I, Sikimić B, Winter J, Azarenkov NA. Discharging of Dust Particles in the Afterglow of Plasma with Large Dust Density. Phys Rev E (2013) 88(2):023104. doi:10.1103/PhysRevE.88.023104
47. Dhawan S, Vidwans A, Sharma G, Abuyazid NH, Mohan Sankaran R, Biswas P. Enhancing Charging and Capture Efficiency of Aerosol Nanoparticles Using an Atmospheric-Pressure, Flow-Through RF Plasma with a Downstream DC Bias. Aerosol Sci Tech (2020) 54(11):1249–54. doi:10.1080/02786826.2020.1807459
48. Husmann E, Thimsen E, Chen X. Particle Charge Distributions in the Effluent of a Flow-Through Atmospheric Pressure Low Temperature Plasma. Plasma Sourc Sci Tech (2021) 30(7):075030. doi:10.1088/1361-6595/ac12c1
49. Ivlev AV, Kretschmer M, Zuzic M, Morfill GE, Rothermel H, Thomas HM, et al. Decharging of Complex Plasmas: First Kinetic Observations. Phys Rev Lett (2003) 90(5):055003. doi:10.1103/PhysRevLett.90.055003
50. Merlino RL, Meyer JK, Avinash K, Sen A. Coulomb Fission of a Dusty Plasma. Phys Plasmas (2016) 23(6):064506. doi:10.1063/1.4954906
51. Saxena V, Avinash K, Sen A. Dust Cluster Explosion. Phys Plasmas (2012) 19(9):093706. doi:10.1063/1.4754010
52. Schneider V, Kersten H. An Optical Trapping System for Particle Probes in Plasma Diagnostics. Rev Sci Instrum (2018) 89(10):103505. doi:10.1063/1.5051065
53. Schweigert IV, Alexandrov AL. Effect of Nanoparticles on an Rf Discharge Afterglow. J Phys D: Appl Phys (2012) 45(32):325201. doi:10.1088/0022-3727/45/32/325201
54. Sharma G, Abuyazid N, Dhawan S, Kshirsagar S, Sankaran RM, Biswas P. Characterization of Particle Charging in Low-Temperature, Atmospheric-Pressure, Flow-Through Plasmas. J Phys D: Appl Phys (2020) 53(24):245204. doi:10.1088/1361-6463/ab7c97
55. Suresh V, Li L, Go Felipe RJ, Gopalakrishnan R. Modeling Nanoparticle Charge Distribution in the Afterglow of Non-thermal Plasmas and Comparison with Measurements. J Phys D: Appl Phys (2021) 54(27):275205. doi:10.1088/1361-6463/abf70c
56. Winter J, Berndt J, Hong SH, Kovačević E, Stefanović I, Stepanović O. Dust Formation in Ar/CH4 and Ar/C2H2 Plasmas. Plasma Sourc Sci Tech (2009) 18(3):034010. doi:10.1088/0963-0252/18/3/034010
57. Wörner L, Ivlev AV, Couëdel L, Huber P, Schwabe M, Hagl T, et al. The Effect of a Direct Current Field on the Microparticle Charge in the Plasma Afterglow. Phys Plasmas (2013) 20(12):123702. doi:10.1063/1.4843855
58. Couëdel L, Samarian AA, Mikikian M, Boufendi L. Dust Density Effect on Complex Plasma Decay. Phys Lett A (2008) 372(32):5336–9. doi:10.1016/j.physleta.2008.06.047
59. Couëdel L, Mikikian M, Boufendi L, Samarian AA. Residual Dust Charges in Discharge Afterglow. Phys Rev E (2006) 74(2):026403. doi:10.1103/PhysRevE.74.026403
60. Couëdel L, Samarian AA, Mikikian M, Boufendi L. Influence of the Ambipolar-to-free Diffusion Transition on Dust Particle Charge in a Complex Plasma Afterglow. Phys Plasmas (2008) 15(6):063705. doi:10.1063/1.2938387
61. Couëdel L, Mezeghrane A, Samarian AA, Mikikian M, Tessier Y, Cavarroc M, et al. Complex Plasma Afterglow. Contrib Plasm Phys (2009) 49(4-5):235–59. doi:10.1002/ctpp.200910025
62. van Minderhout B, Peijnenburg T, Blom P, Vogels JM, Kroesen GMW, Beckers J. The Charge of Micro-particles in a Low Pressure Spatial Plasma Afterglow. J Phys D: Appl Phys (2019) 52(32):32LT03. doi:10.1088/1361-6463/ab2525
63. van Minderhout B, van Huijstee JCA, Peijnenburg ATA, Blom P, Kroesen GMW, Beckers J. Charge Neutralisation of Microparticles by Pulsing a Low-Pressure Shielded Spatial Plasma Afterglow. Plasma Sourc Sci Tech (2021) 30(4):045016. doi:10.1088/1361-6595/abd81f
64. van Minderhout B, van Huijstee JCA, Platier B, Peijnenburg T, Blom P, Kroesen GMW, et al. Charge Control of Micro-particles in a Shielded Plasma Afterglow. Plasma Sourc Sci Tech (2020) 29(6):065005. doi:10.1088/1361-6595/ab8e4f
65. van Minderhout B, van Huijstee JCA, Rompelberg RMH, Post A, Peijnenburg ATA, Blom P, et al. Charge of Clustered Microparticles Measured in Spatial Plasma Afterglows Follows the Smallest Enclosing Sphere Model. Nat Commun (2021) 12(1):4692. doi:10.1038/s41467-021-23604-z
66. Barkan A, Merlino RL. Confinement of Dust Particles in a Double-Layer. Phys Plasmas (1995) 2(9):3261–5. doi:10.1063/1.871159
67. Schneider V. Optisch gefangene Mikropartikel als Sonden in einem Hochfrequenz-Niederdruckplasma. Kiel: University of Kiel (2020). [Ph.D. thesis].
68.Purchased from Microparticles. Purchased from Microparticles GmbH 9A, D-12489. Berlin, Germany (2015), Available at: http://www.microparticles.de/ (Accessed 2015).
69. Peeters FM, Wu X. Wigner crystal of a Screened-Coulomb-Interaction Colloidal System in Two Dimensions. Phys Rev A (1987) 35(7):3109–14. doi:10.1103/PhysRevA.35.3109
70. Rasband WS. ImageJ. Bethesda, Maryland, USA: U. S. National Institutes of Health (2020). Available at: https://imagej.nih.gov/ij/ (Accessed 2020).
71. Feng Y, Goree J, Liu B. Accurate Particle Position Measurement from Images. Rev Sci Instrum (2007) 78(5):053704. doi:10.1063/1.2735920
72. Glaser MA, Clark NA. Statistical Geometry of Simple Liquids in 2 Dimensions. Phys Rev A (1990) 41(8):4585–8. doi:10.1103/PhysRevA.41.4585
73. Quinn RA, Goree J. Experimental Test of Two-Dimensional Melting through Disclination Unbinding. Phys Rev E (2001) 64(5):051404. doi:10.1103/PhysRevE.64.051404
74. Lai Y-JIL. Defects and Particle Motions in the Nonuniform Melting of a Two-Dimensional Coulomb Cluster. Phys Rev E (2001) 64(1):015601. doi:10.1103/PhysRevE.64.015601
75. Liu B, Goree J, Vaulina OS. Test of the Stokes-Einstein Relation in a Two-Dimensional Yukawa Liquid. Phys Rev Lett (2006) 96(1):015005. doi:10.1103/PhysRevLett.96.015005
76. Su Y-S, Liu Y-H. Correlating Structural Order with Structural Rearrangement in Dusty Plasma Liquids: Can Structural Rearrangement Be Predicted by Static Structural Information? Phys Rev Lett (2012) 109(19):195002. doi:10.1103/PhysRevLett.109.195002
77. Smith B, Hyde T, Matthews L, Reay J, Cook M, Schmoke J. Phase Transitions in a Dusty Plasma with Two Distinct Particle Sizes. Adv Space Res (2008) 41(9):1510–3. doi:10.1016/j.asr.2008.01.006
Keywords: dusty plasma, complex plasma, strongly coupled plasma, crystalline structure, afterglow plasma, microspheres, bounce, charging
Citation: Chaubey N and Goree J (2022) Preservation of a Dust Crystal as it Falls in an Afterglow Plasma. Front. Phys. 10:879092. doi: 10.3389/fphy.2022.879092
Received: 18 February 2022; Accepted: 06 May 2022;
Published: 20 May 2022.
Edited by:
Sergey Khrapak, German Aerospace Center (DLR), GermanyReviewed by:
Chengxun Yuan, Harbin Institute of Technology, ChinaCopyright © 2022 Chaubey and Goree. This is an open-access article distributed under the terms of the Creative Commons Attribution License (CC BY). The use, distribution or reproduction in other forums is permitted, provided the original author(s) and the copyright owner(s) are credited and that the original publication in this journal is cited, in accordance with accepted academic practice. No use, distribution or reproduction is permitted which does not comply with these terms.
*Correspondence: Neeraj Chaubey, bmVlcmFqLWNoYXViZXlAdWlvd2EuZWR1
Disclaimer: All claims expressed in this article are solely those of the authors and do not necessarily represent those of their affiliated organizations, or those of the publisher, the editors and the reviewers. Any product that may be evaluated in this article or claim that may be made by its manufacturer is not guaranteed or endorsed by the publisher.
Research integrity at Frontiers

Learn more about the work of our research integrity team to safeguard the quality of each article we publish.