- 1Jülich Centre for Neutron Science (JCNS) at Heinz Maier-Leibnitz Zentrum (MLZ), Forschungszentrum Jülich GmbH, Garching, Germany
- 2Institut Laue-Langevin (ILL), Grenoble, France
- 3Jülich Centre for Neutron Science (JCNS-1 / IBI-8), Forschungszentrum Jülich GmbH, Jülich, Germany
We report on the structure and diffusion behaviour of the various constituent molecules in ionic liquid (IL) mixtures under confinement in nanoporous glasses. X-Ray diffraction measurements indicate that the ions adopt a lamellar arrangement under confinement. Furthermore, using selective deuteration in combination with high resolution neutron spectroscopy reveals how the dynamics and the activation energy of the IL is affected by different confinement conditions (pore sizes 50 Å and 135 Å) and different temperatures (265 and 318 K). With different deuteration schemes we could separate the different motions of acetate and water. The confinement leads to distortions of the domains, which gives more room for diffusion. In the smaller pores, the stronger distortion gives even more room such that the hydrogen bonds between acetate and water seem to be even stronger than in bulk and weaker confinement. The results are discussed in the context of previous measurements on dry samples.
1 Introduction
Ionic liquids (ILs) are salts found in the liquid state at temperatures below 100°C. As a result of their unique set of physico-chemical properties, combining good thermal and chemical stability, non-flammability, as well as low volatility and low vapor pressure, ILs have found numerous potential applications for example as ‘green’ solvents and catalysts [1–4]. ILs still liquid at room temperature are especially important for applications and are therefore often further distinguished from the broader definition of ILs above as room temperature ILs (RTILs) [5].
A further important application of ILs, of particular relevance to this study, is their use as electrolytes in the proton-exchange membrane (PEM) of fuel cells [6]. In the PEM, the electrolyte is both spatially confined at the nanometre scale and in contact with water. Furthermore the water contents varies during operation due to a continuous production of water at the electrodes and contributes to the performance of the PEM in terms of conductivity. The fundamental importance of the PEM to the operation of fuel cells has prompted a number of studies into the properties of IL/water mixtures and the behaviour ILs confined in porous materials. These systems have been investigated using a broad range of experimental and computational techniques, including quasielastic neutron scattering (QENS) [7–11], nuclear magnetic resonance (NMR) [7,10,12], and molecular dynamics simulations (MD) [13].
IL-water mixture has wide range of applications in bioengineering, bioenergy, green energy and electrical advancements. The addition of water, a less viscous solvent, in ILs results in enhanced electrical performance [14]. IL-water mixture has potential application for improved polymer dissolution [15], and starch disintegration [16]. Furthermore, IL-water mixture has also shown prospects in biomass pretreatment for biofuel [17]. The IL-water mixture can be used as an electrolyte for dye sensitive solar cells [18]. These mixture has also shown promising results in electrodeposition of zinc films [19]. Therefore, study of IL-water mixture is of great fundamental interest.
Although there are conflicting reports in the literature as to whether confinement increases or decreases the mobility of ions in the IL, reports of faster ion diffusion under confinement conditions appear to prevail. Busch et al. [9], for example, used QENS to investigate the behaviour of an IL in porous carbon (pore size ∼ 0.6–11 nm). Although the authors observed a confinement-induced decrease of the molecular mobility, they also reported an advantageous extension of the temperature range of the liquid state of the confined IL down to low temperatures when compared to the bulk IL. Conversely, using QENS and NMR, Berrod et al. [10] showed that confinement in 1D carbon nanotubes of 4 nm diameter enhances the ion mobility in an IL. Furthermore, the authors hypothesised that this effect would increase with decreasing nanotube diameter and that electrolyte confinement would allow the development of new batteries operating at lower temperatures. Similarly, separate QENS experiments [11,20] on an IL confined in carbon pores with a diameter of 9 nm also demonstrated an enhanced diffusivity of cations at lower temperatures compared to bulk. In parallel, the dc-conductivity levels may be elevated [21].
A wider perspective about confined IL termed “ionogels” is motivated in the review by Singh et al. [5] in terms of supercapacitors, fuel cells, drug delivery, biosensors and catalysis. The confinement is stronger inside the pores compared to the outside of colloidal particles [22] and the interaction of the cation with the usually negatively charged surface is stronger. There may be near-surface regions of the IL that shows confinement and bulk-like regions [23]. In stronger confinement, the IL can undergo a a liquid to solid-like transition [24]. The solid-liquid interaction can raise the phase transition temperature and increase thermal stability [25], but also favor the liquid-like behavior [26].
With regards to the presence of water in ILs, the situation is somewhat more coherent. It is known that the hydrogen bond network in ILs plays a vital role in defining the microscopic diffusivity and native structure of ILs. As many ILs are hygroscopic in nature, the accumulation of water molecules in the IL can alter the native hydrogen bond environment and may lead to changes in the properties of the material. Indeed, MD simulations carried out by Zhou et al. [13], suggested that the presence of water molecules in an IL results in the formation of hydrogen bonds between the water and the anions while weakening of hydrogen bonds between cations and anions. This, in turn, leads to a change in the physicochemical properties of the IL for electrolyte applications. These changes to the hydrogen bonding network may also cause an increase in the viscosity at very low water content while at higher water content, the viscosity decreases. These findings are supported by Lengvinaitė et al. [12], who investigated the structure of the IL with varying amounts of water via NMR. It was observed that the water forms hydrogen-bonded aggregates with the anions and that these aggregates surround the imidazolium ring cations. At this stage, the ideal water content for optimum ion mobility whilst avoiding excessive dilution remains an open question. Finally, using both QENS and NMR, Lin et al. [7] uncovered proton hopping and cooperative motions in IL-water mixtures that are expected to enhance the conductivity, thus making highly acidic ILs suitable as electrolytes for fuel cells operating at elevated temperatures. The range of water content looked at in this study lies between 0 and 6%wt which approximately marks the range of interest for electrolyte applications.
Although there are many studies addressing the effects of nanoscale confinement and the presence of water on the properties of ILs separately, to the authors’ knowledge, no work has been conducted on the diffusion dynamics of confined IL/water mixtures - an omission this work aims to address using neutron spin-echo spectroscopy (NSE). Neutron scattering techniques are particularly well-suited to studying the structure and dynamics of liquids and soft matter samples for a number of reasons. Firstly, they allow for the manipulation of contrast conditions (i.e. selective deuteration). Secondly, the wavelengths and energies correspond to length scales and energies involved in macromolecular motion in liquid samples. Finally, neutrons can penetrate thick samples and hence probe microscopic properties averaged over the whole sample.
We present an investigation into the mixture of the IL 1-ethyl-3-methylimidazolium acetate (EmimAc) with 33%mol of water confined within the mesopores of two glass matrices with pore diameters of 50 Å and 135 Å (Figure 1). The nanosecond dynamics of the anions and water, as well as the arrangement of ions in the mixture, were probed by NSE and XRD.The results obtained here were compared to our previous work on pure EmimAc under the same confinement conditions and in bulk, as observed by QENS and XRD. Our experimental research aims to clarify the impact of confinement and the presence of water on ILs by probing their physical properties using spectroscopic techniques. Specifically, we have used high-resolution neutron spin-echo spectroscopy allowing us to probe the nanosecond diffusion of Ångström-sized molecules.
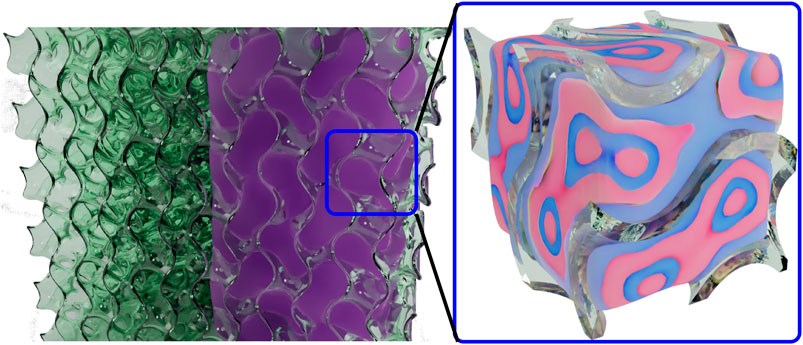
FIGURE 1. Sketch of the system under investigation. The porous glass (left) is filled with IL (right part of the porous glass), which tends to be structured inside the pores in a lamellar fashion (zoom into the filled porous glass).
2 Materials and Methods
2.1 Sample Preparation
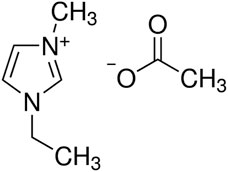
For the NSE measurements, deuterated IL 1-ethyl-3-methylimidazolium acetate (EmimAc) (see Figure 2) was synthesized in our labs. The imidazolium ion contained eight deuterium and three hydrogen atoms and the acetate was either fully protonated or fully deuterated. Acetic acid was purchased from Armar chemicals (Döttingen, CH). Details on the synthesis can be found in Viell et al. [27]. For the XRD measurements, hydrogenous EmimAc (Sigma Aldrich, lot no. BCBR8370V, 97% purity, and for conductivity measurements lot no. BCBQ2109V) was dried at 100 °C under vacuum prior to mixing with water. This was done to ensure that the water content was accurate and not affected by moisture already present in the sample.
D2O and H2O were added to the synthesized EmimAc in the molar ratio of 1:2 (5.0 wt% water with respect to hydrogenous materials). The mixtures were Emim(D8H3)Ac(H3)+D2O (further called ILD8/D2O) and Emim(D8H3)Ac(D3)+H2O (further called ILD11/H2O). In terms of the neutron scattering length density, it is important to bear in mind that the water dissociates in the sample and the hydrogen/deuterium ions will continuously exchange with the hydrogen/deuterium on the acetic acid and the hydrogen atom at the nitrogen of the imidazolium.
The mixtures were confined in two types of porous glass, Varapor-100 (VP) and AGC-40 (AGC), both purchased from the Advanced Glass and Ceramics company (www.porousglass.com). We relied on these two commercial glasses due to the producers expertise, and are aware about the differences in chemical composition (better than 99% SiO2 for VP and 95% SiO2/5% B2O3 for AGC). Due to the negative charge of the surface (−0.77 Cm−2) the first layer would be dominated by cations and hydrogen bonding to the walls should play a minor role. For the XRD experiment, a plate thickness of 0.5 mm and a diameter of 14 mm were used. For the NSE experiments, the thickness was 2 mm and the diameter 30 mm. The VP glass has a pore diameter of 135 Å and the AGC glass has a pore diameter of 50 Å as determined by gas adsorption measurements by the producer. More details on the glass properties can be found in Ref. [8]. The scattering length densities (SLDs) of the materials used are listed in Table 1.
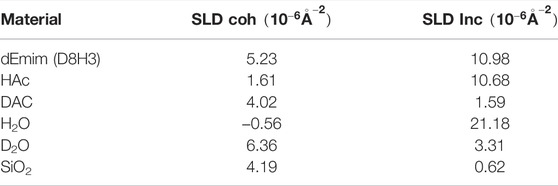
TABLE 1. Samples used in this study and corresponding scattering length densities, assuming a density of 1.027 g/cm3 for EmimAc and 2.65 g/cm3 for the solid phase of the porous glass. SLDs were calculated with Calculator [28].
2.2 X-Ray Diffraction
X-ray diffraction (XRD) was performed on a Bruker D2 phaser with a copper Kα source (λ = 1.541 Å, operated at 30 kV, 10 mA). The incident beam was collimated to 0.1° divergence. The angular 2θ-scan ran from 4° to 60° in 0.1° steps. The shading characteristics of the beam stop from the rather flat scattering of the pure IL have been used to correct the scattering at smallest angles. The background of the glass and the silicon sample holder have been carefully subtracted using calculated transmissions in all cases. We finally present scattering intensities as a function of the scattering vector Q.
2.3 Neutron Spin-Echo Spectroscopy
Neutron spin-echo spectroscopy (NSE) is the techique with the highest energy resolution in neutron spectroscopy. In NSE measurements, the velocity changes of the neutrons as they interact with the sample are encoded as perturbations in the final spin polarization. When analysed and processed, these perturbations can be used to calculate the normalised intermediate scattering function S(Q, t)/S(Q, t = 0) with a time resolution in the ns domain and a sub μeV energy resolution. The intermediate scattering function (ISF) is equivalent to the Fourier transform of the Van Hove correlation function. For more experimental details, we refer to the literature, e.g. the recent papers on different NSE instrument developments [29–31].
NSE measurements were carried out on the wide-angle spin-echo spectrometer (WASP) at the ILL in Grenoble (with the repository of rawdata available at Frielinghaus et al. [32]). The normalized intermediate scattering functions S(Q, t)/S(Q, 0) were analyzed in the momentum transfer range of Q = 0.2 Å-1–0.7 Å-1 using neutron wavelengths of 7 Å, exploring a Fourier time window of τNSE = 0.004–7 ns.
All samples were measured at three temperatures, around the glass transition temperature at 268 K, at the melting of the crystalline phase at 318 K and in the fluid phase at 368 K. Differential scanning calorimetry (DSC) measurements of the pure IL have been presented in Noferini et al. [8].
2.4 Data Analysis
As mentioned in the previous section, NSE experiments yield a normalised intermediate scattering function, S(Q, t)/S(Q, 0), at a given scattering vector, Q. This is the Fourier transform of the van Hove correlation function from real space to reciprocal space, or alternatively, the Fourier transform of the scattering function S(Q, ω) from the energy to the time domain. In systems where there are multiple contributions to the correlation function, it is critical that each contribution be described correctly. In this system, the contributions were identified and described as follows:
1. An elastic contribution arises from porous glass, which is coherent and constant in time:
2. At low Q, additional coherent small-angle scattering from the IL is expected, which relaxes with relaxation time t0:
3. At intermediate Q, well below the structure-factor peak of the correlations of the IL, a spin-incoherent contribution from the protons of the IL is expected. This contribution is phase shifted by 180° (negative echo amplitude in the NSE experiment) with relaxation time t1:
4. At high Q, a coherent, very slow or elastic contribution arises due to the correlation peak of the IL and the associated “de Gennes narrowing” or critical slowing down of the dynamics. There may also be a contribution from the elastic incoherent structure factor (EISF) of the protons which are “immobile” on the observed length- and time-scales:
At higher Q, additional coherent elastic contributions may arise due to the atomic correlations in the porous glass and the IL at the structure-factor peak. In diffraction measurements, this is typically observed as a broad amorphous peak at 1.5 Å−1. This contribution is not considered here as the correlation peaks are beyond the NSE Q-window investigated in this experiment and any effects would be negligible compared to the contributions outlined above.
NSE data are normalized to the difference in intensity in spin up configuration (all spin flippers off) and the intensity with the spin flipped in opposite direction by the π-flipper, which normally denotes the maximum and minimum of coherent intensity respectively. For incoherent scattering, both intensity levels are inverted due to the inherent π-flip to −1/3 of the incoherently scattered neutrons. The combination presented here between coherent and incoherent, as well as static and dynamic scattering, can lead to curves where the normalization mechanism is not straight forward. Therefore the data have been fitted with a generic fit function
with the elastic background level, A0, the amplitude, A1, of the dynamic contribution, and a relaxation time, t1. The relaxation time of the mobile part of the sample can be determined in this way rather clearly despite the ill-defined contrasts, as we will demonstrate with the analysis of the Arrhenius plots. This function would also fit coherent and incoherent scattering (with adjusted sign of the amplitudes). In the next section, the focus is set to the Q-region where incoherent scattering dominates, with the correct normalization leading to the expected decay of S(Q, t) starting at 1.
3 Results
The XRD measurements are summarized in Figure 3. For each confinement condition (i.e. bulk, VP and AGC), we compare the anhydrous IL with the IL/water mixture. We can state that in all cases, the addition of 0.5 M equivalents of water causes the correlation peak to narrow slightly with respect to the peak observed for the anhydrous IL.
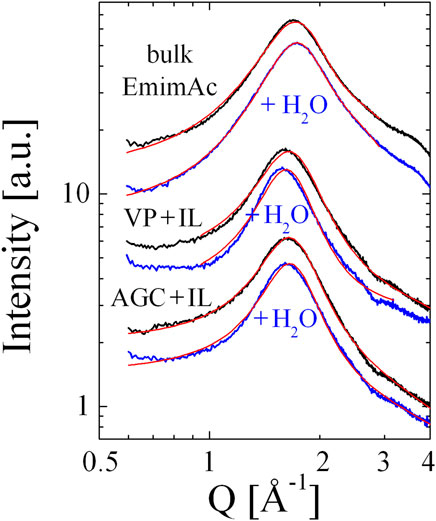
FIGURE 3. The XRD scattering intensities as a function of the scattering vector, Q. The anhydrous IL (black) and the IL-water mixture (blue) in bulk and in confinement (VP and AGC glass matrices). The red lines represent the non-linear least-squares fits of the data to the appropriate model.
We have described all correlation peaks using well-known formulas as given, for example, in Noferini et al. [8]. The correlation peak in the bulk systems can be described by a Teubner-Strey function Teubner and Strey [33], originally developed for bicontinuous microemulsions, that has been extended to include an additional surface term that accounts for fluctuations on short length scales [34]. The final formula reads:
The confined fluids were described by two Lorentzians following the simplifications of Nallet et al. [35]. We finally used the parameterization as given in our previous work Noferini et al. [8] where we also showed that the bulk IL seems to have a sponge-like domain structure and the confined IL, an onion-ring-like, ordered structure. The scattering formula for the ordered structure is given by:
The common parameters of the two models are k0 for the wavevector of the domain spacing and ξ for the corresponding correlation length. These parameters form the focus of our description and are listed in Table 2. We also have an additional parameter, Rg, that describes the short-range fluctuations on the surface of the domains (of radius Rg) [34]. For the ordered system, a long-range correlation length, ξ0, is included [35]. In all cases, we have an amplitude ratio between the long-range and the short-range expressions, i.e. A/B and C0/C1, as described in [8].

TABLE 2. The parameters of the fits to the XRD scattering curves from Figure 3, using the models described in Noferini et al. [8]. The errors of k0 are less than 1%, of ξ are less than 2%, of the additional length scale are less than 4%, and of the amplitude ratios are less than 2%.
The resulting repeat distance in the IL is about 3.8 Å that matches with the smaller dimensions of the bare molecules (Figure 2, π-stacking may be still possible along the domains). Compared to the pore sizes of 135 Å and 50 Å, there are 36 and 13 double layers of this arrangement within the pores.
The important results of the XRD measurements can be summarised as follows: 1) we have a sponge-like structure in the bulk and an onion-like structure for the confined IL. 2) When adding 0.5 M equivalents of water, in all cases the correlation length ξ increases, while the domain spacing (i.e. k0) remains approximately unchanged. The slight deviations with respect to our previous work [8] can be ascribed to an optimised sample preparation protocol (e.g. the drying of all IL samples) and a more careful background subtraction.
Since the structure of the IL changes upon heating [8] and the fragile porous glass plates are enclosed in an aluminium sample holder with some ample space, we observed some small hysteresis effects concerning the overall intensity, which drops upon heating and does not fully recover.
The NSE experiments were conducted at temperatures 268 K (-5 °C), 318 K (45 °C) and 368 K (95 °C) in ascending order. In order to ensure reliability and investigate the presence of a possible temperature dependent effects, each sample was measured three times at each temperature. The data at 368 K showed significant drift in intensity compared to the lower temperatures and for the IL11/H2O-VP sample this drift was also observed during the three three consecutive runs at 368 K, this temperature was therefore excluded from further analysis. The corresponding intensity and polarization plots can be found in the Supplementary Information (SI). Also the repetition of the 318 K experiment after heating to 368 K did not reproduce the first cycle.
The polarized and unpolarized scattering intensities are shown in Figure 4. The region from 0.2–0.7 Å−1 is dominated by incoherent scattering (negative polarization). We will focus on this region for the analysis of the NSE data. At higher Q, when approaching the correlation peak as seen in the XRD data, coherent scattering dominates, but with a Q-range which is not sufficient in this case for a Q-dependent analysis, since coherent slow dynamics and incoherent dynamics must be separable in this region.
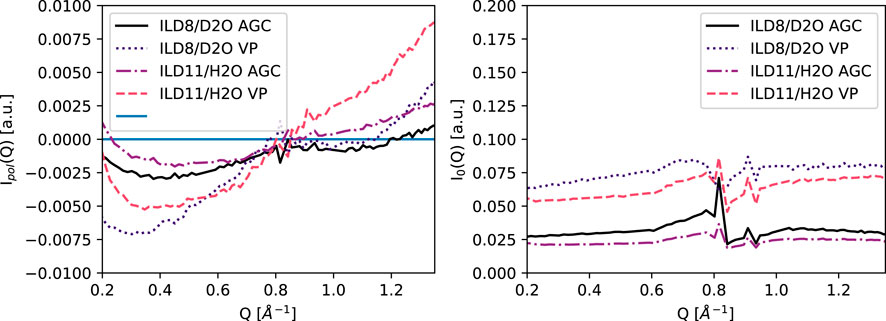
FIGURE 4. Measured polarized intensity (Up-Down)/2 and average intensities (Up + Down)/2 at 265 K, normalized to the TiZr reference sample.
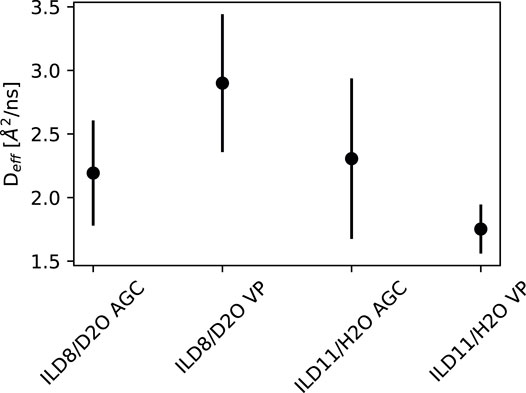
The intermediate scattering functions S(Q, t) of the four samples at Q = 0.6 Å−1 and temperatures of 268 and 318 K are shown in Figure 5. The solid lines show the fits to Equation (5) with fitted amplitudes A0 and A1 to account for possible effects of coherent elastic scattering or faster (fully inelastic) contributions outside of the NSE time window. From the relaxation time t1, a diffusion constant D can be inferred from 1/t1 = DQ2, which is shown in Figure 6.
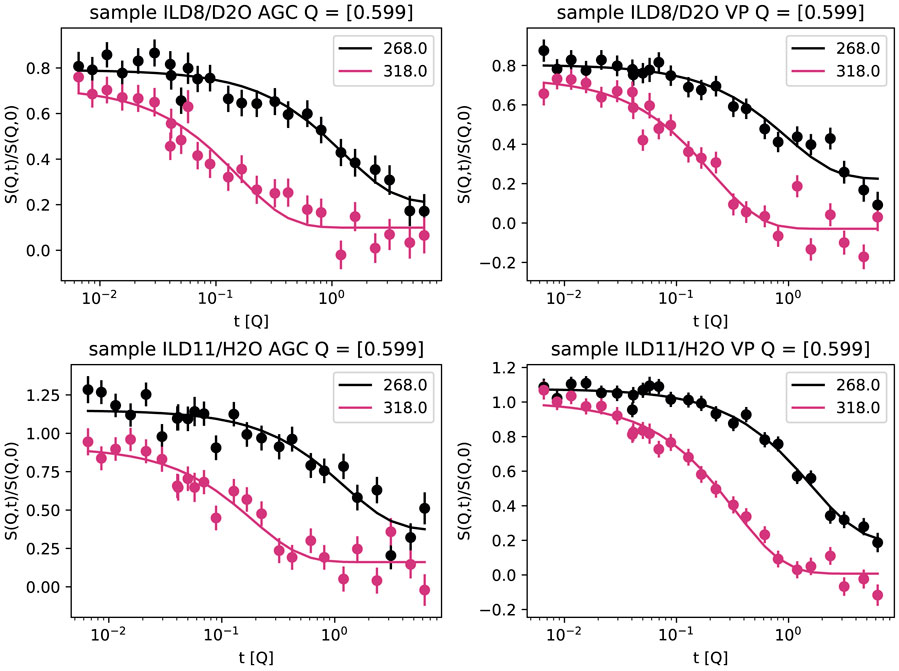
FIGURE 5. Normalised intermediate scattering function S(Q, t)/S(Q, | 0) at Q = | 0.6 Å−1 and two temperatures (265 K, 318 K) for ILD8/D2O (top) and ILD11/H2O (bottom) confined in AGC (left) and VP (right).
Activation energies were obtained from the Arrhenius plots of the diffusion constant, D, determined from the relaxation rate, 1/τ1, with D = 1/(τ1Q2), versus the inverse temperature T. The Arrhenius plot is presented in the SI. The SI also show the data for 368 K for IDL8/D2O in AGC and VP confinement which is in good agreement with the activation energy obtained from the lower two temperatures.
The Q-dependence of the activation energies obtained from the Arrhenius fit of ln(D) vs 1/T is presented in Figure 7. The approximately constant value indicates that we observe the same process (or processes) at all length scales accessible within this experiment.
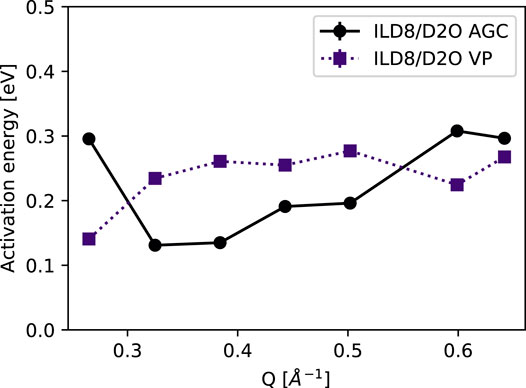
FIGURE 7. Activation energy as a function of scattering vector Q for the samples ILD8/D2O, where the higher temperature could be exploited. The statistical errors from the variance of the data are 0.08 and 0.05 eV for AGC and VP samples respectively.
The conductivity of the bulk IL mixtures has been measured as a function of the water content (Figure 8). Within errors, the conductivity increases monotonically with increasing water content. This is an expected behavior for relatively small water contents [20,36]. This behavior expresses a higher mobility of the charge carriers with increasing water content.
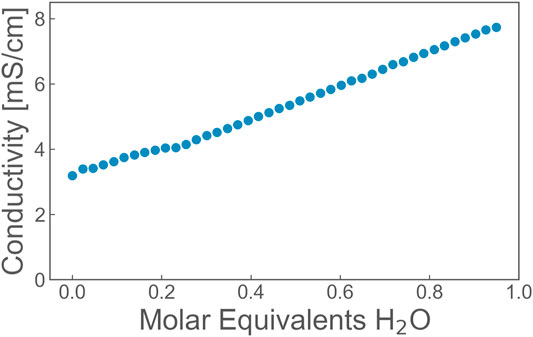
FIGURE 8. The conductivity of bulk EmimAc with molar equivalents of water. Within errors (of symbol size), the conductivity increases monotonically.
4 Discussion
Below Q = 0.7 Å−1, incoherent scattering dominates, as discussed and shown in Figure 4. Since the data reduction requires dividing the echo amplitude by the polarization the region around the zero crossing of polarization can not be properly analysed. The structure factor peak of the IL is at sufficiently high Q (Figure 3), where it contributes with a coherent signal. In the SI the relation of coherent and incoherent scattering is visualized with scattering intensities calculated with the model obtained from XRD.
The relaxation rates deduced from the relaxation times at 268 and 318 K are very consistent, resulting in an Arrhenius-like behaviour in the Q-region with predominantly incoherent scattering, where only the H self correlation is observed.
Diffusion constants at 265 K for the four samples do not show a strong variation with contrast or variation of confinement, as shown in Figure 6. The investigated Q-range did not allow for applying jump diffusion models and obtaining a second parameter such as the residence time or jump length from the Q-dependence. The diffusion constant of approx. Two Å2/ns is also very similar to that observed in the pure IL in confinement in Ref. [8], which lies between one to two Å2/ns.
The activation energies are displayed in Figure 9. There is a clear decrease in the activation energy from the bulk to the confined samples. This was previously interpreted [8] as resulting from a distortion of the domain structure that may lead to a slightly lower density, which in turn gives more space for diffusion. The trends between the different degrees of confinement and between the anhydrous and water-containing samples are less clear-cut, particularly considering the statistical errors. However, it appears that the ILD8/D2O sample confined in the VP material (pore size: 135 Å) exhibits more mobility of the acetate ion due to the water addition. When highlighting the water in the ILD11/H2O sample, even more mobility is found. This would be explained by the possible proton exchange and the smaller size of H2O compared to the acetate. In the smaller pores of the AGC material (50 Å), this trend is reversed. In the context of distorted domains, discussed above, this finding could be interpreted as tighter hydrogen bonds between acetate and water. The smallness of both trends in VP and AGC leaves us with the interpretation that although the strength of the hydrogen bond may vary, it is still strong enough in either case that the motion of acetate and water are not completely decoupled.
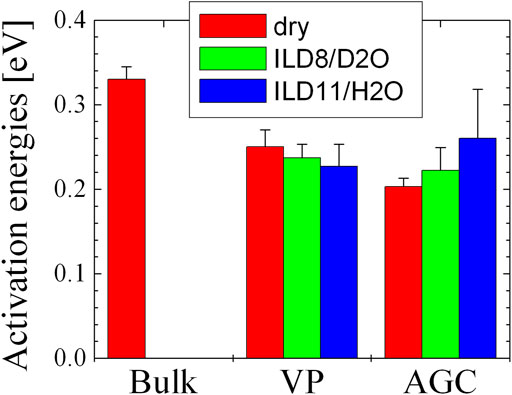
FIGURE 9. The activation energies from Noferini et al. [8] and the current work.
When comparing this finding with conductivity measurements (Figure 8, measured on the conductometer HL-200 from SI Analytics), the mobility of charge carriers increases with increasing water content for the bulk (Figure 8) and for the lower confinement in VP (Figure 9, conductivity could not be measured here because of commercially unavailable electrode geometries). Controversial is the finding for AGC glass with higher confinement, where the hydrogen bonding becomes stronger. However, all observed changes stay at a rather small level because in every case the acetate and water stay rather bonded on the molecular level and cannot move extremely independent. The focus on the acetate ion and water for this comparison is justified because the smaller molecules contribute stronger to the overall conductivity that only may be overturned by bare proton conductivity between these two molecules.
Confined water as such induces freezing of the molecular motions near the confining surface on a layer with a thickness of 4–8 Å [38], and the water connectivity may change inside the pores [39]. Differences of the dielectric constant were calculated [40]. However, we do not observe water pockets [41], but find molecular mixtures between IL and water. Finally, the conclusion that the microscopic properties of water are influenced by the space it occupies [38] may hold in our case as well, because it is tightly connected to hydrogen bonding.
5 Conclusion
The effect of adding water to the structure and proton dynamics of ILs confined in nanoporous glasses has been studied with XRD and NSE spectroscopy. The structural analysis with XRD revealed an increase in the correlation length upon addition of small amounts of water to the IL in confinement, while the domain spacing remains unchanged within the experimental precision.
The ion dynamics in the confined EmimAc-water mixture revealed by NSE spectroscopy leads us to the conclusion that the addition of a small amount of water to EmimAc results in the formation of hydrogen bonds between water and the acetate ions on the molecular level. This scenario would imply a higher mobility of the acetate/water compound. The small changes of the activation energies are in line with the previously found distortions of the domain structure in confinement: in general the lower density would leave more room for diffusion. However, the different trends in VP and AGC with the three degrees of deuteration could be interpreted as stronger distortions in the smaller pores of AGC that would generate more room for stronger hydrogen bonds.
Future studies will increase the amount of added water to EmimAc to observe the formation of bulk water domains within the IL and investigate the impact of confinement on the mixture.
Data Availability Statement
The original contributions presented in the study are included in the article/Supplementary Materials, further inquiries can be directed to the corresponding author. Data is deposited at https://doi.org/10.26165/JUELICH-DATA/BROPEL
Author Contributions
Conception and idea from HF and OH. Synthesis and sample preparation and phase diagram measurements LF, HF. HF, OH, PFa and PFo conducted the neutron scattering experiments. Data evaluation and writing of the paper by MF, PD, DH, SJ, HF and OH.
Conflict of Interest
The authors declare that the research was conducted in the absence of any commercial or financial relationships that could be construed as a potential conflict of interest.
Publisher’s Note
All claims expressed in this article are solely those of the authors and do not necessarily represent those of their affiliated organizations, or those of the publisher, the editors and the reviewers. Any product that may be evaluated in this article, or claim that may be made by its manufacturer, is not guaranteed or endorsed by the publisher.
Acknowledgments
This work is based upon experiments performed at WASP, ILL. Granting of beam time is gratefully acknowledged.
Supplementary Material
The Supplementary Material for this article can be found online at: https://www.frontiersin.org/articles/10.3389/fphy.2022.872616/full#supplementary-material
References
3. Watanabe M, Thomas ML, Zhang S, Ueno K, Yasuda T, Dokko K. Application of Ionic Liquids to Energy Storage and Conversion Materials and Devices. Chem Rev (2017) 117:7190–239. doi:10.1021/acs.chemrev.6b00504
4. Ventura SPM, e Silva FA, Quental MV, Mondal D, Freire MG, Coutinho JAP. Ionic-liquid-mediated Extraction and Separation Processes for Bioactive Compounds: Past, Present, and Future Trends. Chem Rev (2017) 117:6984–7052. doi:10.1021/acs.chemrev.6b00550
5. Singh MP, Singh RK, Chandra S. Ionic Liquids Confined in Porous Matrices: Physicochemical Properties and Applications. Prog Mater Sci (2014) 64:73–120. doi:10.1016/j.pmatsci.2014.03.001
6. Wippermann K, Wackerl J, Lehnert W, Huber B, Korte C. 2-sulfoethylammonium Trifluoromethanesulfonate as an Ionic Liquid for High Temperature Pem Fuel Cells. J Electrochem Soc (2015) 163:F25–F37. doi:10.1149/2.0141602jes
7. Lin J, Noferini D, Veroutis E, Korte C, Holderer O. The Charge Transport Mechanism in Brønsted-Acidic Protic Ionic Liquid/water Systems - an NMR and QENS Study. J Mol Liquids (2021) 343:117712. doi:10.1016/j.molliq.2021.117712
8. Noferini D, Holderer O, Frielinghaus H. Effect of Mild Nanoscopic Confinement on the Dynamics of Ionic Liquids. Phys Chem Chem Phys (2020) 22:9046–52. doi:10.1039/c9cp05200c
9. Busch M, Hofmann T, Frick B, Embs JP, Dyatkin B, Huber P. Ionic Liquid Dynamics in Nanoporous Carbon: A Pore-Size-And Temperature-dependent Neutron Spectroscopy Study on Supercapacitor Materials. Phys Rev Mater (2020) 4:055401. doi:10.1103/physrevmaterials.4.055401
10. Berrod Q, Ferdeghini F, Judeinstein P, Genevaz N, Ramos R, Fournier A, et al. Enhanced Ionic Liquid Mobility Induced by Confinement in 1d Cnt Membranes. Nanoscale (2016) 8:7845–8. doi:10.1039/C6NR01445C
11. Chathoth SM, Mamontov E, Dai S, Wang X, Fulvio PF, Wesolowski DJ. Fast Diffusion in a Room Temperature Ionic Liquid Confined in Mesoporous Carbon. Epl (2012) 97:66004. doi:10.1209/0295-5075/97/66004
12. Lengvinaitė D, Kvedaraviciute S, Bielskutė S, Klimavicius V, Balevicius V, Mocci F, et al. Structural Features of the [c4mim][cl] Ionic Liquid and its Mixtures with Water: Insight from a 1h Nmr Experimental and Qm/md Study. J Phys Chem B (2021) 125:13255–66. doi:10.1021/acs.jpcb.1c08215
13. Zhou J, Liu X, Zhang S, Zhang X, Yu G. Effect of Small Amount of Water on the Dynamics Properties and Microstructures of Ionic Liquids. Aiche J (2017) 63:2248–56. doi:10.1002/aic.15594
14. Woodward CE, Harris KR. A Lattice-Hole Theory for Conductivity in Ionic Liquid Mixtures: Application to Ionic Liquid + Water Mixtures. Phys Chem Chem Phys (2010) 12:1172–6. doi:10.1039/b919835k
15. Wang Y, Wei L, Li K, Ma Y, Ma N, Ding S, et al. Lignin Dissolution in Dialkylimidazolium-Based Ionic Liquid-Water Mixtures. Bioresour Technol (2014) 170:499–505. doi:10.1016/j.biortech.2014.08.020
16. Sciarini LS, Rolland-Sabaté A, Guilois S, Decaen P, Leroy E, Le Bail P. Understanding the Destructuration of Starch in Water-Ionic Liquid Mixtures. Green Chem (2015) 17:291–9. doi:10.1039/c4gc01248h
17. Brandt A, Ray MJ, To TQ, Leak DJ, Murphy RJ, Welton T. Ionic Liquid Pretreatment of Lignocellulosic Biomass with Ionic Liquid-Water Mixtures. Green Chem (2011) 13:2489–99. doi:10.1039/c1gc15374a
18. Jeon J, Kim H, Goddard WA, Pascal TA, Lee G-I, Kang JK. The Role of Confined Water in Ionic Liquid Electrolytes for Dye-Sensitized Solar Cells. J Phys Chem Lett (2012) 3:556–9. doi:10.1021/jz3000036
19. Liu Z, Abedin SZE, Endres F. Electrodeposition of Zinc Films from Ionic Liquids and Ionic Liquid/water Mixtures. Electrochimica Acta (2013) 89:635–43. doi:10.1016/j.electacta.2012.11.077
20. Chathoth SM, Mamontov E, Fulvio PF, Wang X, Baker GA, Dai S, et al. An Unusual Slowdown of Fast Diffusion in a Room Temperature Ionic Liquid Confined in Mesoporous Carbon. Epl (2013) 102:16004. doi:10.1209/0295-5075/102/16004
21. Tu W, Richert R, Adrjanowicz K. Dynamics of Pyrrolidinium-Based Ionic Liquids under Confinement. I. Analysis of Dielectric Permittivity. J Phys Chem C (2020) 124:5389–94. doi:10.1021/acs.jpcc.0c00156
22. Verma YL, Singh MP, Kumar S, Dhar R, Singh RK. Behaviour of Ionic Liquid Adsorbed on the Surface of Nano Silica Particles and in Confined System of Silica Matrices. Surf Sci (2020) 701:121701. doi:10.1016/j.susc.2020.121701
23. Singh MP, Verma YL, Gupta AK, Singh RK, Chandra S. Changes in Dynamical Behavior of Ionic Liquid in Silica Nano-Pores. Ionics (2014) 20:507–16. doi:10.1007/s11581-013-1008-9
24. Borghi F, Podestà A. Ionic Liquids under Nanoscale Confinement. Adv Phys X (2020) 5:1736949. doi:10.1080/23746149.2020.1736949
25. Gupta AK, Verma YL, Singh MP, Singh RK. Role of Reduced Precursor and Solvolytic Reagent Molar Ratio on Preparation and Properties of Ionogel. J Solid State Chem (2016) 242:29–37. doi:10.1016/j.jssc.2016.07.008
26. Le Bideau J, Gaveau P, Bellayer S, Néouze M-A, Vioux A. Effect of Confinement on Ionic Liquids Dynamics in Monolithic Silica Ionogels: 1h Nmr Study. Phys Chem Chem Phys (2007) 9:5419–22. doi:10.1039/b711539c
27. Viell J, Szekely NK, Mangiapia G, Hövelmann C, Marks C, Frielinghaus H. In Operando Monitoring of wood Transformation during Pretreatment with Ionic Liquids. Cellulose (2020) 27:4889–907. doi:10.1007/s10570-020-03119-4
28. [Dataset] MLZ SLD Calculator . Transmission and Scattering Power Calculator (2021). https://webapps.frm2.tum.de/intranet/neutroncalc/.
29. Hoffmann I. Neutrons for the Study of Dynamics in Soft Matter Systems. Colloid Polym Sci (2014) 292:2053–69. doi:10.1007/s00396-014-3330-9
30. Pasini S, Holderer O, Kozielewski T, Richter D, Monkenbusch M. J-nse-phoenix, a Neutron Spin-echo Spectrometer with Optimized Superconducting Precession Coils at the Mlz in Garching. Rev Scientific Instr (2019) 90:043107. doi:10.1063/1.5084303
31. Zolnierczuk PA, Holderer O, Pasini S, Kozielewski T, Stingaciu LR, Monkenbusch M. Efficient Data Extraction from Neutron Time-Of-Flight Spin-echo Raw Data. J Appl Crystallogr (2019) 52:1022–34. doi:10.1107/S1600576719010847
32. Frielinghaus H, Falus P, Fomina M, Holderer O. Ion Diffusion Processes in Ionic Liquids under Confinement (2021). doi:10.5291/ILL-DATA.TEST-3175
33. Teubner M, Strey R. Origin of the Scattering Peak in Microemulsions. J Chem Phys (1987) 87:3195–200. doi:10.1063/1.453006
34. Frank C, Frielinghaus H, Allgaier J, Prast H. Nonionic Surfactants with Linear and Branched Hydrocarbon Tails: Compositional Analysis, Phase Behavior, and Film Properties in Bicontinuous Microemulsions. Langmuir (2007) 23:6526–35. doi:10.1021/la0637115
35. Nallet F, Roux D, Milner ST. Small-angle Scattering Features of Lyotropic Smectics a. J Phys France (1990) 51:2333–46. doi:10.1051/jphys:0199000510200233300
36. Rilo E, Vila J, Pico J, García-Garabal S, Segade L, Varela LM, et al. Electrical Conductivity and Viscosity of Aqueous Binary Mixtures of 1-Alkyl-3-Methyl Imidazolium Tetrafluoroborate at Four Temperatures. J Chem Eng Data (2010) 55:639–44. doi:10.1021/je900600c
37. Rilo E, Vila J, García-Garabal S, Varela LM, Cabeza O. Electrical Conductivity of Seven Binary Systems Containing 1-Ethyl-3-Methyl Imidazolium Alkyl Sulfate Ionic Liquids with Water or Ethanol at Four Temperatures. J Phys Chem B (2013) 117:1411–8. doi:10.1021/jp309891j
38. Musat R, Renault JP, Candelaresi M, Palmer DJ, Le Caër S, Righini R, et al. Finite Size Effects on Hydrogen Bonds in Confined Water. Angew Chem Int Ed (2008) 47:8033–5. doi:10.1002/anie.200802630
39. Brubach J-B, Mermet A, Filabozzi A, Gerschel A, Lairez D, Krafft MP, et al. Dependence of Water Dynamics upon Confinement Size. J Phys Chem B (2001) 105:430–5. doi:10.1021/jp002983s
40. Senapati S, Chandra A. Dielectric Constant of Water Confined in a Nanocavity. J Phys Chem B (2001) 105:5106–9. doi:10.1021/jp011058i
Keywords: ionic liquid, confinement, neutron spin-echo spectroscopy, x-ray diffraction, diffusion
Citation: Frielinghaus H, Fomina M, Hayward D, Dubey PS, Jaksch S, Falus P, Fouquet P, Fruhner L and Holderer O (2022) Ionic Liquid (EmimAc)-Water Mixture Confined in Nanoporous Glass Matrices Studied With High-Resolution Neutron Spectroscopy. Front. Phys. 10:872616. doi: 10.3389/fphy.2022.872616
Received: 09 February 2022; Accepted: 30 March 2022;
Published: 21 April 2022.
Edited by:
Siddharth Surajbhan Gautam, The Ohio State University, United StatesReviewed by:
Manish Pratap Singh, Veer Bahadur Singh Purvanchal University, IndiaGiovanna D'Angelo, University of Messina, Italy
Copyright © 2022 Frielinghaus, Fomina, Hayward, Dubey, Jaksch, Falus, Fouquet, Fruhner and Holderer. This is an open-access article distributed under the terms of the Creative Commons Attribution License (CC BY). The use, distribution or reproduction in other forums is permitted, provided the original author(s) and the copyright owner(s) are credited and that the original publication in this journal is cited, in accordance with accepted academic practice. No use, distribution or reproduction is permitted which does not comply with these terms.
*Correspondence: H. Frielinghaus, aC5mcmllbGluZ2hhdXNAZnotanVlbGljaC5kZQ==
 H. Frielinghaus
 M. Fomina
 D. Hayward
 P. S. Dubey1
 S. Jaksch
 O. Holderer