Abstract
Many infrastructure networks are considered the backbone of our society; however, increasing disasters and terrors cause serious damage to energy, water, communication, and transportation systems. In this study, we proposed a distributed self-healing method for the damaged networks whose original structure is extremely vulnerable and scale-free. For reconstructing a sustainable network, the key ideas of our method are ring formation and enhancing loops by adding the resource of healing links between low-degree nodes inspired from the state-of-the-art edge rewiring methods. In emulating a healing algorithm asynchronously, we showed that the reconstructed network has both higher robustness and efficiency than the ones using the conventional self-healing methods. Our distributed self-healing method will be useful as a basic framework for sustainable network reconstruction.
1 Introduction
It has been well-known that many social, technological, and biological networks are commonly represented by a scale-free (SF) network whose degree distribution follows a power law [1]. However, a SF network is extremely vulnerable against targeted attacks to high-degree hub nodes [2, 3]. In infrastructure networks such as airlines, the Internet, and power-grids, these weak structures are frequently exposed to natural and man-made disasters. For example, an accident of drones by unknown attackers at an airport in England disrupted a thousand flights in Europe [4], while lots of airport shutdowns resulted from bad weather conditions and natural phenomena [5]. Also, the backbone of communication system, the Internet, is consistently threatened by distributed denial-of-service (DDoS) attacks [6]. Major causes of blackouts in North America are due to natural disasters [7]. In addition, the global supply chain network was damaged by the earthquakes and tsunamis that occurred in Japan in 2011 [8]. Since such infrastructures are necessary for our sustainable society, structural weakness should be overcome in order to maintain connectivity. Thus, a resilience-based system design has attracted attention, especially from system engineering and environmental science fields. The concept of resilience includes not only recovering the original state from disturbances but also reconstructing systems with adaptive capacity [9, 10]. We emphasized the reconstruction of damaged networks by healing for improving the robustness of connectivity because if a damaged network is recovered to the original structure, the extremely vulnerable SF structure still remains. For example, as a recovery method, several self-healing methods have been proposed recently [11, 12]. Comparing the healing methods [11, 12] with our method, these methods aim to recover the original structure, whereas our method aims to reconstruct a new structure. Therefore, the objectives are intrinsically different between recovery and reconstruction, although the aforementioned methods and our method are based on a similar strategy of healing by adding links and controlling the number of added links by a parameter. As shown in figures of Section 3, the networks reconstructed using our method have both higher robustness and efficiency than the original SF network (denoted by a black dashed line), with much less incomplete recovery by these methods in controlling fewer added links.
In a state-of-the-art research study, it has been found that an onion-like structure has the optimal robustness against malicious attacks [13, 14]. Within reserving a given degree distribution, this structure can be formed by whole rewiring for increasing degree–degree correlations [13, 15]. However, it is suggested that enhancing loops is more effective than increasing the correlations [16–19]. This is supported from a fact that network dismantling and decycling problems are asymptotically equivalent in random networks with light-tail degree distributions [16]. When the network becomes a tree without loops, we can intuitively understand that it is easily fragmented by any node removal. Here, the dismantling problem is finding the minimum set of nodes whose removal makes a graph fragmented into at most a given size, while the decycling problem is finding the minimum set of nodes whose removal makes a graph acyclic. The decycling set is also called as the feedback vertex set (FVS) in computer science, although finding the FVS belongs to a class of NP-hard in combinatorial optimization problems. To generate an onion-like structure, enhancing loops by copying [17] and intermediation [18] are effective in incrementally growing networks. Moreover, rewirings by enhancing loops with/without preserving a degree distribution generate the onion-like structure or robust networks with negative degree–degree correlations [19]. Thus, by enhancing loops, a network becomes more robust, as it is hard to be a tree. In other words, it corresponds to maximize the size of FVS approximately.
On the other hand, based on enhancing loops, a new self-healing method for network reconstruction has been proposed recently [20]. In order to get stronger connectivity, this method applies an extended connection range for new links as the key idea, which has been introduced for interdependent two-layered square lattices [21]. It has been shown [20] that the reconstructed network has higher robustness than the ones using conventional heuristic methods: simple local repair [22], in which healing links are added by priority of more damaged nodes, and bypass rewiring [23], in which a damaged node is randomly connected only one time with the other one. By Forgiving Tree algorithm [24] in computer science, although the connections between a removed node and its nearest neighbors are replaced as a tree to reduce the diameter of the reconstructed network, this algorithm does not consider the robustness of connectivity. Despite the advantages [20], it may be expected that the healing method based on enhancing loops is further improved by focusing on the network by the rewirings which has stronger robustness due to smaller gaps between the maximum and minimum degrees [19]. For reducing the gap in the healing after attacks, adding links for low-degree nodes is effective because high-degree nodes tend to be removed. This is the reason for connecting between low-degree nodes, as mentioned later.
In this study, several infrastructure networks imagined with adaptive wireless communication [25] or future microwave power transfer [26] are subjected to target systems for healing. Although the detail realizations are not discussed because of the dependence on the progress of device technologies, we described a distributed algorithm for controlling an autonomous network system, in which nodes work together for reconstructing from damaged systems after attacks or disasters. Since such infrastructures are large-scale and complex, a distributed control is more desirable than a central control because the distributed control network systems provide several advantages [27–29] in contrast to the central control. Each node has a same algorithm which can be applied to a network independently of its size or topological structure in a scalable manner. Since some tasks are processed concurrently at different locations, the execution times are shorter than those processed sequentially by a central control. A distributed control has high reliability to protect the whole down cooperatively by the remaining parts after attacks or disasters, while the malfunctions of control centers are fatal. Moreover, local resource allocation of healing links is available in a distributed algorithm for rapid reconstruction of a network. We designed a distributed healing algorithm with the advantages of scalability, concurrency, reliability, and local resource allocation.
Our article is organized as follows: in Section 2, we introduce the outline of our self-healing method in contrast to the previous method [20]. In Section 3, the effects of our method are numerically evaluated by measuring connectivity, robustness of connectivity, and efficiency of paths for typical three real networks. In each of them, the structural change of a healed network from the original one before attacks is investigated by both the number of neighbor nodes and its degree distribution. In Section 4, the autonomous distributed algorithm for our method is described in detail, although the simulation results are shown in Section 3 beforehand. In Section 5, we summarize the obtained results from Section 3 and Section 4.
2 Brief Description of Our Method
Usually, attacked nodes are not recovered immediately in natural or man-made disasters, and the malfunctions may continue for a long time, and their neighbors are damaged by losing healing links. Under such urgent situation, our healing method compensates the lost connectivity. Without losing generality, we assumed that some links emanated from qN-attacked nodes can be reused for healing, where q denotes the fraction of simultaneously attacked nodes, and N denotes the original network size before attacks. This assumption is feasible: some parts of disconnected cable lines or wireless beams are reusable in a communication network, while directions of stopped flight routes can be changed in an airline network. However, the amount of reusable links depends on the damages on a network. If reusable links are insufficient, we also assume the additional support of links as an investment. Thus, we define the total number of links Mh for healing as follows.Here, ki denotes the degree of node i, Dq denotes a set of attacked nodes, means the sum of attacked nodes’ degrees without duplicating counts, and rh is a control parameter whose range is 0 < rh ≤ 1 according to the damaged situation. For Mh-healing links, it is repeated to add a healing link between two damaged nodes.
Based on ring formation and enhancing loops, our method is slightly different from the previous method [
20]. After describing each step in our method, we explain the reason why our method differs.
• Step 1 Initiation for healing
Nearest neighbors of attacked nodes detect the damages as disconnections and try to connect each other by healing links because those nodes lose some paths to other nodes by attacks. After the detection, damaged nodes stop the normal mode for transferring supplies or packets and start the healing mode. In the healing mode, damaged nodes send control signals to other nodes within three hops from each of them, although equipment such as wireless devices for control signals are different from normal tools used in optical fiber communication or transportations by flights. Initially, as default, it is assumed that each node has a data set called local map to store identifiers (IDs) of nodes within three hops from itself. Before healing, a set of candidate nodes for healing links is equal to its local map. These candidates are extended from the initial set to maintain larger connectivity by healing.
• Step 2 Ring formation
After the initiation at each location, a ring is formed as the simplest loop by connecting the damaged nodes. When healing links are insufficient to form a ring completely, the connecting order of nodes is determined to get the maximum connectivity in a limited resource of Mh links. This order for our method is different from that for the previous method [20], as mentioned later.
• Step 3 Enhancing loops
When there are residual healing links in total Mh after making rings, the rings are enhanced by adding links on them. For prohibiting multi-links or self-loops, two nodes on a ring are connected for enhancing loops. The selection of nodes is also different from that in the previous method [20].
Before initiation, damaged nodes as neighbors of attacked nodes already have a local map in the normal mode. Remember that the local map stores the node IDs within three hops. The reason within three hops is as follows. Figure 1 shows the possible healing links between damaged nodes (blue circles) after attacks (red circles). In Figure 1B, node 1 finds only node 4 as the candidate for a healing link, when the range of local map is until two hops. Node 2 also finds only one node. Therefore, although nodes 1 and 2 create a healing link, the parts are still fragmented after healing. However, when the range is within three hops, as shown in Figure 1C, each node finds more candidates. In this example, node 1 initially has a set of candidates denoted as CN1 = (2, 4, 5) within three hops from node 1. Since node 2 belongs in CN1, CN2 = (1, 3, 4, 6) is merged as CN1 ← CN1 ∪ CN2. Moreover, since node 3 belongs in CN2, CN3 is also merged as CN1 ← CN1 ∪ CN2 ∪ CN3. Consequently, CN1 for node 1 is extended as (1, 2, 3, 4, 5, 6, 7). For nodes 2, 3, 4, 5, 6, and 7, same candidates are obtained. Thus, gradually extending the candidates by communicating control signals is reasonable in distributed local healing.
FIGURE 1
After extending the candidates, a ring between damaged nodes is formed by generating healing links (green lines in Figure 2). In the ring formation, every node on the ring has the same extended candidates which are on different sets of nodes on other rings. At several locations, rings can be formed in a healed network. Instead of a random order for connections as a ring in the previous method [20], we chose the candidates by decreasing order of their connected component sizes in order to maintain larger connectivity. As a tie-breaker, if more than two nodes belong to connected components with the same size, one node is randomly chosen in the order of connections for the ring.
FIGURE 2
Moreover, two nodes with the lowest degrees are selected on each ring (yellow lines in Figure 2) for enhancing loops. Our idea of connection between nodes with the lowest degrees is inspired from recent studies [30, 31]. This connection is created up to the number of residual healing links after ring formation. On the other hand, the previous method [20] applied a belief propagation (BP) algorithm [32] which estimates the feedback vertex set (FVS) as the necessary minimum nodes to form loops. We have shown that our method is slightly better than the previous method [20] in the next section.
For a distributed process, in the next section, we considered local resource control instead of global resource control for a sequential process in usual computation. In the local control, healing links are gathered and used only in each extended neighbor, whereas they are used in the whole remaining network in the global control. The numbers are calculated by modifying Eq. 1 with : a set of attacked nodes in an extended neighbor instead of Dq attacked nodes in the whole network. For example, if the value of rh is 0.8 in Figure 2, the number of usable healing links is eight and four in the left and right, respectively, by the local control. However, four links are insufficient to form a ring completely in the right, while one link is residual in the left after ring formation. Thus, an incomplete ring is formed in the right.
On the other hand, by the global control, the number of usable healing links is 8 + 4 = 12. Note that seven and five links are necessary in the left and right, respectively. Since 12 links are usable in the whole network, a complete ring can be formed in both the left and right. In Section 3, we have shown almost same results of robustness and efficiency obtained by local and global controls. In Section 4, the distributed algorithm for local resource control is described.
3 Results
We numerically evaluated our method in comparison with the previous method [
20]. After reconstruction by both methods after malicious attacks, the following three measures were investigated for the typical infrastructure networks [
33–
35] related to the SF structure; it is numerically estimated that OpenFlight and AS Oregon have power-law degree distribution, while PowerGrid has an exponential degree distribution [
36]. The basic properties of these networks are shown in
Table 1. We chose the high degree adaptive attack (HDA) as malicious attacks so that the
qNhighest degree nodes with recalculation of degrees are removed from the networks.
• Ratio S(q)/(1−q)N, where S(q) denotes the number of nodes in the largest connected component (LCC) in the reconstructed network after attacks to qN nodes.
• Robustness index [13] for further removing q′N nodes from the reconstructed network after attacks to qN nodes, where ∑ represents the sum for in the meaning of how much connectivity is maintained in the LCC when a node is removed one by one.
• Efficiency of paths in the reconstructed network, where dij denotes the shortest path length counted by hops between two nodes i and j.
TABLE 1
| Network | N | M | kavg | kmax | kmin | D | r |
|---|---|---|---|---|---|---|---|
| Internet AS Oregon | 6,474 | 12,572 | 3.9 | 1,458 | 1 | 9 | −0.181 |
| Airline OpenFlight | 2,905 | 15,645 | 10.8 | 242 | 1 | 14 | 0.048 |
| PowerGrid | 4,941 | 6,594 | 2.7 | 19 | 1 | 46 | 0.0034 |
Basic properties of infrastructure networks before attacks. N and M are the number of nodes and links in the original network, respectively. kavg, kmax, and kmin denote the average, maximum, and minimum degree of nodes, respectively. D denotes the diameter. r is the assortativity as the degree–degree correlations.
The ranges of these measures are 0 < S(q)/(1−q) N ≤ 1, , and 0 < E ≤ 1. Table 1 shows the basic properties for the original networks extracted as connected graphs with undirected edges.
We investigated the three measures as averaged values of over 100 realizations for reconstructed networks by our and the previous method [20]. In our method, random selections are applied not only for tie-breaking in ring formation and enhancing loops but also for asynchronous processing, as mentioned in the next section.
Before explaining the results, we have summarized the most important point: since these measures for reconstructed networks by our method (marked by upper triangle in Figure 3) are higher than those by the previous method (marked by lower triangle in Figure 3), it is obvious that our method is effective to reconstruct a network efficiently. Each of the results is explained as follows.
FIGURE 3
For reconstructing a sustainable network, a higher ratio S(q)/(1−q) N is crucial to maintain larger connectivity. Figure 3A shows relatively high ratios for OpenFlight and AS Oregon in both the methods (upper triangle and lower triangle marks for each color line). Especially, the ratio has the highest value for rh ≥ 0.5 (overlapped purple and yellow lines for OpenFlight and AS Oregon). If it is lower than 1, there exist isolated nodes even after healing. Moreover, high robustness of connectivity and short path length between nodes are also important for both the tolerance of healed network against further attacks and effective communications or transportations. Figures 3B,C show that our method has both higher values of R(q) and E(q) than those of the previous one for OpenFlight and AS Oregon (yellow and purple lines marked by upper triangle for rh ≥ 0.5). In addition, the values of R(q) are higher than those for the original network (black dashed lines). As a result, Figure 3A suggests that both methods have similar ratios regardless of the connecting order of nodes on a ring. However, as shown in Figures 3B,C, the selection of the nodes with the minimum degrees for enhancing loops improves both values of R(q) and E(q) instead of applying BP in the previous method [20]. As an exception, slightly different results are partially obtained for PowerGrid with a large diameter in Table 1. For PowerGrid, in the right of Figure 3A, the ratio S(q)/(1−q) N rapidly decreases at q = 0.5 in our method (yellow and purple lines marked by upper triangle). In addition, as shown in the right of Figures 3B,C, the values of R(q) and E(q) by our method (marked by upper triangle) become lower than those by the previous method [20] (marked by lower triangle on yellow and purple lines for q ≥ 0.7).
We showed the size of neighbor nodes and the degree distribution as the structural changes of healed networks from the original ones in Figures 4, 5, respectively. The size of neighbor nodes is measured as the maximum ratio (MR) of local map. Remember that local map at each node consists of node IDs within three hops from it. The MR of the local map is defined as the ratio of the number of node IDs included in the local map and the original network size N. If this value is close to 1, it means that a node has almost all node IDs with a large memory space. Figure 4 shows the MR of the local map in a healed network by our method. As shown in Figure 4 except for PowerGrid, the reconstructed network by our method has the smaller MR than 0.6 for OpenFlight and 0.2 for AS Oregon. For AS Oregon and OpenFlight, the maximum RS is close to 1 (black dashed lines) because of existing hubs with huge degrees in those original networks before attacks, while the MR becomes smaller because of no hubs in the healed network, as shown in Table 2 in comparison with kmax in Table 1. However, in some cases (yellow and purple lines) for PowerGrid, the reconstructed network has a slightly higher MR than the original network (the right of Figure 4). Figure 5 shows the degree distribution in reconstructed networks by our method. For OpenFlight and AS Oregon, the degrees of most nodes are within a small range. In other words, the gap between maximum and minimum degrees in reconstructed networks becomes smaller rather than the gaps in the original SF networks with power-law degree distributions. Note that even if links are added for healing, the reconstructed networks do not become a complete graph because the total number of healing links even at rh = 1.0 is not enough to form a complete graph, as shown in Table 3.
FIGURE 4
FIGURE 5
TABLE 2
| Network | rh\q | 0.1 | 0.5 | 0.9 |
|---|---|---|---|---|
| OpenFlight | 0.2 | 13.0 | 5.0 | 22.4 |
| 0.5 | 13.0 | 11.0 | 56.5 | |
| 1.0 | 15.0 | 22.0 | 112.9 | |
| AS Oregon | 0.2 | 4.0 | 2.0 | 8.0 |
| 0.5 | 4.0 | 4.0 | 20.0 | |
| 1.0 | 5.0 | 8.0 | 40.0 | |
| PowerGrid | 0.2 | 7.0 | 4.6 | 8.0 |
| 0.5 | 7.7 | 5.2 | 33.7 | |
| 1.0 | 8.0 | 9.2 | 32.4 |
Highest degree of node in the healed network after healing by our method for the fraction q of attacks.
TABLE 3
| Network | M \ q | 0.1 | 0.5 | 0.9 |
|---|---|---|---|---|
| OpenFlight | MHeal | 15,645.0 | 15,638.0 | 15,403.0 |
| MComp | 3,415,191.0 | 1,049,076.0 | 39,135.5 | |
| AS Oregon | MHeal | 12,572.0 | 12,562.0 | 12,457.0 |
| MComp | 16,974,051.0 | 5,221,296.0 | 202,846.2 | |
| PowerGrid | MHeal | 6,594.0 | 6,490.0 | 296.3 |
| MComp | 9,885,681.0 | 2,941,525.0 | 552.7 |
Number of links in the LCC. MHeal denotes the number of links in the LCC of the healed network. MComp denotes the number of links if the LCC is a complete graph of the corresponding network.
In the previous method [20], it is assumed that a node i can reuse its ports as much as the degree ki in the original network at most. If healing links are added over ki at a node i, additional ports are necessary. Here, ports are corresponded to channels or plug sockets at a node. Note that ports work independently of links just like airport runways or plug sockets and airplane flights or cables. Under these assumptions, the self-healing methods with a limitation of additional ports have been considered to avoid the intensive healing links at some nodes [20]. However, such limitations are out of scope in our method. The reasons are as follows. The degree distributions of the reconstructed networks by the previous method [20] follow an exponential distribution, and the maximum numbers of additional ports are less than the maximum degrees in the original networks before attacks. In contrast, the degrees of nodes in the reconstructed networks by our method are bounded within a narrow range, as shown in Figure 5. Moreover, the maximum degrees are decreased than ones in the original networks (Table 1 and 2). In particular, the maximum degrees by our method become 15, five, and seven for OpenFlight, AS Oregon, and PowerGrid at q = 0.1, respectively, while those by the previous method are 65, 19, and four [20]. Ever if the degrees of such nodes are one in the original networks, the numbers of additional ports are very few for our method. Thus, since our method saves the number of ports without the limitation of additional ports, we do not strictly take into account such limitation but consider that the amount of additional ports should be equipped in advance for healing.
Finally, two resource controls are compared as follows. Figure 6 shows the values of three measures for reconstructed networks by our method with local and global resource controls marked by plus and cross, respectively. Note that plus mark on each line in Figure 6 does not represent an error bar. As shown in Figure 6A for OpenFlight, local control has a slightly higher ratio than that of the global one in rh ≤ 0.1 (red and green lines marked by plus sign), while the ratios for both controls almost coincide in rh ≥ 0.2 (overlapped purple, blue, and yellow lines). In Figures 6B,C for OpenFlight and AS Oregon, the values of R (q) and E (q) for both controls also coincide in comparison with the same color lines. As an exception for PowerGrid, there exists a slight difference between the ratios in rh ≤ 0.2 (red, green, and blue lines in Figure 6A). These results suggest that the reconstructed networks by local and global resource controls have almost the same properties for three measures, although local resource control is suitable for the distributed algorithm described in the next section.
FIGURE 6
4 Distributed Healing Algorithm
This section explains the distributed version of our healing algorithm on the following assumptions in asynchronous processing [
28,
29].
1. Each node immediately responds to messages stored in a FIFO queue by arriving in order which is not affected to local clocks at sending nodes.
2. Since nodes communicate with each other by control signals with short messages, the time for the internal process can be ignored in comparing with the communications with short delay by encountering physical factors.
3. The internal process starts just after receiving a message.
4. Each node can directly detect a malfunction of only its nearest neighbor.
5. Each node mode performs a same algorithm for healing in a distributed manner.
6. While our healing algorithm is performed, there is no additional malfunctions in the network. If a new event is occurred, it requires the rollback of processes.
In order to emulate our distributed algorithm on a PC, we applied the AsyncIO module in Python 12. A task at a node consisted of sending and receiving messages between its extended candidates. Each of nodes generates a task concurrently by using AsyncIO. Although the AsyncIO module can emulate the concurrent execution of tasks generated at almost same time, the detail is internally ordered. To implement it with a corresponding short time delay encountered by a physical factor, we randomized the execution order of tasks in the total N nodes. Note that some nodes without generating tasks are excluded from the order. Figure 7 shows the schematic diagram of such task processing. Horizontal and vertical directions indicate N nodes in healing mode and global timeline of our healing process, respectively.
FIGURE 7
4.1 Description of Each Phase
On the asynchronous processing, our distributed algorithm consists of five phases. Figure 8 shows the flow chart of five phases in healing process. The proceeding phase at a node is distinguished by variables and messages used in each phase. We assumed that all variables and their initial values are already set in the normal mode.
FIGURE 8
4.1.1 Initiation
After attacks on nodes, the neighbors detect disconnected links as damages and change its mode from normal to healing. Remember that a damaged node in the healing mode directly exchanges messages with the nodes stored in its local map. Then each of damaged nodes simultaneously initiates and generates a task to perform the first phase of our algorithm.
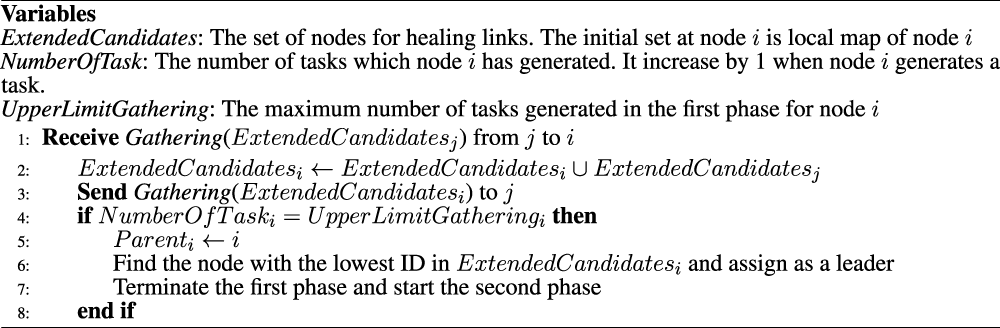
4.1.2 First Phase: Extending Candidate Nodes for Healing Links
The first phase corresponds to Step 1 in Section 2: Each of damaged nodes extends its candidate nodes for healing links. After initiation, a damaged node sends Gathering messages to the nodes stored in its local map. The IDs of candidate nodes exist in the Gathering message. Therefore, in order to extend the candidate nodes, the node i updates its own ExtendedCandidates (Algorithm 1: line 2) whenever it receives Gathering message. Note that ExtendedCandidates denotes a set of IDs of candidate nodes. Through exchanging the messages, damaged nodes extend candidate nodes from the initial set of the local map (Algorithm 1: line 3). In order to avoid unnecessary iterations of exchanging Gathering messages, we defined UpperLimitGathering as the limited number of tasks generated in the first phase. The value of the upper limit is equal to network diameter D because candidates cannot be extended beyond the entire network. After generating D tasks, the nodes start the second phase (Algorithm 1: line 7). However, they prepared the two variables of Parent and Leader for subsequent phases before starting the second phase (Algorithm 1: line 5–6). Each of damaged nodes becomes a root, whose Parent is set as its own ID. In addition, the damaged node with the lowest ID in ExtendedCandidates is assigned as a leader node.
Algorithm 1
4.1.3 Second Phase: Message Delivery on a Tree
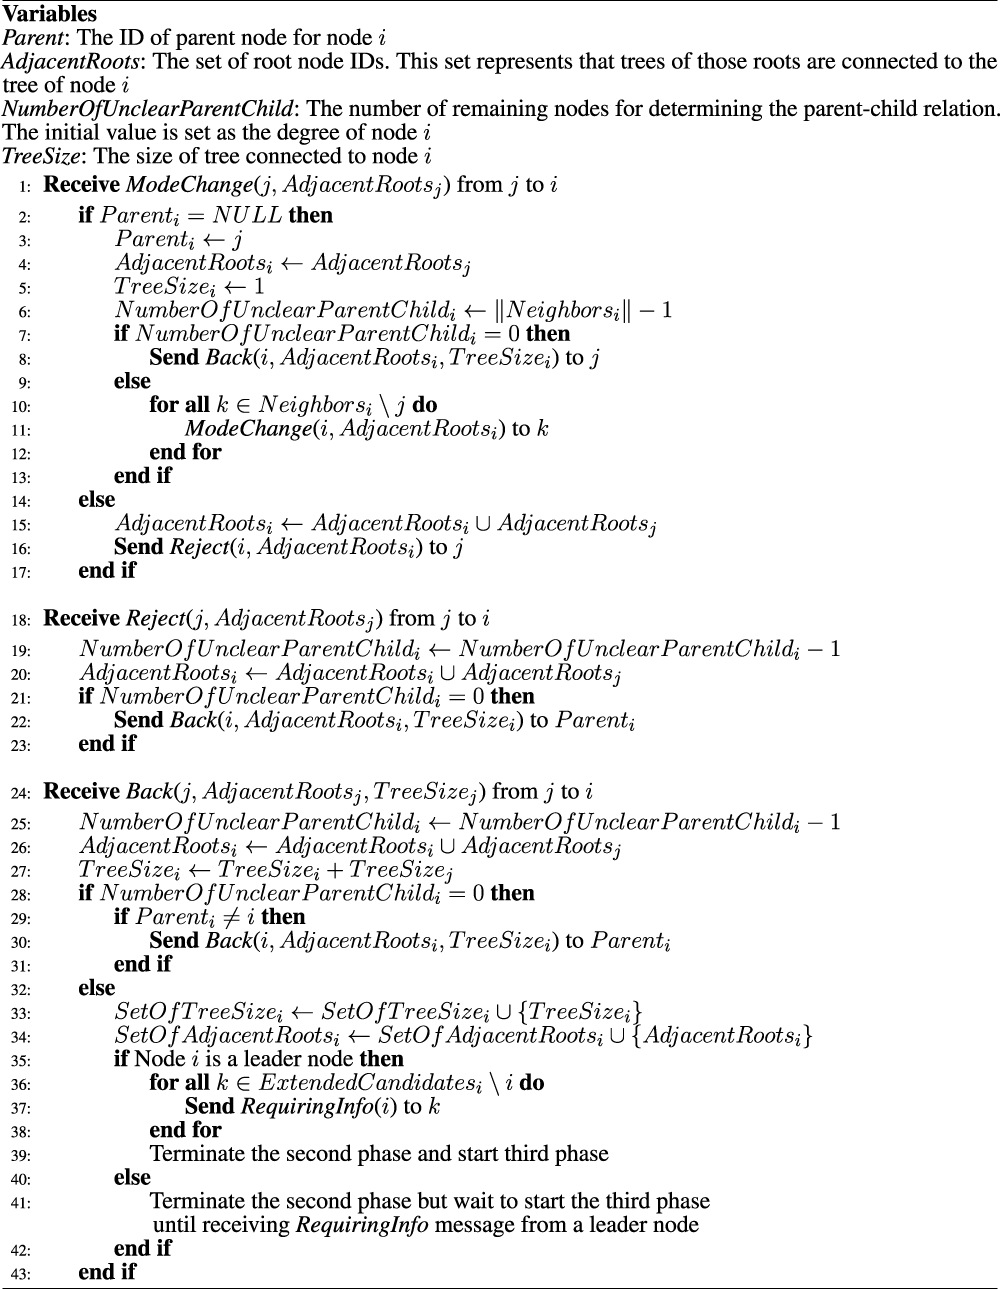
In our method, rings are formed between damaged nodes at different locations. Remember that the connecting order of nodes is defined according to the size of their connected components belonging to them. Therefore, in the second phase, we considered a delivery tree in order to avoid wasteful flooding. Based on the arrival order of messages, a parent-child relation is decided as follows.
Figure 9 shows the outline of the second phase. The ModeChange message notifies a malfunction from a root node to leaf nodes. As shown in Figures 9A, a root (node 1) sends ModeChange messages to connected nodes (nodes 2 and 3) first. Blue damaged nodes are denoted as root nodes. After receiving ModeChange messages at nodes 2 and 3, their mode are changed from normal to healing. In order to construct a tree, nodes 2 and 3 define node 1 as the parent node in a tree (Algorithm 2: line 3). Since node 1 becomes a parent, NumberOfUnclearParentChild of nodes 2 and 3 is decreased by 1 (Algorithm 2: line 6). The value of NumberOfUnclearParentChildi represents the number of remaining nodes for determining the parent–child relation. Whenever one of the nearest neighbors is defined as parent or child, NumberOfUnclearParentChild is decreased by 1. Then nodes 2 and 3 send ModeChange messages to their nearest neighbor except the parent (Algorithm 2: line 10–12). As shown in Figure 9A, node 6 receives ModeChange messages from nodes 2 and 3 at almost the same time. Note that nodes choose their parent according to the arrival order of messages in our study. In this case, node 6 chooses the node 3 as its parent. Node 6 sends Reject message backward to node 2 (Algorithm 2: line 16). Then node 2 determines that node 6 is not its child by receiving Reject message from node 6. Thus, node 2 decreases its NumberOfUnclearParentChild by 1 (Algorithm 2: line 19). Through this propagation, a tree is constructed.
FIGURE 9
When each of leaves receives the ModeChange message from its parent, it send Back message of own size to its parent (Algorithm 2: line 8). In Figure 9B, the ModeChange messages are arrived at leaf nodes (node 8, 9, 10, and 11) via nodes 4, 5, 6, and 7. Nodes 4, 5, 6, and 7 accumulate those sizes from their children and send Back message of the total size to their parent (Algorithm 2: line 27). After iterating these processes, a root acquires the size of connected component from it.
However, unlike Figure 9, several damaged nodes may exist in a same component, as shown in Figure 10. In Figure 10A, nodes 4 and 5 receive ModeChange messages from a couple of root nodes. In order to calculate a component size, the size of trees should be accumulated. As preparing for accumulation of tree sizes in the third phase, damaged nodes acquire not only the size of tree but also the roots’ ID (AdjacentRoots). In Figure 10A, node 4 receives ModeChange messages from nodes 1 and 2. Node 4 stores both roots’ ID to its own AdjacentRoots (Algorithm 2: line 4). Then after sending reject message to node 1 (Algorithm 2: line 16) and Back message to node 2 with its own AdjacentRoots from node 4, the AdjacentRoots of nodes 1 and 2 becomes as AdjacentRoots1 = (1, 2) and AdjacentRoots2 = (1, 2, 3) (Algorithm 2: line 20, 26). Since the IDs of node 1, 2, and 3 exist in AdjacentRoots2, node 2 knows that its tree is directly connected to the other trees of node 1 and 3.
FIGURE 10
When a component is separated, it is possible that the corresponding roots terminate the second phase at different times depending on their tree sizes through increment by deliveries. We assumed that only leader node starts the third phase just after acquiring its tree size (Algorithm 2: line 39). Other nodes in leader’s extended candidate nodes are waiting until receiving RequiringInfo message from its leader (Algorithm 2: line 35–38, 41) for accumulating tree sizes. Remember that a damaged node define its leader node as the node with lowest ID in its ExtendedCandidates at the first phase.
Algorithm 2
4.1.4 Third Phase: Accumulating the Sizes of Separated Components
In order to accumulate separated component sizes, roots send SendingInfo messages after receiving RequiringInfo message from their leader node (Algorithm 3: line 1–2). In the SendingInfo message, there are the following three variables: 1) TreeSize, 2) AdjacentRoots, 3) MalfuncNodes. TreeSize and AdjacentRoots are explained in the second phase. MalfuncNodesi denotes the IDs of attacked nodes and their degrees detected by node i. For setting this variable, we assumed that damaged nodes already have the degree of their nearest neighbors in normal mode. When a leader receives SendingInfo messages, each of three variables in a SendingInfo message is stored as a set of leader’s SetOfTreeSize, SetOfAdjacentRoots, and SetOfAttackedNodes (Algorithm 3: line 4–6).
In Figure 11, node 1, 2, 3, 4, and 5 have the same ExtendedCandidates, whose leader is node 1. By receiving SendingInfo messages, node 1 knows the sizes of trees for node 1, 2, 3, 4, and 5 (dark gray triangles in Figure 11). However, it does not know whether those trees are connected in a same component or not. Thus, we used AdjacentRoots to distinguish connected components. For example, whenever node 1 receives SendingInfo messages from node 2, 3, 4, and 5, it updates its own three variables (Algorithm 3: line 4–6). Consequently, SetOfAdjacentRoots of node 1 becomes [(1,2), (1,2,3), (2,3), (4,5), (4,5)] which is a collection set as containing in five subsets of IDs. Some subsets in SetOfAdjacentRoots1 are overlapped. In order to distinguish components in extended candidates, node 1 concatenates SetOfAdjacentRoots1 as a collection of non-overlapping subsets. Thus, SetOfAdjacentRoots1 becomes as [(1,2,3), (4,5)]. Each subset of SetOfAdjacentRoots1 represents that nodes 1, 2, and 3 exist in the same component, while nodes 4 and 5 exist in another component. By using concatenated SetOfAdjacentRoots1, node 1 calculates the size of each component (Algorithm 3: line 8). Note that the size of separated components exist in SetOfTreeSize as tree sizes. Through this process, leader nodes acquire the sizes and the number of components after concatenating subsets in SetOfAdjacentRoots. Leader nodes also acquire the IDs of attacked nodes and their degrees detected by their extended candidate nodes.
FIGURE 11
Algorithm 3

4.1.5 Fourth Phase: Ring Formation at Each Location
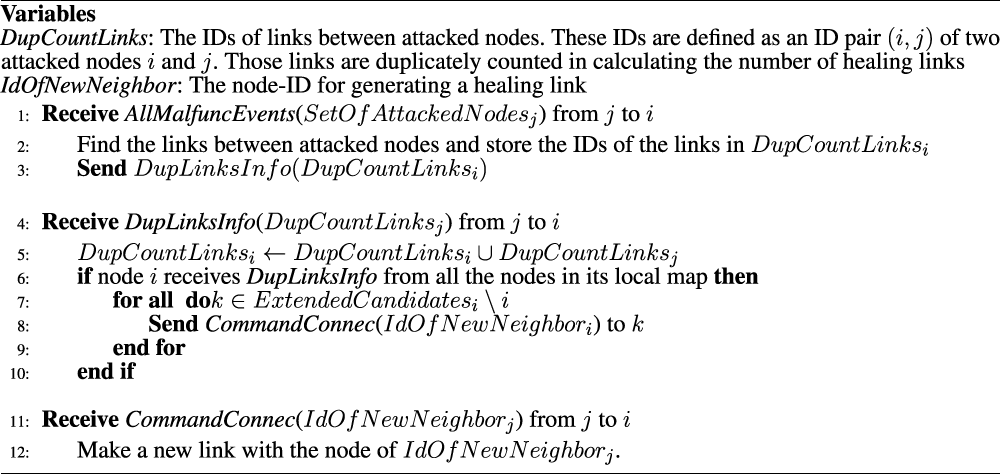
The fourth phase corresponds to Step 2 in Section 2: ring formation. Until the third phase, damaged nodes extend the candidate nodes for healing links and calculate their belonging component sizes. In this phase, rings are formed by exchanging messages between leader and their extended candidate nodes. Before forming a ring, a leader node calculates the number of healing links by a modification of Eq. 1 for local resource control. Although the leader node acquires degrees of attacked nodes in the third phase, it is necessary to check the links between attacked nodes for avoiding duplicating counts. The checking process is as follows.
Each of leader nodes sends AllErrInfo messages to other nodes in its own ExtendedCandidates. The IDs of attacked nodes are set in the AllErrInfo message. By receiving AllErrInfo message, each of damaged nodes also acquires the IDs of attack nodes. Remember that damaged nodes detect only malfunction of nearest neighbor and have its local map which stores the ID of nodes until three hops. Each of damaged nodes can check whether IDs of attacked nodes are existing in its local map. The links between attacked nodes in local map are defined as DupCountLinks variable (Algorithm 4: line 1). This variable represents ID pairs of attacked nodes. Then, damaged nodes send those link IDs to its leader node by DupLinksInfo message. When each of leader nodes receives DupLinksInfo messages from all nodes in its own ExtendedCandidates, it calculates the number of healing links according to the modification of Eq. 1 (Algorithm 4: line 6–7). After calculating the healing links, each leader node sends back the CommandConnec messages to other nodes in its ExtendedCandidates (Algorithm 4: line 8–10). For example, a leader node decides that the connecting order of nodes is (1, 4, 5, 6, 7, 3, 2, 1) in Figure 12A. According to this order, node 5 receives CommandConnec message with the ID of node 6 and generates a healing link to node 6. By generating a healing link at each node independently (green arrows in Figures 12A,B ring is formed among extended candidate nodes.
FIGURE 12
Algorithm 4
4.1.6 Fifth Phase: Enhancing Loops on Each Ring
The fifth phase is corresponded to Step 3 in Section 2: Each leader node selects two nodes with the minimum degrees on its ring for enhancing loops. The following process is repeated for adding residual links after ring formation. The leader node sends a pair of AddingLink messages to selected two nodes. By receiving the AddingLink message, the two nodes generate a healing link between themselves (Algorithm 5: line 2). Meanwhile, the leader node sends again the AddingLink messages to another two nodes just after recalculation of degrees. The leader node iterates such sending of AddingLink messages until it has no healing links. Finally, each leader node sends Ter messages to other nodes in its extended candidate nodes in order to terminate our healing process. The nodes after receiving the Ter message disseminate Ter messages through their trees constructed in the second phase. They also change their mode from healing to normal (Algorithm 5: line 4).
Before restarting a normal transferring of packets or supplies in the healed network, each node should check whether its nearest neighbors have also changed to the normal mode. Further preparation may be required depending on a target system, for example, a new routing table is necessary for a communication network.
Algorithm 5
Conclusion
We have proposed a network reconstruction method by self-healing to further improve the previous method [20]. In particular, for enhancing loops on a ring, we have considered healing links between low-degree nodes which reduce the gap between the maximum and minimum degrees. Through computer simulation, we have shown that our method is effective to obtain higher robustness and efficiency than the ones by the previous method [20]. As our key idea inspired from the results [19, 30, 31] that the smaller gap makes stronger robustness, the degree distributions of reconstructed networks by our method are changed as having a narrow range of degrees from a power-law with a fat-tail distribution in the original network. Moreover, we have successfully emulated our method as asynchronous processing by randomizing execution-order of tasks with time delays from encountering physical factors. By our distributed algorithm, healing links can be locally allocated for rapid reconstruction after attacks. Moreover, the local distributed process has almost the same results as the sequential process. These findings provide a basis for how to reconstruct a robust and efficient network by locally distributed healing.
We discussed the limitation of our method. In Sections 2 and 4, several assumptions are established for performing our method. For example, links of a network are reusable or investable for healing. The rollback of the healing process is performed if additional attacks occur in a network, especially the most important assumption is that rapid rewiring in a network is available such as changing directions of flights or wireless beam. Our method works well on these assumptions. However, such rewiring cannot be performed in some systems such as road networks. Moreover, if the assumption of rollback is broken by very quick sequential attacks in a network, the usability of our method is limited. Despite its limitations, we expect that our method is effective for the networks with varying degree-degree correlations because we have considered that enhancing loops is more important than increasing the correlations for improving robustness [16–19]. In fact, even though AS Oregon has a negative correlation, as shown in Table 1, our method works effectively for that network. Moreover, the previous research study [19] shows that a robust network with negative correlations can be created by enhancing loops. However, the detail analysis for networks with degree–degree correlations may remain as future research.
On the other hand, we also assumed that malicious attack is HDA, in which qN nodes are removed simultaneously from the network. Thus, not the order of deletion but the set of attacked nodes affects the results in our study. However, considering quick sequential attacks, the order of deletion of nodes may be meaningful. Although such attacks are beyond our current scope, some discussions may be required as another future research.
Further investigation could be conducted to determine the effectiveness of our method against the more destructive attacks to loops, for example, CoreHD [38], collective influence [39], and BP attacks [40]. Other spatial attacks by earthquakes or floods may be also important.
Statements
Data availability statement
The original contributions presented in the study are included in the article/Supplementary Material; further inquiries can be directed to the corresponding author.
Author contributions
YH and JK designed the research. JK performed the research. JK and YH contributed in developing new methods, analyzed data, and wrote the manuscript. All authors read and approved the final manuscript.
Funding
This research is supported in part by JSPS KAKENHI under Grant Number JP.21H03425.
Conflict of interest
The authors declare that the research was conducted in the absence of any commercial or financial relationships that could be construed as a potential conflict of interest.
Publisher’s note
All claims expressed in this article are solely those of the authors and do not necessarily represent those of their affiliated organizations, or those of the publisher, the editors, and the reviewers. Any product that may be evaluated in this article, or claim that may be made by its manufacturer, is not guaranteed or endorsed by the publisher.
Footnotes
1.^Python Library: asynsio. https://docs.python.org/3/library/asyncio.html (Accessed on 06 February 2022)
2.^Introduction to Asyncio in Python. https://www.polarsparc.com/xhtml/Python-Asyncio.html (Accessed on 06 February 2022)
References
1.
AmaraLANScalaABarthelemyMStanleyHE. Classes of Small-World Networks. In: The Structure and Dynamics of Networks. Princeton, NJ: Princeton University Press (2011). p. 207–10. 10.1073/pnas.200327197
2.
AlbertRJeongHBarabásiA-L. Error and Attack Tolerance of Complex Networks. nature (2000) 406:378–82. 10.1038/35019019
3.
BarabásiALAlbertR. Emergence of Scaling in Random Networks. science (1999) 286:509–12. 10.1126/science.286.5439.509
4.
WendtPVoltes-DortaASuau-SanchezP. Estimating the Costs for the Airport Operator and Airlines of a Drone-Related Shutdown: an Application to Frankfurt International Airport. J Transp Secur (2020) 13:93–116. 10.1007/s12198-020-00212-4
5.
De LangheKStruyfESysCVan de VoordeEVanelslanderT. Economic Effects and Costs of a Temporary Shutdown of an Airport. Antwerp: University of Antwerp (2012). Retrieved August 14 2019.
6.
WueestC. The Continued Rise of Ddos Attacks. In: White Paper: Security Response. Mountain view, CA: Symantec Corporation (2014).
7.
HinesPAptJTalukdarS. Large Blackouts in north america: Historical Trends and Policy Implications. Energy Policy (2009) 37:5249–59. 10.1016/j.enpol.2009.07.049
8.
MacKenzieCASantosJRBarkerK. Measuring Changes in International Production from a Disruption: Case Study of the Japanese Earthquake and Tsunami. Int J Prod Econ (2012) 138:293–302. 10.1016/j.ijpe.2012.03.032
9.
FolkeC. Resilience: The Emergence of a Perspective for Social–Ecological Systems Analyses. Glob Environ Change (2006) 16:253–67. 10.1016/j.gloenvcha.2006.04.002
10.
ZolliAHealyAM. Resilience: Why Things Bounce Back. London: Hachette UK (2012).
11.
ShangY. Impact of Self-Healing Capability on Network Robustness. Phys Rev E Stat Nonlin Soft Matter Phys (2015) 91:042804. 10.1103/PhysRevE.91.042804
12.
ShangY. Effect of Link Oriented Self-Healing on Resilience of Networks. J Stat Mech (2016) 2016:083403. 10.1088/1742-5468/2016/08/083403
13.
SchneiderCMMoreiraAAAndradeJSHavlinSHerrmannHJ. Mitigation of Malicious Attacks on Networks. Proc Natl Acad Sci U.S.A (2011) 108:3838–41. 10.1073/pnas.1009440108
14.
TanizawaTHavlinSStanleyHE. Robustness of Onionlike Correlated Networks against Targeted Attacks. Phys Rev E (2012) 85:046109. 10.1103/PhysRevE.85.046109
15.
WutscherTGiessiblFJ. Note: In Situ Cleavage of Crystallographic Oriented Tips for Scanning Probe Microscopy. Rev Scientific Instr (2011) 82:026106. 10.1103/PhysRevE.84.026106
16.
BraunsteinADall’AstaLSemerjianGZdeborováL. Network Dismantling. Proc Natl Acad Sci U.S.A (2016) 113:12368–73. 10.1073/pnas.1605083113
17.
HayashiY. A New Design Principle of Robust Onion-like Networks Self-Organized in Growth. Net Sci (2018) 6:54–70. 10.1017/nws.2017.25
18.
HayashiYUchiyamaN. Onion-like Networks Are Both Robust and Resilient. Sci Rep (2018) 8:1–13. 10.1038/s41598-018-29626-w
19.
ChujyoMHayashiY. A Loop Enhancement Strategy for Network Robustness. Appl Netw Sci (2021) 6:1–13. 10.1007/s41109-020-00343-6
20.
HayashiYTanakaAMatsukuboJ. More Tolerant Reconstructed Networks Using Self-Healing against Attacks in Saving Resource. Entropy (2021) 23:102. 10.3390/e23010102
21.
StippingerMKertészJ. Enhancing Resilience of Interdependent Networks by Healing. Physica A: Stat Mech its Appl (2014) 416:481–7. 10.1016/j.physa.2014.08.069
22.
GallosLKFeffermanNH. Simple and Efficient Self-Healing Strategy for Damaged Complex Networks. Phys Rev E (2015) 92:052806. 10.1103/PhysRevE.92.052806
23.
ParkJHahnSG. Bypass Rewiring and Robustness of Complex Networks. Phys Rev E (2016) 94:022310. 10.1103/PhysRevE.94.022310
24.
HayesTRustagiNSaiaJTrehanA. The Forgiving Tree: a Self-Healing Distributed Data Structure. In: Proceedings of the Twenty-Seventh ACM Symposium on Principles of Distributed Computing (2008). New York: ACM. p. 203–12. 10.1145/1400751.1400779
25.
BiSHoCKZhangR. Wireless Powered Communication: Opportunities and Challenges. IEEE Commun Mag (2015) 53:117–25. 10.1109/MCOM.2015.7081084
26.
HuangKZhouX. Cutting the Last Wires for mobile Communications by Microwave Power Transfer. IEEE Commun Mag (2015) 53:86–93. 10.1109/MCOM.2015.7120022
27.
DresslerF. Self-organization in Sensor and Actor Networks. Hoboken, NJ: John Wiley & Sons (2008).
28.
RaynalM. Distributed Algorithms for Message-Passing Systems, 500. Berlin/Heidelberg: Springer (2013).
29.
CoulorisGDollimoreJKindbergT. In: Distributed Systems: Concepts and Design. 2nd ed., 1. Massachusetts, Boston:Addison-Wesley (1994). p. 4.
30.
ChujyoMHayashiY. Improvement of the Robustness against Attacks in Continuously Varying Degree Distributions. In: BenitoRMCherifiCCherifiHMoroERochaLMSales-PardoM, editors. Book of Abstracts: Complex Networks 2021. Madrid, Spain: Springer (2021). p. 569–71. https://2021.complexnetworks.org/
31.
LiaoFHayashiY. Emergence of Robust and Efficient Networks in a Family of Attachment Models (2021). arXiv preprint arXiv:2110.03176.
32.
ZhouH-J. Spin Glass Approach to the Feedback Vertex Set Problem. Eur Phys J B (2013) 86:1–9. 10.1140/epjb/e2013-40690-1
33.
RossiRAAhmedNK. The Network Data Repository with Interactive Graph Analytics and Visualization. In: Proceedings of the Twenty-Ninth AAAI Conference on Artificial Intelligence (2015). Palo Alto, CA: The AAAI Press.
34.
LeskovecJKleinbergJFaloutsosC. Graphs over Time. In: Proceedings of the Eleventh ACM SIGKDD International Conference on Knowledge Discovery in Data Mining (2005). New York: ACM. p. 177–87. 10.1145/1081870.1081893
35.
WattsDJStrogatzSH. Collective Dynamics of 'small-World' Networks. nature (1998) 393:440–2. 10.1038/30918
36.
CloteauxB. Limits in Modeling Power Grid Topology. In: 2013 IEEE 2nd Network Science Workshop (NSW), West Point, NY. New York: IEEE (2013). p. 16–22. 10.1109/nsw.2013.6609189
37.
NewmanMEStrogatzSHWattsDJ. Random Graphs with Arbitrary Degree Distributions and Their Applications. Phys Rev E Stat Nonlin Soft Matter Phys (2001) 64:026118. 10.1103/PhysRevE.64.026118
38.
ZdeborováLZhangPZhouH-J. Fast and Simple Decycling and Dismantling of Networks. Sci Rep (2016) 6:1–6. 10.1038/srep37954
39.
MoroneFMakseHA. Influence Maximization in Complex Networks through Optimal Percolation. Nature (2015) 524:65–8. 10.1038/nature14604
40.
MugishaSZhouH-J. Identifying Optimal Targets of Network Attack by Belief Propagation. Phys Rev E (2016) 94:012305. 10.1103/PhysRevE.94.012305
Summary
Keywords
self-healing, resilience-based design, distributed algorithm, robustness against attacks, efficiency of paths, resource allocation, sustainable network reconstruction
Citation
Kim J and Hayashi Y (2022) Distributed Self-Healing for Resilient Network Design in Local Resource Allocation Control. Front. Phys. 10:870560. doi: 10.3389/fphy.2022.870560
Received
07 February 2022
Accepted
15 March 2022
Published
05 May 2022
Volume
10 - 2022
Edited by
Víctor M. Eguíluz, Institute of Interdisciplinary Physics and Complex Systems (CSIC), Spain
Reviewed by
Yilun Shang, Northumbria University, United Kingdom
Chengyi Xia, Tianjin University of Technology, China
Updates
Copyright
© 2022 Kim and Hayashi.
This is an open-access article distributed under the terms of the Creative Commons Attribution License (CC BY). The use, distribution or reproduction in other forums is permitted, provided the original author(s) and the copyright owner(s) are credited and that the original publication in this journal is cited, in accordance with accepted academic practice. No use, distribution or reproduction is permitted which does not comply with these terms.
*Correspondence: Jaeho Kim, s2160002@jaist.ac.jp
This article was submitted to Interdisciplinary Physics, a section of the journal Frontiers in Physics
Disclaimer
All claims expressed in this article are solely those of the authors and do not necessarily represent those of their affiliated organizations, or those of the publisher, the editors and the reviewers. Any product that may be evaluated in this article or claim that may be made by its manufacturer is not guaranteed or endorsed by the publisher.