 Leonardo Degiorgi
95% of researchers rate our articles as excellent or good
Learn more about the work of our research integrity team to safeguard the quality of each article we publish.
Find out more
REVIEW article
Front. Phys. , 04 April 2022
Sec. Condensed Matter Physics
Volume 10 - 2022 | https://doi.org/10.3389/fphy.2022.866664
This article is part of the Research Topic Nematicity in Iron-Based Superconductors View all 10 articles
Nematicity, which refers to a phase of broken rotational but preserved translational symmetry, is underlined by the appearance of anisotropic properties and leaves remarkable fingerprints in all measurable physical quantities upon crossing the structural tetragonal-orthorhombic transition at Ts in several iron-based materials. Here, we review part of our own broadband optical investigations, addressing the impact of nematicity on the charge dynamics, as a function of temperature and of tunable applied stress, the latter acting as an external symmetry breaking field. We shall first focus our attention on FeSe, which undergoes a nematic (structural) transition without any subsequent onset of magnetic ordering below Ts. FeSe thus provides an opportunity to study nematicity without the limitations due to the reconstruction of the Fermi surface because of the spin-density-wave collective state in the orthorhombic phase, typical for several other iron-based superconductors. Our data reveal an astonishing anisotropy of the optical response in the mid-infrared-to-visible spectral range, which bears testimony of an important polarization of the underlying electronic structure in agreement with angle-resolved-photoemission-spectroscopy results. Our findings at high energy scales support models for the nematic phase resting on an orbital-ordering mechanism, supplemented by orbital selective band renormalization. The optical results at energies close to the Fermi level furthermore emphasize scenarios relying on scattering by anisotropic spin-fluctuations and shed new light on the origin of nematicity in FeSe. Moreover, the composition at which the associated Weiss temperature of the nematic susceptibility extrapolates to zero is found to be close to optimal doping (i.e., in coincidence with the largest superconducting transition temperature), boosting the debate to what extent nematic fluctuations contribute to the pairing-mechanism and generally affect the electronic structure of iron-based superconductors. The present review then offers a discussion of our optical data on the optimally hole-doped Ba0.6K0.4Fe2As2. We show that the stress-induced optical anisotropy in the infrared spectral range is reversible upon sweeping the applied stress and occurs only below the superconducting transition temperature. These findings demonstrate that there is a large electronic nematicity at optimal doping which extends right under the superconducting dome.
Nematicity lately arose to a key concept in solid state physics, because of its intimate relationship to the onset of superconductivity at high temperature [1–3]. It was soon recognised that this is a hallmark of iron-based superconductors, which are deemed to be unconventional and set new paradigms for superconductivity [4]. Nematicity, for which the electronic system breaks a discrete rotational symmetry of the crystal lattice without altering the existing translational symmetry, was originally brought into action in order to justify the anisotropy in the dc transport properties of the 122-materials Ba(Fe1−xCox)2As2 below their structural tetragonal-to-orthorhombic phase transition at Ts [5, 6]. Since the anisotropy of any measurable physical quantity is considerably larger than any reasonable expectations by solely pondering the lattice distortion, it has been conjectured that nematicity is electronic in nature. A central quantity is the nematic susceptibility in the tetragonal phase, for instance as evinced by elastoresistance measurements (i.e., measurements of the induced resistivity anisotropy due to anisotropic strain) [7, 8], which incidentally turns out to diverge in a Curie-like fashion. Such an astonishing divergence of the nematic susceptibility was also inferred by Raman [9–11] and elastic moduli [12] investigations.
In a broader perspective, electronic nematicity is not only a topic of relevance for the iron-based superconductors but its far-reaching consequences affect several cuprates and some heavy-fermion compounds, just to quote a few examples of other unconventional superconductors, which in fact provide signatures for strongly anisotropic electronic phases [13], as well.
Another basic ingredient of unconventional superconductors is the interplay of structural, magnetic and orbital order, which cannot be considered apart and disconnected from the onset of the nematic phase [4, 14–16]. Being here the focus on iron-based superconductors, it is well established that in almost all of them a structural transition at Ts coincides with or precedes a magnetic transition at TN and the related stripe-type magnetic order is coupled to the orthorhombic lattice distortion. The anticipated anisotropy of all physical quantities implicit in the nematic phase will be also experienced, because of symmetry, by all structural, magnetic as well as orbital properties. This thus hampers the determination of the driving mechanism and microscopic origin of nematicity [16]. In this context, FeSe lately acquired a prominent role within the panorama of iron-based materials, since it harbors a tetragonal-to-orthorhombic structural phase transition at Ts ≃ 90 K, where the lattice breaks the C4 rotational symmetry, in the absence of any subsequent, ambient pressure long-range magnetic order, prior the onset of superconductivity at Tc = 8 K [17, 18]. Therefore, FeSe is an ideal playground for the study of nematicity, since the absence of the Fermi surface folding due to the spin-density-wave-like antiferromagnetic order allows circumventing its concomitant coupling to the lattice structural transition.
Furthermore, the divergent nematic susceptibility, as observed in the strained-dependent dc transport properties, is empirically established in several iron-based superconductors even up to optimally doped compositions [19]. It is then a generic property spanning the great part of the phase diagram and led to speculate about scenarios for which nematic quantum criticality could perhaps enhance the pairing interaction [16, 20, 21]. Such an opportunity is intriguing and could open novel perspectives towards the onset of superconductivity in iron-based superconductors, as it has been already envisaged for the cuprates [22, 23]. There is an ongoing theoretical debate about the relationship between superconductivity and nematicity [13]. Equally, there is still the quest to better experimentally scrutinise the influence of nematic fluctuations on the electronic properties over a large energy range and at temperatures (T) extending under the superconducting dome, which are not accessible by elastoresistive technique. This motivated us to address the hole-doped Ba1−xKxFe2As2, which displays a nematic state up to x ∼ 0.3, when the antiferromagnetic phase boundary is reached [24]. We specifically choose the optimally-doped x = 0.4 compound (Tc = 38.5 K), which is an ideal composition in order to address the impact of the nematic fluctuations and their alleged relationship to superconductivity. Indeed, the nematic order fully disappears (i.e., Ts = 0) at this doping.
Here, we review data of our thorough broadband optical investigations of FeSe and Ba0.6K0.4Fe2As2, consisting in the measurement of the optical reflectivity as a function of T for samples experiencing a tunable symmetry breaking field, given by uniaxial stress. We ultimately extract the optical conductivity from the far-infrared up to the ultraviolet. This review, based on our publications in Refs. [25–27], is organised as follows: first an ample presentation of the experiment and then a thorough display of the data on both selected materials, together with their own dedicated discussion. An overall summary and a future outlook will conclude this paper.
Any phase transition that breaks a point group symmetry naturally leads to domain formation. In the case of a ferroelastic-like tetragonal-to-orthorhombic transition, as exhibited by underdoped iron-arsenide superconductors as well as by FeSe, a spontaneous strain at low T can be oriented in one of two possible directions, and a twin domain structure forms to minimize the elastic energy [5, 6]. Therefore, a tunable applied stress acts as a conjugate field to the orthorhombic distortion and enforces an adjustable population of domains oriented along a preferential direction, effectively bypassing sample twinning below Ts. Our mechanical device for applying stress, and thus detwinning the samples, is shown in Figure 1 [28, 29] and consists of a spring bellows, which is made of stainless steel and it is mounted at the oxygen-free Cu cold finger of the cryostat. The bellows can be extended/retracted in order to exert and release in − situ uniaxial stress (generally abbreviated by p) on the lateral side of the sample. This is undoubtedly a major technical progress, since the capability to control the symmetry breaking field grants more experimental opportunities than in the original, yet pioneering optical work based on a mechanical clamp enabling a fixed and mostly unknown amount of compressive stress [5, 30, 31].
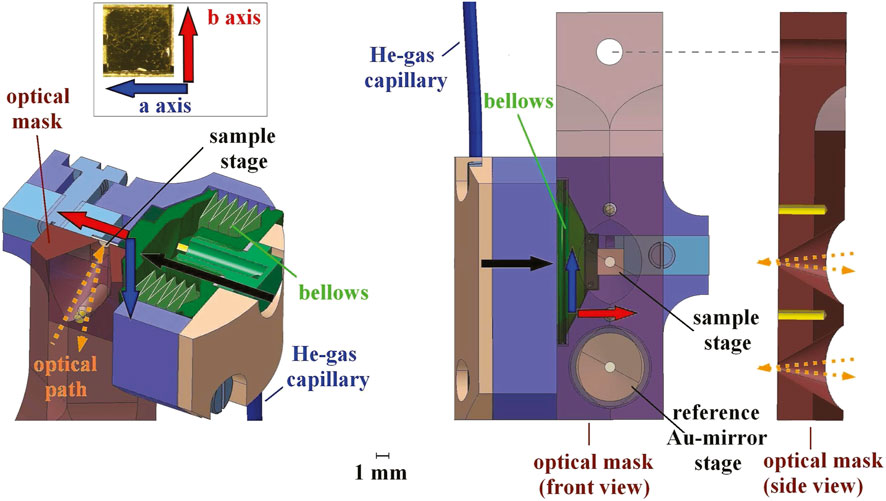
FIGURE 1. (color online) (left) Three-dimensional schematic view of the stress device with a cross-section along the plane of the incident/reflected optical path. (right) Front view along the light path. By flushing He-gas into the spring bellows and evacuating its volume, one can exert and release stress, respectively, along the direction corresponding to the (shorter) orthorhombic b-axis, as indicated by the black arrow. The optical mask, placed on top of the stress device, defines equal spots of the sample and reference Au-mirror surface, which are exposed to the electromagnetic radiation polarized along the a- and b-axis (blue and red arrow, respectively). Reproduced from Ref. [29].
The stress device (Figure 1), with the specimens mounted into it, is then placed inside an Oxford SM 4000 cryostat coupled to a Fourier-transform infrared interferometer (Bruker Vertex 80v). This permits measurements of the frequency (ω) dependence of the reflectivity (R(ω)) at nearly normal incidence [32] at different T and as a function of p in the spectral range from the far-infrared (FIR) up to the near-infrared (NIR), i.e. between 30 and 6,000 cm−1. Room-temperature and stress-free data were complementary collected from NIR up to the ultra-violet (UV) range, i.e. 3200–48000 cm−1. The electromagnetic radiation in all spectrometers was polarized along the a and b axes (Figure 1); in the following the measured reflectivity will be defined as Ra and Rb, respectively [28].
In displaying the data, we refer to the pressure of the He-gas flushed inside the volume of the bellows (pbellows) in order to extend it: the effective stress felt by the sample (psample) depends on its size and thickness, so that pbellows = 0.1 bar corresponds to an effective uniaxial stress of about psample ∼ 1.5–2 MPa on our crystals. It has been widely established that an effective p of at least 10 MPa is enough to fully detwin the specimen and thus reveal the underlying symmetry-breaking [5]. The released p data are achieved upon retracting the bellows, thus by evacuating its volume (Figure 1). We report results obtained from zero-pressure-cooled (ZPC) ‘pressure-loop’ experiments: we reach the selected T without applying stress and at that fixed T we measure R(ω) at progressively increasing pbellows (i.e., tunable degree of detwinning) from 0 up to a material-dependent maximum pressure ranging between 0.8 and 1.2 bar. We subsequently collect R(ω) when stepwise releasing stress back to 0 bar, thus completing the p-loop.
Finally, the real part σ1(ω) of the optical conductivity was obtained via the Kramers–Kronig (KK) transformation of R(ω) by applying suitable extrapolations at low and high frequencies. For the ω → 0 extrapolation, we made use of the Hagen-Rubens formula
Our original publications and their Supplemental Material [25–29] cited along this work should be consulted for more details on the experimental technique and set-up as well as samples growth.
We commence our data survey by the measured stress dependence of R(ω) in FeSe [25, 26], of which representative data in the FIR and mid-infrared (MIR) spectral range (i.e., for ω < 7,000 cm−1) are shown in the main panel of Figure 2A at 10 K. The stress applied by the spring bellows of pbellows = 1.2 bar corresponds to the situation for a fully detwinned specimen (i.e., at saturation). We can immediately recognise the overall (optical) metallicity of FeSe (inset of Figure 2A), identified by the increase of R(ω) below 2 × 104 cm−1 (i.e., plasma edge). The raw data explicitly convey the anisotropy of R(ω) between the two polarization directions at FIR-MIR frequencies. Such an anisotropy indeed develops from R(ω) at zero stress (see below), which shares the same trend over the whole investigated spectral range as in a previous work [33].
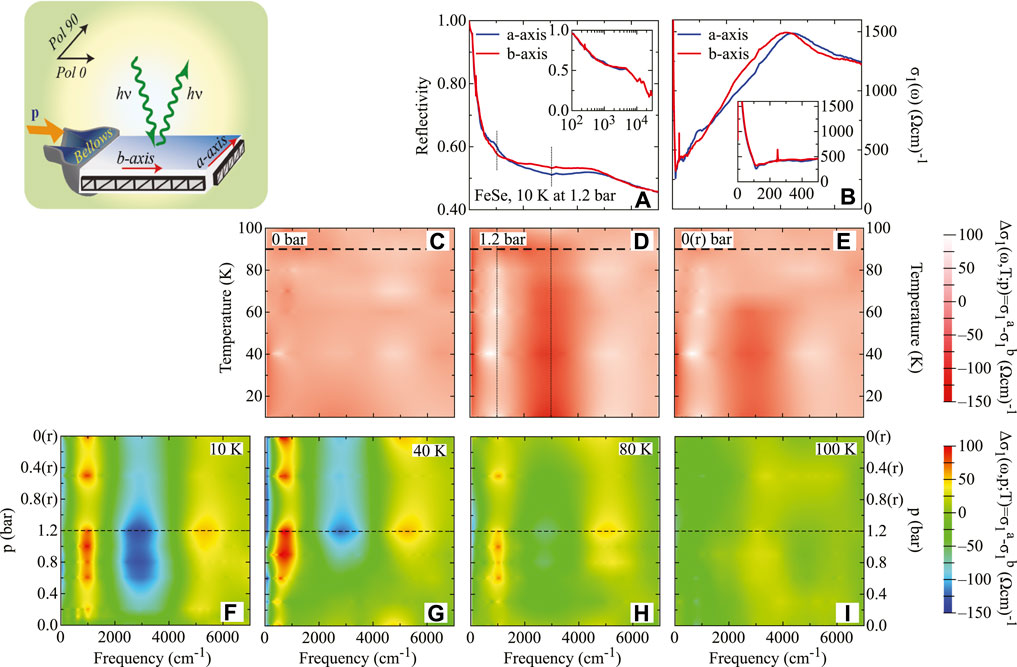
FIGURE 2. (color online) Experimental setup as well as T and p dependence of the optical anisotropy in FeSe: The upper-left panel schematically shows a sample inside the mechanical device and emphasizes the orientation of its a- and b-axis with respect to the direction of the applied stress p. Polarized light parallel to the orthorhombic (elongated) a- and (short) b-axis (in our experimental set-up Pol 90 and Pol 0, respectively) illuminates the sample (see details in Figure 1). (A) Representative data of the optical reflectivity (R(ω)) of FeSe at 10 K and 1.2 bar (i.e., at saturation) after a ZPC experiment; it emphasizes the optical anisotropy at MIR frequencies (1 eV = 8.06548 × 103 cm−1) [25]. The inset shows Ra(ω) and Rb(ω) from the FIR up to the UV range with a logarithmic frequency scale. (B) Real part σ1(ω) of the optical conductivity and its blow up pertinent to the FIR range (inset) at 10 K and 1.2 bar. (C–E) T dependence of the dichroism defined as
The polarisation dependence of R(ω) is also reflected in the excitation spectrum, represented by σ1(ω), as shown at saturation in Figure 2B. An alternative illuminating quantity, in order to emphasise the optical anisotropy, is the so-called dichroism
Before going any further, we focus our attention on the hysteretic behavior of the optical anisotropy. To this goal, we shed light on the p dependence of ΔRratio(ω) = (Ra(ω)/Rb(ω)) - 1 at 1,000 and 3,000 cm−1 (dashed vertical lines in Figure 2A) for the ZPC p-loop measurements, shown in Figure 3 for several representative T [25]. A clear half-hysteresis in the p dependence of ΔRratio is encountered for T < Ts and at both frequencies, though with opposite sign. We claim that this startling hysteretic occurrence is likely due to twin boundary motion. A quite rapid enhancement in |ΔRratio| at low T shapes the so-called virgin curve of the hysteretic behaviour. Afterwards, the optical anisotropy starts to saturate for larger p (Figures 3A,B,F,G). Therefore, a relatively modest uniaxial stress of psample ∼ 6 MPa is able to detwin the sample in the orthorhombic phase. The saturation of ΔRratio at T ≪ Ts presumably reflects complete detwinning of the sample, and any subsequent p dependence arises from the intrinsic response to p of the orthorhombic structure. The optical anisotropy is achieved more gradually for T ≤ Ts (Figures 3C,H), at which indeed the initial curve increases smoothly. At Ts (Figures 3D,I), the half-hysteresis loop has essentially collapsed and for T ≥ Ts (Figures 3E,J) the material is tetragonal and no half-hysteresis is observed so that the optical anisotropy totally vanishes at 3,000 cm−1 and is weakly negative at 1,000 cm−1.
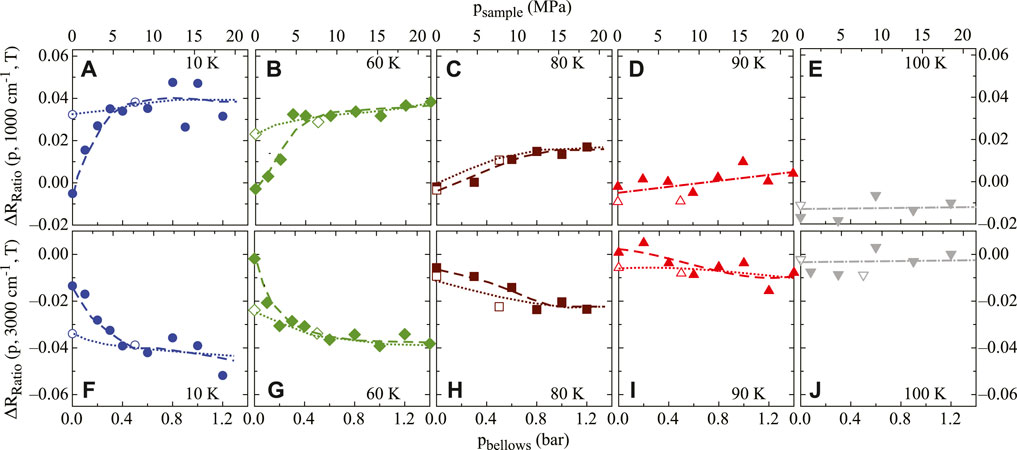
FIGURE 3. (color online) Optical anisotropy given by ΔRratio (see text) read at (A–E) 1,000 and (F–J) 3,000 cm−1 (dashed vertical lines in Figure 2A) of FeSe as a function of applied stress p at representative T: full and open symbols denote increasing and decreasing p, respectively, for p-loop measurements following an initial ZPC protocol. Lower x-axis denotes He-gas p in the spring bellows (pbellows) and upper x-axis the effective stress felt by the sample (psample). Dashed (increasing p) and dotted (releasing p) lines are drawn to guide the eye. Reproduced from Ref. [25].
We expect that the imbalance of the two twin orientations remains frozen in place at low T. This can be probed by the remanent optical anisotropy upon releasing p back to 0 [28]. At 10 K, the material barely shows changes in the optical anisotropy when p is released, indicating in fact that the sample remains in a near-single domain state. The intrinsic optical anisotropy of a fully detwinned but stress-free material is therefore given by ΔRratio at released p = 0. For increasing T, the thermally assisted domain-wall motion suppresses the anisotropy at released p = 0 [28]. Such a hysteretic behavior of ΔRratio(ω) is equivalently mapped onto Δσ1(ω), since its saturation value tends to persist at low T, while it vanishes for T → Ts, upon releasing p (Figures 2D,E as well as Figures 2F–I).
Figure 4 summarizes the T dependence of ΔRratio for FeSe at 1,000 and 3,000 cm−1 read at fixed pbellows = 1.2 bar (i.e., at saturation (sat),
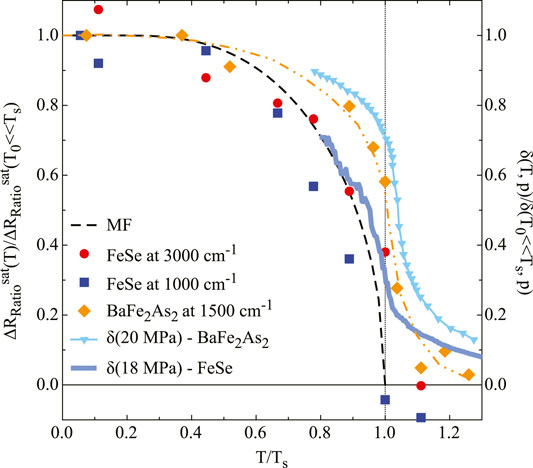
FIGURE 4. (color online) T dependence of
When comparing FeSe (Figure 3) and Ba(Fe1−xCox)2As2 [28, 29], we identify some distinct features of the hysteretic p dependence of their optical anisotropy at equivalent effectively felt uniaxial stress. First of all, the hysteretic behavior of the optical anisotropy in Co-doped BaFe2As2, while qualitatively reminiscent of FeSe, is clearly established only at frequencies below 2000 cm−1 with Ra(ω) > Rb(ω) and without any sign change over the whole spectral range. Moreover the anisotropy at saturation was found to display a broad crossover through Ts (Figure 4), similar to the T dependence of the dc transport anisotropy for fully detwinned specimens [5] as well as of the magneto-torque signal [38] and directly comparable to the stress-induced orthorhombicity (
The key role of the anisotropic electronic structure with respect to the nematic phase transition in FeSe (see Ref. [40] for the most recent, comprehensive review) is underscored by our optical data, which also highlight the central significance of the orbital degrees of freedom, affecting the band structure in an extended energy interval [41–47]. The optical anisotropy indeed occurs within the frequency range 0–6,000 cm−1 (Figure 2A), which is fairly consistent with the extent from the Fermi level of the correlated and weakly dispersing 3d iron bands [45, 48, 49]. However, there is an ongoing debate about the detailed nature of the nematic state in FeSe. Nuclear-magnetic-resonance (NMR) studies [50–52] initially promote a so-called on-site ferro-orbital ordering. Investigations of the electronic band structure in the reciprocal space force to revise the conclusions unbent from NMR, so that the purely on-site ferro-orbital order needs to be reconsidered within momentum-dependent scenarios. In fact, angle-resolved-photoemission-spectroscopy (ARPES) results [40, 45, 49, 53–61] indicate that the electronic band structure in FeSe undergoes a rather intricate momentum-dependent behavior, possibly consistent with either the bond-type ordering of the iron dxy, dxz and dyz orbitals when crossing Ts [40, 56, 60, 62], the non-trivial energy splitting between the Γ and M point of the Brillouin zone [53, 59], leading to a band shift reversion [59], or finally the orbital-dependent Fermi-surface shrinking [45]. These scenarios demonstrate a nematicity-driven band reconstruction [33, 63], which is likely reflected in the optical anisotropy in FeSe and could account for its extension in energy and the change of sign in ΔRratio, as observed between 1,000 and 3,000 cm−1 (Figures 2A, 3). The optical anisotropy further implies an important reshuffling of spectral weight, occurring at larger energy scales than the characteristic ones set by the critical (structural) transition temperatures. This latter observation is another manifestation of the strong orbital-selective electronic correlations in FeSe [48, 49, 64–66]. In this context, recent ARPES results [67] imply that the dxz orbital has a larger quasi-particle spectral weight and a smaller spectral weight in the Hubbard band compared to the dyz orbital. This may be interpreted in terms of a more coherent dxz orbital than the dyz orbital inside the nematic phase; a result which further highlights the importance of electronic correlations in the description of nematicity [67].
The optical conductivity allows accessing all parameters, which determine the transport properties; the scattering rate and the plasma frequency of the itinerant charge carriers. They can be extracted phenomenologically within the well-established Drude–Lorentz fit procedure [32], which we did successfully apply in the past for the 122-materials [68, 69]. By recalling that the complex optical conductivity relates to the complex dielectric function as
Besides several Lorentz harmonic oscillators (h.o.) for the finite frequency excitations we consider two Drude terms, a narrow (N) and a broad (B) one, accounting for the multi-band nature of iron-based superconductors [70]. ΓN/B and ωpN/B are respectively the width at half-maximum (scattering rate) and the plasma frequency
Here, we will argue on the Drude parameters only (for additional informations on the overall fit results, please consult Ref. [26]), since the link to the (anisotropic) dc transport properties [34] is at the center of our interest. We consider the ratio of the fit parameters between the a- and b-axis, in order to shed light on their own anisotropy. Figure 5 then shows the anisotropy of
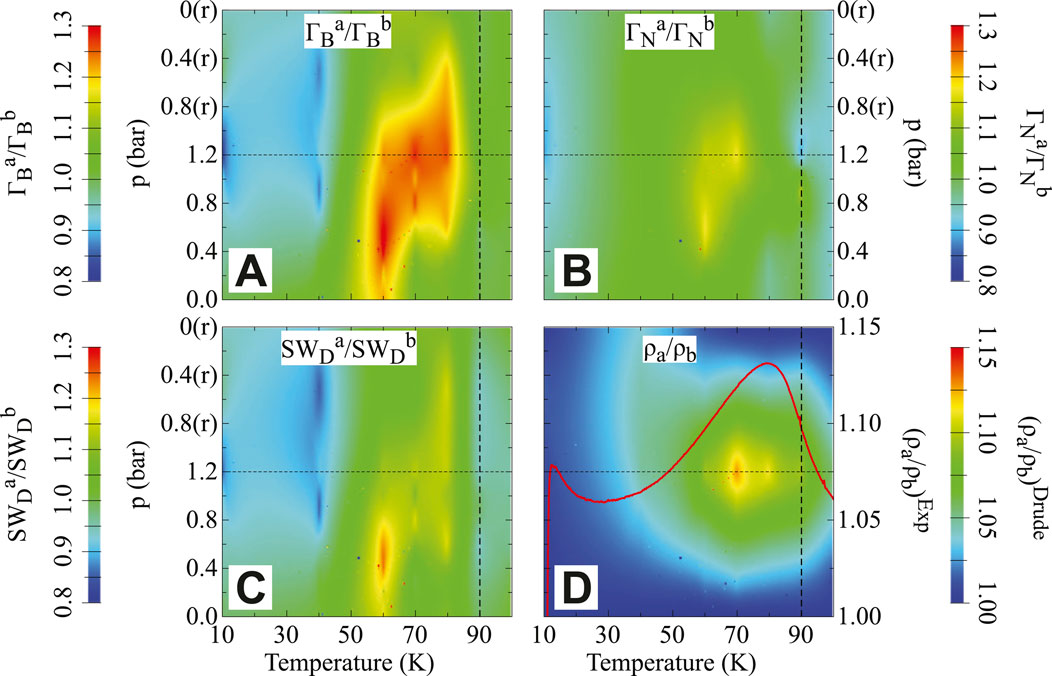
FIGURE 5. (color online) (A–C) T and p dependence of the anisotropy of both scattering rates
The dc resistivity can be directly reconstructed within the Drude approach and by exploiting the corresponding parameters
Figure 6 presents the results of our analysis from a slightly different perspective, with the aim to elaborate on possible ingredients for nematicity in FeSe. In fact, it displays the T dependence of the anisotropic Drude parameters at saturation, compared to the average dc resistivity [34]. It is worth remembering that the anisotropy in all Drude quantities is mostly evident around 60–70 K, consistent with the anisotropy of the dc transport properties for the strained sample (Figure 5D). Being at odds with early conclusions drawn from our optical results in 122-materials [68, 69], Figure 6 suggests that the Drude weight has a less strong impact on the T dependence of the dc resistivity (Figure 6C) than the scattering rates for both narrow and broad Drude terms. Stated more specifically, we can convincingly affirm that the scattering rates closely follow the dc resistivity as a function of T (Figures 6A,B). Previous conjectures [73], that inelastic scattering of electrons (e.g., off magnetic fluctuations) would mainly affect the dc transport properties, find here a unique support, as given by the dominant role of our phenomenological Drude scattering rates.
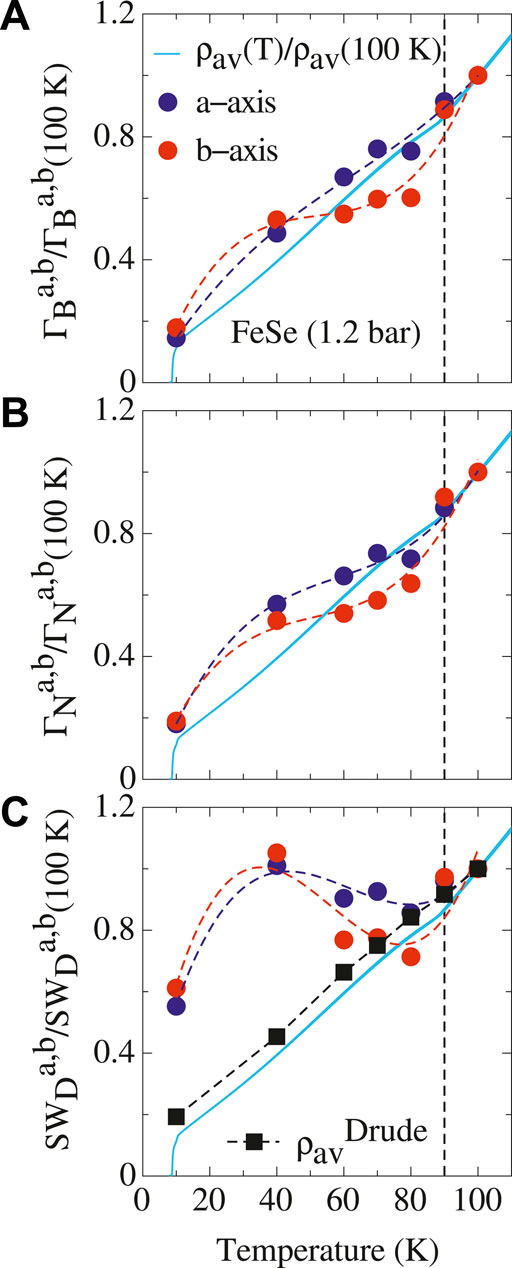
FIGURE 6. (color online) (A–C) T dependence of the anisotropic scattering rates
Ideas for nematicity underpinned by magnetic interactions even when nematic order precedes the magnetic one were motivated by the frequently observed intimate coupling between structure and magnetism in iron-based materials [14, 73, 74]. Magnetic fluctuations at T > TN would then cause the tetragonal-to-orthorhombic transition in iron-pnictides (e.g., the 122-materials). Likewise, FeSe with (and despite) TN ∼ 0 may dissimulate the same mechanism. Interestingly, the dc resistivity anisotropy Δρ = ρa − ρb in FeSe could arise from the convolution of two functions: the order parameter of the nematic phase transition (Figure 4), which breaks the same symmetry as Δρ and therefore it is proportional to it, and a proportionality factor monotonically decreasing in T [34], so that an overall dome-like T dependence peaked at ∼ 70 K (Figure 5D) would arise. A natural explanation for the T dependence of the proportionality factor derives from inelastic scattering, for instance by anisotropic magnetic excitations [34]. Indeed, the electronic scattering rates in Figures 6A,B exhibit such a T dependence. In conjunction with the nematic order parameter (Figure 4) the scattering rate then conspires in order to reproduce the resistivity anisotropy (Figure 5D). We thus speculate that the low-energy charge dynamics of FeSe is a quite direct fingerprint of a scenario for which the spin fluctuations together with the high-energy orbital ordering apparently assume a rather dominant role in connection with the onset of nematicity. Recent resonant inelastic x-ray scattering data below Ts underline a matchless strong spin-excitations anisotropy, which suggests a primarily spin-driven nematic phase transition [75]. Spin fluctuations are also an important ingredient as driving force for superconductivity [76], as advanced from recent NMR measurements [77], ARPES data [40] as well as inelastic neutron scattering investigations [78, 79].
We start off this section with a comprehensive view of the collected R(ω) data within the p-loop experiment at 10 K (Figures 7A,B) [27]. The chosen T is well within the superconducting state and the displayed data were collected after a ZPC protocol. There is an obvious metallic behaviour of the overall R(ω) spectra along the a- and b-axis. The measured quantity along both axes approaches total reflection at finite frequencies below νg ∼ 180 cm−1, as expected at T < Tc [32]. We note the great agreement of our data at p = 0 (averaged between the two axes) and for all T with those in Refs. [80–85], which comprehensively address the electrodynamic response both above and below Tc in un-stressed Ba1−xKxFe2As2 samples. We encounter a reversible anisotropy of R(ω) upon sweeping p, which can be further emphasized by the calculation of the reflectivity ratio RRatio = Ra/Rb, shown in Figure 7C. In the FIR range around 600 cm−1, RRatio drops below 1 (i.e., the isotropic situation) upon reaching 1.2 bar (i.e., corresponding to the saturation limit for this sample). RRatio reconverts then to unity when p is released back to zero. From the measured R(ω) we achieve σ1(ω), as shown in Figures 7D,E, and consequently the already introduced dichroism
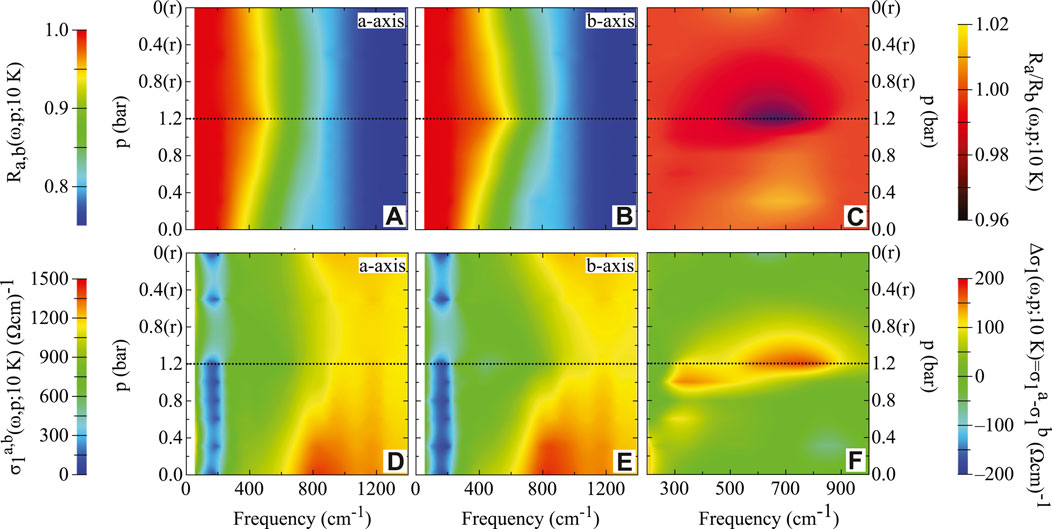
FIGURE 7. (color online) (A,B) Representative data of the optical reflectivity (R(ω)) of Ba0.6K0.4Fe2As2 at 10 K for the p-loop experiment after a ZPC protocol along the a- and b-axis (Ra and Rb, respectively, upper-left panel of Figure 2) in the spectral range below 1,400 cm−1. (C) The reflectivity ratio RRatio = Ra/Rb. (D,E) Real part σ1(ω) of the optical conductivity, achieved through KK transformation of the data in panels (A,B). (F) The dichroism
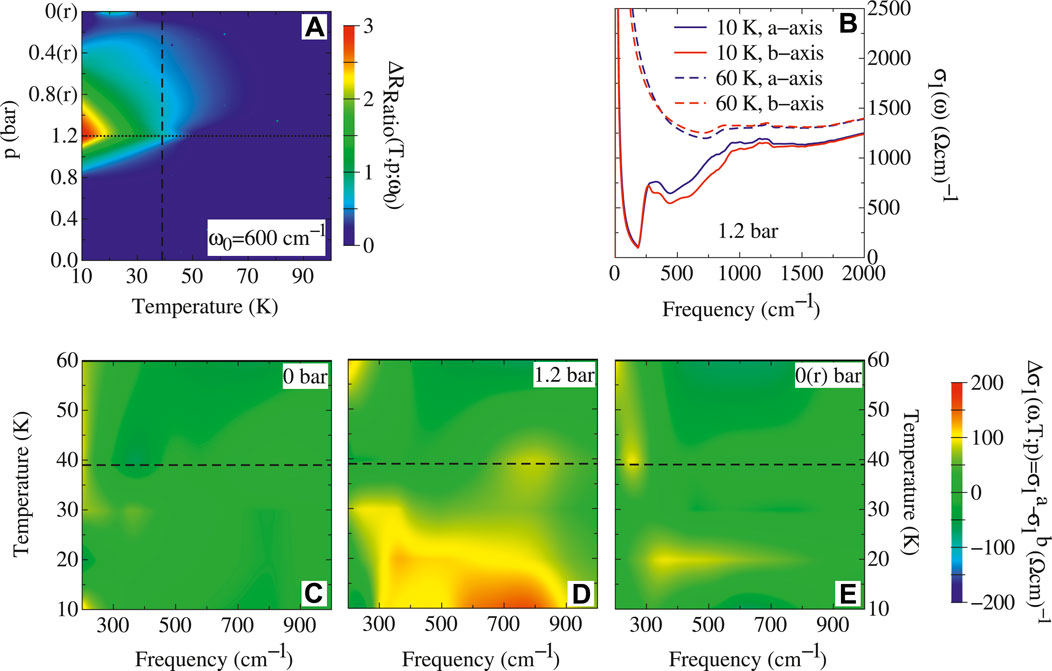
FIGURE 8. (color online) (A) T dependence of the quantity ΔRRatio (ω0) (see text) of Ba0.6K0.4Fe2As2 within the p-loop experiment after a ZPC protocol, which emphasizes the T evolution of the p-induced optical anisotropy. We choose ω0 = 600 cm−1. The thick dotted line marks p = 1.2 bar (i.e., at saturation). (B) Measured σ1(ω) at 10 K (i.e., T < Tc) and 60 K (i.e., T > Tc) for p = 1.2 bar along both crystallographic axes. (C,E) T dependence of Δσ1(ω) at the selected p of 0, 1.2 and released 0 bar. These panels focus the attention to the FIR energy interval 200–1,000 cm−1, thus emphasising the reversible optical anisotropy upon sweeping p. The thick dashed line in panels (A) and (C–E) indicates Tc. A first-neighbor interpolation procedure is used in order to generate the color maps. Released p is denoted by “(r)”. Reproduced from Ref. [27].
So far, we could provide a clear-cut evidence for an optical anisotropy, which is p-induced in the tetragonal structure of Ba0.6K0.4Fe2As2 at T = 10 K
Our present data of Ba0.6K0.4Fe2As2 bear testimony to a p-induced anisotropy of the excitation spectrum, which mirrors nematicity and seems to be a generic feature in 122 iron-based superconductors [28, 29, 68, 69] even into the optimally-doped regime, similar to the dc transport properties [19]. We discover that the optical anisotropy in the optimally K-doped 122-compound occurs at the low FIR energy scales, relevant to the superconducting gap(s) (Figure 7F and Figure 8C–E). This is peculiar with respect to the previously investigated underdoped 122-materials and FeSe [25, 26, 28, 29, 68, 69], for which the optical anisotropy extends up to high energy scales. Our findings in Ba0.6K0.4Fe2As2 thus tend to exclude the involvement of bands deep into the electronic structure and potentially imply a less prominent impact of orbital ordering in the optimally doped than in the underdoped regime. Ergo, the p-induced optical anisotropy in Ba0.6K0.4Fe2As2 elucidates the response of the conduction bands to an external symmetry breaking field. For instance, the deployed optical response and its p dependence flag the imprint of (anisotropic) scattering, uncovering some kind of spin-orbital interplay, so that the p-induced nematicity is caused by spin fluctuations and is vestigial to stripe magnetism [16]. This would directly influence the energy scales close to the Fermi level, ultimately of relevance for the transport properties as well as superconductivity. Moreover and beyond nematicity, Raman results equally make a strong case for a pairing mechanism for superconductivity mediated by spin fluctuations [86]. In addition, a so-called differentiation of the orbital effective masses and related anisotropy, which is further enhanced by the presence of strong electronic correlations above all in hole-doped materials [46], can be alike installed by uniaxial stress, as applied here in our experiment. This impairs the optical response of the conduction bands as well and could be also reflected in an anisotropic reshuffling of spectral weight at T < Tc between the superconducting collective mode and the FIR energies (Figures 8C–E) [87].
We conclude this review by summarising the major outcomes of our optical studies in selected iron-based superconductors and projecting the treated topics into possible future directions.
First of all, within one single experiment we disclose all relevant ingredients (order parameter and Drude quantities, Figures 4, 5), which were shown to fully determine the anisotropy in the charge dynamics as well as in the dc transport properties of FeSe. It is worth warning the readership that the interplay between the orbital order [25, 28, 29] and the intertwined anisotropy of the Drude parameters (Figure 5) cannot be neglected when addressing the complete excitation spectrum [45, 68, 69, 71]. Having said that, the inelastic scattering by magnetic fluctuations rather than the Fermi surface parameters seems to shape the nematic anisotropy in the dc limit (Figure 6). Proposals advocating a close connection between spin fluctuations, nematicity (i.e., orbital order) and superconductivity [15, 16] would be reasonably promoted by our findings, since they give ample support for the role played by magnetic interactions. In a broader context and looking ahead, it could be of interest to systematically compare our results with data collected across the whole T versus doping phase diagram of representative iron-based superconductors, and to exploit the broadband optical anisotropy, addressed here, in order to precisely test the impact of doping-induced disorder [88], thus expanding at finite frequencies the debate already addressed by dc transport investigations [89–91].
Second, the p-induced optical anisotropy in (optimally doped) Ba0.6K0.4Fe2As2 only at T < Tc (Figure 8A) is an astonishing fingerprint that the electronic structure is extremely susceptible to symmetry breaking stress below Tc. In Ref. [87], we additionally discover that our findings (Figure 7) imply the presence of p-induced anisotropic gaps between both axes at T ≪ Tc. Chasing the implications of the gap anisotropy with respect to the debate on the dominant pairing symmetry [86, 92, 93] goes beyond the scope of this work. Nonetheless, the unprecedented anisotropic charge dynamics deep into the superconducting dome is contingently consistent with recent observations of nematic superconductivity in compounds with similar doping [94–96] as well as in LiFeAs [97]. This is a pretty strong speculation, which needs to be challenged with adhoc ascertainments. As outlook, it remains to be seen whether an orbital-selective pairing, eventually supplemented by the guiding principle of spin fluctuations as proposed for FeSe [76, 98–101], may explain the anisotropy of the superconducting gap. This would also shed new light on the putative relationship between quantum critical nematic fluctuations and unconventional superconductivity [21, 22]. In this respect, interrogating the exact extent to which uniaxial stress couple to nematic fluctuations will be of paramount importance and is a task left to the future.
The author confirms being the sole contributor of this work and has approved it for publication.
The author declares that the research was conducted in the absence of any commercial or financial relationships that could be construed as a potential conflict of interest.
All claims expressed in this article are solely those of the authors and do not necessarily represent those of their affiliated organizations, or those of the publisher, the editors and the reviewers. Any product that may be evaluated in this article, or claim that may be made by its manufacturer, is not guaranteed or endorsed by the publisher.
The author wishes to thank C. Mirri, M. Chinotti and A. Pal for the data collection and analysis, as reported in the original, quoted references, as well as R. Fernandes, M. Schütt, L. Benfatto, L. Fanfarillo, B. Valenzuela, E. Bascones, M. Watson, R. Lobo, A. Chubukov, P. Hirschfeld, W. Ku and D. Lu for fruitful discussions. This work was supported by the Swiss National Foundation for the Scientific Research.
1. Fradkin E, Kivelson SA, Lawler MJ, Eisenstein JP, Mackenzie AP. Nematic Fermi Fluids in Condensed Matter Physics. Annu Rev Condens Matter Phys (2010) 1:153–78. doi:10.1146/annurev-conmatphys-070909-103925
2. Fradkin E, Kivelson SA. Electron Nematic Phases Proliferate. Science (2010) 327:155–6. doi:10.1126/science.1183464
4. Fernandes RM, Coldea AI, Ding H, Fisher IR, Hirschfeld PJ, Kotliar G. Iron Pnictides and Chalcogenides: a New Paradigm for Superconductivity. Nature (2022) 601:35–44. doi:10.1038/s41586-021-04073-2
5. Fisher IR, Degiorgi L, Shen ZX. In-plane Electronic Anisotropy of Underdoped '122' Fe-Arsenide Superconductors Revealed by Measurements of Detwinned Single Crystals. Rep Prog Phys (2011) 74:124506. doi:10.1088/0034-4885/74/12/124506
6. Tanatar MA, Kreyssig A, Nandi S, Ni N, Bud’ko SL, Canfield PC, et al. Direct Imaging of the Structural Domains in the Iron Pnictides AFe2As2 (A=Ca,Sr,Ba). Phys Rev B (2009) 79:180508. doi:10.1103/physrevb.79.180508
7. Chu J-H, Kuo H-H, Analytis JG, Fisher IR. Divergent Nematic Susceptibility in an Iron Arsenide Superconductor. Science (2012) 337:710–2. doi:10.1126/science.1221713
8. Kuo H-H, Shapiro MC, Riggs SC, Fisher IR. Measurement of the Elastoresistivity Coefficients of the Underdoped Iron Arsenide Ba(Fe0.975Co0.025)2As2. Phys Rev B (2013) 88:085113. doi:10.1103/physrevb.88.085113
9. Gallais Y, Fernandes RM, Paul I, Chauvière L, Yang Y-X, Méasson M-A, et al. Observation of Incipient Charge Nematicity in Ba(Fe1−XCoX)2As2. Phys Rev Lett (2013) 111:267001. doi:10.1103/physrevlett.111.267001
10. Wu S-F, Richard P, Ding H, Wen H-H, Tan G, Wang M, et al. Superconductivity and Electronic Fluctuations in Ba1−xKxFe2As2 Studied by Raman Scattering. Phys Rev B (2017) 95:085125. doi:10.1103/PhysRevB.95.085125
11. Wu SF, Zhang WL, Li L, Cao HB, Kung HH, Sefat AS, et al. (2017) arXiv:1712.06066 [cond-mat.supr-con]. Available at: https://arxiv.org/abs/1712.06066.
12. Böhmer AE, Burger P, Hardy F, Wolf T, Schweiss P, Fromknecht R, et al. Nematic Susceptibility of Hole-Doped and Electron-Doped BaFe2As2 Iron-Based Superconductors from Shear Modulus Measurements. Phys Rev Lett (2014) 112:047001. doi:10.1103/PhysRevLett.112.047001
13. Fradkin E, Kivelson SA, Tranquada JM. Colloquium: Theory of Intertwined Orders in High Temperature Superconductors. Rev Mod Phys (2015) 87:457–82. doi:10.1103/revmodphys.87.457
14. Fernandes RM, Chubukov AV, Schmalian J. What Drives Nematic Order in Iron-Based Superconductors? Nat Phys (2014) 10:97–104. doi:10.1038/nphys2877
15. Glasbrenner JK, Mazin II, Jeschke HO, Hirschfeld PJ, Fernandes RM, Valentí R. Effect of Magnetic Frustration on Nematicity and Superconductivity in Iron Chalcogenides. Nat Phys (2015) 11:953–8. doi:10.1038/nphys3434
16. Chubukov AV, Khodas M, Fernandes RM. Magnetism, Superconductivity, and Spontaneous Orbital Order in Iron-Based Superconductors: Which Comes First and Why?. Phys Rev X (2016) 6:041045. doi:10.1103/physrevx.6.041045
17. Hsu F-C, Luo J-Y, Yeh K-W, Chen T-K, Huang T-W, Wu PM, et al. Superconductivity in the PbO-type Structure -FeSe. Proc Natl Acad Sci (2008) 105:14262–4. doi:10.1073/pnas.0807325105
18. McQueen TM, Williams AJ, Stephens PW, Tao J, Zhu Y, Ksenofontov V, et al. Tetragonal-to-Orthorhombic Structural Phase Transition at 90 K in the Superconductor Fe1.01Se. Phys Rev Lett (2009) 103:057002. doi:10.1103/physrevlett.103.057002
19. Kuo H-H, Chu J-H, Palmstrom JC, Kivelson SA, Fisher IR. Ubiquitous Signatures of Nematic Quantum Criticality in Optimally Doped Fe-Based Superconductors. Science (2016) 352:958–62. doi:10.1126/science.aab0103
20. Metlitski MA, Mross DF, Sachdev S, Senthil T. Cooper Pairing in Non-fermi Liquids. Phys Rev B (2015) 91:115111. doi:10.1103/physrevb.91.115111
21. Lederer S, Schattner Y, Berg E, Kivelson SA. Enhancement of Superconductivity Near a Nematic Quantum Critical Point. Phys Rev Lett (2015) 114:097001. doi:10.1103/physrevlett.114.097001
22. Nie L, Tarjus G, Kivelson SA. Quenched Disorder and Vestigial Nematicity in the Pseudogap Regime of the Cuprates. Proc Natl Acad Sci (2014) 111:7980–5. doi:10.1073/pnas.1406019111
23. Fujita K, Kim CK, Lee I, Lee J, Hamidian MH, Firmo IA, et al. Simultaneous Transitions in Cuprate Momentum-Space Topology and Electronic Symmetry Breaking. Science (2014) 344:612–6. doi:10.1126/science.1248783
24. Böhmer AE, Hardy F, Wang L, Wolf T, Schweiss P, Meingast C. Superconductivity-Induced Re-Entrance of the Orthorhombic Distortion in Ba1−xKxFe2As2. Nat Commun (2015) 6:7911. doi:10.1038/ncomms8911
25. Chinotti M, Pal A, Degiorgi L, Böhmer AE, Canfield PC. Optical Anisotropy in the Electronic Nematic Phase of FeSe. Phys Rev B (2017) 96:121112. doi:10.1103/physrevb.96.121112
26. Chinotti M, Pal A, Degiorgi L, Böhmer AE, Canfield PC. Ingredients for the Electronic Nematic Phase in FeSe Revealed by its Anisotropic Optical Response. Phys Rev B (2018) 98:094506. doi:10.1103/physrevb.98.094506
27. Pal A, Chinotti M, Chu J-H, Kuo H-H, Fisher IR, Degiorgi L. Optical Anisotropy in Optimally Doped Iron-Based Superconductor. Npj Quant Mater (2019) 4:3. doi:10.1038/s41535-018-0140-1
28. Mirri C, Dusza A, Bastelberger S, Chu J-H, Kuo H-H, Fisher IR, et al. Hysteretic Behavior in the Optical Response of the Underdoped Fe-Arsenide Ba(Fe1–xCox)2As2 in the Electronic Nematic Phase. Phys Rev B (2014) 89:060501. doi:10.1103/physrevb.89.060501
29. Mirri C, Dusza A, Bastelberger S, Chu J-H, Kuo H-H, Fisher IR, et al. Nematic-driven Anisotropic Electronic Properties of Underdoped detwinned Ba(Fe1−xCox)2As2 Revealed by Optical Spectroscopy. Phys Rev B (2014) 90:155125. doi:10.1103/physrevb.90.155125
30. Dusza A, Lucarelli A, Pfuner F, Chu J-H, Fisher IR, Degiorgi L. Anisotropic Charge Dynamics in Detwinned Ba(Fe1−xCox)2As2. Epl (2011) 93:37002. doi:10.1209/0295-5075/93/37002
31. Nakajima M, Liang T, Ishida S, Tomioka Y, Kihou K, Lee CH, et al. Unprecedented Anisotropic Metallic State in Undoped Iron Arsenide BaFe2As2 Revealed by Optical Spectroscopy. Proc Natl Acad Sci (2011) 108:12238–42. doi:10.1073/pnas.1100102108
33. Wang H, Ye Z, Zhang Y, Wang N. Band Structure Reconstruction across Nematic Order in High Quality FeSe Single crystal as Revealed by Optical Spectroscopy Study. Sci Bull (2016) 61:1126–31. doi:10.1007/s11434-016-1102-2
34. Tanatar MA, Böhmer AE, Timmons EI, Schütt M, Drachuck G, Taufour V, et al. Origin of the Resistivity Anisotropy in the Nematic Phase of FeSe. Phys Rev Lett (2016) 117:127001. doi:10.1103/physrevlett.117.127001
35. Lu X, Tseng K-F, Keller T, Zhang W, Hu D, Song Y, et al. Impact of Uniaxial Pressure on Structural and Magnetic Phase Transitions in Electron-Doped Iron Pnictides. Phys Rev B (2016) 93:134519. doi:10.1103/physrevb.93.134519
36.The stress-induced orthorhombicity in FeSe above Ts can be reasonably estimated for effectively applied stress of about 18 MPa (i.e., at saturation) from the elastic constant and x-ray diffraction data [102, 103]. It is comparable to values measured in BaFe2As2 [35].
37. Koch RJ, Konstantinova T, Abeykoon M, Wang A, Petrovic C, Zhu Y, et al. Room Temperature Local Nematicity in FeSe Superconductor. Phys Rev B (2019) 100:020501. doi:10.1103/physrevb.100.020501
38. Kasahara S, Shi HJ, Hashimoto K, Tonegawa S, Mizukami Y, Shibauchi T, et al. Electronic Nematicity above the Structural and Superconducting Transition in BaFe2(As1−xPx)2. Nature (2012) 486:382–5. doi:10.1038/nature11178
39. Shimojima T, Motoyui Y, Taniuchi T, Bareille C, Onari S, Kontani H, et al. Discovery of Mesoscopic Nematicity Wave in Iron-Based Superconductors. Science (2021) 373:1122–5. doi:10.1126/science.abd6701
40. Rhodes LC, Eschrig M, Kim TK, Watson MD, (2022), and references therein, arXiv:2201.11702 [cond-mat.supr-con]. Available at: https://arxiv.org/abs/2201.11702.
41. Chen C-C, Maciejko J, Sorini AP, Moritz B, Singh RRP, Devereaux TP. Orbital Order and Spontaneous Orthorhombicity in Iron Pnictides. Phys Rev B (2010) 82:100504. doi:10.1103/physrevb.82.100504
42. Lee C-C, Yin W-G, Ku W. Ferro-Orbital Order and Strong Magnetic Anisotropy in the Parent Compounds of Iron-Pnictide Superconductors. Phys Rev Lett (2009) 103:267001. doi:10.1103/physrevlett.103.267001
43. Lv W, Krüger F, Phillips P. Orbital Ordering and Unfrustrated (π,0) Magnetism from Degenerate Double Exchange in the Iron Pnictides. Phys Rev B (2010) 82:045125. doi:10.1103/physrevb.82.045125
44. Daghofer M, Luo Q-L, Yu R, Yao DX, Moreo A, Dagotto E. Orbital-weight Redistribution Triggered by Spin Order in the Pnictides. Phys Rev B (2010) 81:180514. doi:10.1103/physrevb.81.180514
45. Fanfarillo L, Mansart J, Toulemonde P, Cercellier H, Le Fèvre P, Bertran F, et al. Orbital-dependent Fermi Surface Shrinking as a Fingerprint of Nematicity in FeSe. Phys Rev B (2016) 94:155138. doi:10.1103/physrevb.94.155138
46. Fanfarillo L, Giovannetti G, Capone M, Bascones E. Nematicity at the Hund's Metal Crossover in Iron Superconductors. Phys Rev B (2017) 95:144511. doi:10.1103/physrevb.95.144511
47. Benfatto L, Cappelluti E. Effects of the Fermi-Surface Shrinking on the Optical Sum Rule in Pnictides. Phys Rev B (2011) 83:104516. doi:10.1103/physrevb.83.104516
48. Watson MD, Backes S, Haghighirad AA, Hoesch M, Kim TK, Coldea AI, et al. Formation of Hubbard-Like Bands as a Fingerprint of Strong Electron-Electron Interactions in FeSe. Phys Rev B (2017) 95:081106. doi:10.1103/physrevb.95.081106
49. Evtushinsky DV, Aichhorn M, Sassa Y, Liu ZH, Maletz J, Wolf T, et al. (2016), arXiv:1612.02313 [cond-mat.supr-con]. Available at: https://arxiv.org/abs/1612.02313.
50. Baek S-H, Efremov DV, Ok JM, Kim JS, van den Brink J, Büchner B. Orbital-driven Nematicity in FeSe. Nat Mater (2015) 14:210–4. doi:10.1038/nmat4138
51. Böhmer AE, Arai T, Hardy F, Hattori T, Iye T, Wolf T, et al. Origin of the Tetragonal-to-Orthorhombic Phase Transition in FeSe: A Combined Thermodynamic and NMR Study of Nematicity. Phys Rev Lett (2015) 114:027001. doi:10.1103/PhysRevLett.114.027001
52. Cao RX, Hu J, Dong J, Zhang JB, Ye XS, Xu YF, et al. Observation of Orbital Ordering and Origin of the Nematic Order in FeSe. New J Phys (2019) 21:103033. doi:10.1088/1367-2630/ab4927
53. Nakayama K, Miyata Y, Phan GN, Sato T, Tanabe Y, Urata T, et al. Reconstruction of Band Structure Induced by Electronic Nematicity in an FeSe Superconductor. Phys Rev Lett (2014) 113:237001. doi:10.1103/physrevlett.113.237001
54. Zhang P, Qian T, Richard P, Wang XP, Miao H, Lv BQ, et al. Observation of Two Distinctdxz/dyzband Splittings in FeSe. Phys Rev B (2015) 91:214503. doi:10.1103/physrevb.91.214503
55. Suzuki Y, Shimojima T, Sonobe T, Nakamura A, Sakano M, Tsuji H, et al. Momentum-dependent Sign Inversion of Orbital Order in Superconducting FeSe. Phys Rev B (2015) 92:205117. doi:10.1103/physrevb.92.205117
56. Watson MD, Kim TK, Rhodes LC, Eschrig M, Hoesch M, Haghighirad AA, et al. Evidence for Unidirectional Nematic Bond Ordering in FeSe. Phys Rev B (2016) 94:201107. doi:10.1103/physrevb.94.201107
57. Fedorov A, Yaresko A, Kim TK, Kushnirenko Y, Haubold E, Wolf T, et al. Effect of Nematic Ordering on Electronic Structure of FeSe. Sci Rep (2016) 6:36834. doi:10.1038/srep36834
58. Pustovit YV, Kordyuk AA. Metamorphoses of Electronic Structure of FeSe-Based Superconductors (Review Article). Low Temperature Phys (2016) 42:995–1007. doi:10.1063/1.4969896
59. Zhang Y, Yi M, Liu Z-K, Li W, Lee JJ, Moore RG, et al. Distinctive Orbital Anisotropy Observed in the Nematic State of a FeSe Thin Film. Phys Rev B (2016) 94:115153. doi:10.1103/physrevb.94.115153
60. Watson MD, Haghighirad AA, Rhodes LC, Hoesch M, Kim TK. Electronic Anisotropies Revealed by Detwinned Angle-Resolved Photo-Emission Spectroscopy Measurements of FeSe. New J Phys (2017) 19:103021. doi:10.1088/1367-2630/aa8a04
61. Coldea AI, Watson MD. The Key Ingredients of the Electronic Structure of FeSe. Annu Rev Condens Matter Phys (2018) 9:125–46. doi:10.1146/annurev-conmatphys-033117-054137
62. Jiang K, Hu J, Ding H, Wang Z. Interatomic Coulomb Interaction and Electron Nematic Bond Order in FeSe. Phys Rev B (2016) 93:115138. doi:10.1103/physrevb.93.115138
63. Yi M, Pfau H, Zhang Y, He Y, Wu H, Chen T, et al. Nematic Energy Scale and the Missing Electron Pocket in FeSe. Phys Rev X (2019) 9:041049. doi:10.1103/physrevx.9.041049
64. Yu R, Zhu J-X, Si Q. Orbital Selectivity Enhanced by Nematic Order in FeSe. Phys Rev Lett (2018) 121:227003. doi:10.1103/physrevlett.121.227003
65. Yi M, Zhang Y, Shen Z-X, Lu D. Role of the Orbital Degree of freedom in Iron-Based Superconductors. Npj Quant Mater (2017) 2:57. doi:10.1038/s41535-017-0059-y
66. Huang J, Yu R, Xu Z, Zhu JX, Oh JS, Jiang Q, et al. Correlation-Driven Electronic Reconstruction in FeTe1−xSex. Communications Physics (2022) 5 (1):29. doi:10.1038/s42005-022-00805-6
67. Pfau H, Yi M, Hashimoto M, Chen T, Dai P-C, Shen Z-X, et al. Quasiparticle Coherence in the Nematic State of FeSe. Phys Rev B (2021) 104:L241101. doi:10.1103/physrevb.104.l241101
68. Mirri C, Dusza A, Bastelberger S, Chinotti M, Degiorgi L, Chu J-H, et al. Origin of the Resistive Anisotropy in the Electronic Nematic Phase of BaFe2As2 Revealed by Optical Spectroscopy. Phys Rev Lett (2015) 115:107001. doi:10.1103/physrevlett.115.107001
69. Mirri C, Dusza A, Bastelberger S, Chinotti M, Chu J-H, Kuo H-H, et al. Electrodynamic Response in the Electronic Nematic Phase of BaFe2As2. Phys Rev B (2016) 93:085114. doi:10.1103/physrevb.93.085114
70. Wu D, Barišić N, Kallina P, Faridian A, Gorshunov B, Drichko N, et al. Optical Investigations of the normal and Superconducting States Reveal Two Electronic Subsystems in Iron Pnictides. Phys Rev B (2010) 81:100512. doi:10.1103/physrevb.81.100512
71. Fanfarillo L, Benfatto L, Valenzuela B. Orbital Mismatch Boosting Nematic Instability in Iron-Based Superconductors. Phys Rev B (2018) 97:121109. doi:10.1103/physrevb.97.121109
72. Fernández-Martín R, Fanfarillo L, Benfatto L, Valenzuela B. Anisotropy of the dc Conductivity Due to Orbital-Selective Spin Fluctuations in the Nematic Phase of Iron Superconductors. Phys Rev B (2019) 99:155117. doi:10.1103/PhysRevB.99.155117
73. Schütt M, Schmalian J, Fernandes RM. Origin of DC and AC Conductivity Anisotropy in Iron-Based Superconductors: Scattering Rate Versus Spectral Weight Effects. Phys Rev B (2016) 94:075111. doi:10.1103/PhysRevB.94.075111
74. Böhmer AE, Kreisel A. Nematicity, Magnetism and Superconductivity in FeSe. J Phys Condensed Matter (2017) 30:023001. doi:10.1088/1361-648x/aa9caa
75. Lu X, Zhang W, Tseng Y, Liu R, Tao Z, Paris E, et al. (2021), arXiv:2108.04484 [cond-mat.supr-con]. Available at: https://arxiv.org/abs/2108.04484.
76. Benfatto L, Valenzuela B, Fanfarillo L. Nematic Pairing from Orbital-Selective Spin Fluctuations in FeSe. Npj Quant Mater (2018) 3:56. doi:10.1038/s41535-018-0129-9
77. Baek S-H, Ok JM, Kim JS, Aswartham S, Morozov I, Chareev D, et al. Separate Tuning of Nematicity and Spin Fluctuations to Unravel the Origin of Superconductivity in FeSe. Npj Quan Mater. (2020) 5:8. doi:10.1038/s41535-020-0211-y
78. Wang Q, Shen Y, Pan B, Hao Y, Ma M, Zhou F, et al. Strong Interplay between Stripe Spin Fluctuations, Nematicity and Superconductivity in FeSe. Nat Mater (2016) 15:159–63. doi:10.1038/nmat4492
79. Chen T, Chen Y, Kreisel A, Lu X, Schneidewind A, Qiu Y, et al. Anisotropic Spin Fluctuations in Detwinned FeSe. Nat Mater (2019) 18:709–16. doi:10.1038/s41563-019-0369-5
80. Li G, Hu WZ, Dong J, Li Z, Zheng P, Chen GF, et al. Probing the Superconducting Energy Gap from Infrared Spectroscopy on a Ba0.6K0.4Fe2As2 Single Crystal with Tc=37 K. Phys Rev Lett (2008) 101:107004. doi:10.1103/physrevlett.101.107004
81. Charnukha A, Dolgov OV, Golubov AA, Matiks Y, Sun DL, Lin CT, et al. Eliashberg Approach to Infrared Anomalies Induced by the Superconducting State of Ba0.68K0.32Fe2As2 Single Crystals. Phys Rev B (2011) 84:174511. doi:10.1103/physrevb.84.174511
82. Charnukha A, Popovich P, Matiks Y, Sun DL, Lin CT, Yaresko AN, et al. Superconductivity-induced Optical Anomaly in an Iron Arsenide. Nat Commun (2011) 2:219. doi:10.1038/ncomms1223
83. Dai YM, Xu B, Shen B, Xiao H, Wen HH, Qiu XG, et al. Hidden T-Linear Scattering Rate in Ba0.6K0.4Fe2As2 Revealed by Optical Spectroscopy. Phys Rev Lett (2013) 111:117001. doi:10.1103/physrevlett.111.117001
84. Dai YM, Xu B, Shen B, Wen HH, Qiu XG, Lobo RPSM. Optical Conductivity of Ba0.6K0.4Fe2As2: The Effect of In-Plane and Out-Of-Plane Doping in the Superconducting gap. Epl (2013) 104:47006. doi:10.1209/0295-5075/104/47006
85. Xu B, Dai YM, Xiao H, Shen B, Wen HH, Qiu XG, et al. Infrared Probe of the gap Evolution across the Phase Diagram of Ba1−xKxFe2As2. Phys Rev B (2017) 96:115125. doi:10.1103/physrevb.96.115125
86. Kretzschmar F, Muschler B, Böhm T, Baum A, Hackl R, Wen H-H, et al. Raman-Scattering Detection of Nearly Degenerate s-Wave and d-Wave Pairing Channels in Iron-Based Ba0.6K0.4Fe2As2 and Rb0.8Fe1.6Se2 Superconductors. Phys Rev Lett (2013) 110:187002. doi:10.1103/physrevlett.110.187002
87. Pal A, Chinotti M, Chu J-H, Kuo H-H, Fisher IR, Degiorgi L. Anisotropic Superconducting Gap in Optimally Doped Iron-Based Material. J Supercond Nov Magn (2020) 33:2313–8. doi:10.1007/s10948-019-05390-4
88. Carlson EW, Dahmen KA. Using Disorder to Detect Locally Ordered Electron Nematics via Hysteresis. Nat Commun (2011) 2:379. doi:10.1038/ncomms1375
89. Kuo H-H, Fisher IR. Effect of Disorder on the Resistivity Anisotropy Near the Electronic Nematic Phase Transition in Pure and Electron-Doped BaFe2As2. Phys Rev Lett (2014) 112:227001. doi:10.1103/physrevlett.112.227001
90. Ishida S, Nakajima M, Liang T, Kihou K, Lee CH, Iyo A, et al. Anisotropy of the In-Plane Resistivity of Underdoped Ba(Fe1−xCox)2As2 Superconductors Induced by Impurity Scattering in the Antiferromagnetic Orthorhombic Phase. Phys Rev Lett (2013) 110:207001. doi:10.1103/physrevlett.110.207001
91. Nakajima M, Ishida S, Tomioka Y, Kihou K, Lee CH, Iyo A, et al. Effect of Co Doping on the In-Plane Anisotropy in the Optical Spectrum of Underdoped Ba(Fe1−xCox)2As2. Phys Rev Lett (2012) 109:217003. doi:10.1103/physrevlett.109.217003
92. Christianson AD, Goremychkin EA, Osborn R, Rosenkranz S, Lumsden MD, Malliakas CD, et al. Unconventional Superconductivity in Ba0.6K0.4Fe2As2 from Inelastic Neutron Scattering. Nature (2008) 456:930–2. doi:10.1038/nature07625
93. Böhm T, Kemper AF, Moritz B, Kretzschmar F, Muschler B, Eiter H-M, et al. Balancing Act: Evidence for a Strong Subdominant d-Wave Pairing Channel in Ba0.6K0.4Fe2As2. Phys Rev X (2014) 4:041046. doi:10.1103/PhysRevX.4.041046
94. Li J, Pereira PJ, Yuan J, Lv Y-Y, Jiang M-P, Lu D, et al. Nematic Superconducting State in Iron Pnictide Superconductors. Nat Commun (2017) 8:1880. doi:10.1038/s41467-017-02016-y
95. Chen L, Han TT, Cai C, Wang ZG, Wang YD, Xin ZM, et al. Orbital-dependent Modulation of the Superconducting gap in Uniaxially Strained Ba0.6K0.4Fe2As2. Phys Rev B (2021) 104:L060502. doi:10.1103/physrevb.104.l060502
96. Dong Y, Lv Y, Xu Z, Abdel-Hafiez M, Vasiliev AN, Zhu H, et al. Observation of a Ubiquitous (π, π)-Type Nematic Superconducting Order in the Whole Superconducting Dome of Ultra-thin BaFe2−xNixAs2 Single Crystals. Chin Phys. Lett. (2021) 38:097401. doi:10.1088/0256-307x/38/9/097401
97. Kushnirenko YS, Evtushinsky DV, Kim TK, Morozov I, Harnagea L, Wurmehl S, et al. Nematic Superconductivity in LiFeAs. Phys Rev B (2020) 102:184502. doi:10.1103/physrevb.102.184502
98. Sprau PO, Kostin A, Kreisel A, Böhmer AE, Taufour V, Canfield PC, et al. Discovery of Orbital-Selective Cooper Pairing in FeSe. Science (2017) 357:75–80. doi:10.1126/science.aal1575
99. She J-H, Lawler MJ, Kim E-A. Quantum Spin Liquid Intertwining Nematic and Superconducting Order in Fese. Phys Rev Lett (2018) 121:237002. doi:10.1103/physrevlett.121.237002
100. Liu D, Li C, Huang J, Lei B, Wang L, Wu X, et al. Orbital Origin of Extremely Anisotropic Superconducting Gap in Nematic Phase of FeSe Superconductor. Phys Rev X (2018) 8:031033. doi:10.1103/physrevx.8.031033
101. Hu H, Yu R, Nica EM, Zhu J-X, Si Q. Orbital-selective Superconductivity in the Nematic Phase of FeSe. Phys Rev B (2018) 98:220503. doi:10.1103/physrevb.98.220503
Keywords: nematicity, optical properties, electronic structure, spin fluctuations, orthorhombicity
Citation: Degiorgi L (2022) Optical Fingerprints of Nematicity in Iron-Based Superconductors. Front. Phys. 10:866664. doi: 10.3389/fphy.2022.866664
Received: 31 January 2022; Accepted: 16 February 2022;
Published: 04 April 2022.
Edited by:
Laura Fanfarillo, International School for Advanced Studies (SISSA), ItalyReviewed by:
Andrea Perucchi, Elettra Sincrotrone Trieste, ItalyCopyright © 2022 Degiorgi. This is an open-access article distributed under the terms of the Creative Commons Attribution License (CC BY). The use, distribution or reproduction in other forums is permitted, provided the original author(s) and the copyright owner(s) are credited and that the original publication in this journal is cited, in accordance with accepted academic practice. No use, distribution or reproduction is permitted which does not comply with these terms.
*Correspondence: Leonardo Degiorgi, ZGVnaW9yZ2lAc29saWQucGh5cy5ldGh6LmNo
Disclaimer: All claims expressed in this article are solely those of the authors and do not necessarily represent those of their affiliated organizations, or those of the publisher, the editors and the reviewers. Any product that may be evaluated in this article or claim that may be made by its manufacturer is not guaranteed or endorsed by the publisher.
Research integrity at Frontiers
Learn more about the work of our research integrity team to safeguard the quality of each article we publish.