- 1Smart Power Technology R&D, STMicroelectronics, Agrate Brianza, Italy
- 2Agrate FMT Physical Laboratory, STMicroelectronics, Agrate Brianza, Italy
- 3CNR-IMM, Istituto per la microelettronica e microsistemi, Consiglio Nazionale Delle Ricerche, Catania, Italy
Ge-rich GST alloys are the most promising materials for phase-change memory (PCM) to fulfill the soldering compliance and the tough data retention requirements of automotive applications. Significant efforts have been made to engineer those materials and optimize their integration inside the fabrication process of PCM. In this perspective, the physical characterization of the device and the material is instrumental in understanding the underlying physics, improving the process, and optimizing the interactions between the device, the process, and the material itself. Especially, microscopic investigations have gathered increasing interest, giving detailed descriptions of local material modulations that have a crucial role in cell programming and reliability performances. In this work, a deep analysis of Ge-rich GST microscopic alloy evolution during the integration process has been performed, exploiting analysis by EELS with TEM supported by a novel statistical data post-processing method. The new proposed statistical-based methodology also introduces new simple metrics for elemental compositional evaluations that have been exploited for process engineering.
Introduction
Phase-change memory is the most mature and promising technology among emerging memory concepts, which was developed first for stand-alone applications [1–3], but it has also been considered as embedded memory due to scaling possibilities, overcoming limitations of conventional flash-based approaches, and easy integration in the back-end-of-line (BEOL) [4]. Nevertheless, standard phase change materials (Ge2Sb2Te5) cannot satisfy the general specifications of the consumer and automotive markets, requiring high-temperature data retention in several applications. In fact, conventional Ge2Sb2Te5 has a low crystallization temperature of about 150°C (measured with typical DSC measurements with minute time-range ramps), which is not suitable to guarantee high-temperature data retention of more than 2 years at 150°C as required from automotive applications and 5 min at 260°C from soldering reflow compliance as per JEDEC specifications [1]. On the other hand, the limited retention of standard GST alloy can be addressed by material engineering: since 2011, Cheng et al. [5] have demonstrated the increased thermal stability of phase change materials in the Ge-rich portion of the Ge-Sb-Te ternary diagram, paving the way for the application of PCM technology in the embedded memory market as demonstrated by Zuliani et al. [6] and, more recently, by Arnaud et al. [7, 8] on 28 nm FD-SOI platforms.
Thus, Ge-rich GST alloys play a key role in the development of a reliable industrial solution for PCM, and a detailed characterization of Ge-rich GST physical properties, especially once integrated into devices, has become a crucial need. For this reason, over the last 10 years, great efforts have been made to physically characterize and understand the specific thermal behavior of Ge-rich alloys, with a main focus on phase transition and elemental segregation. XRD, XPS, and Rs(T) measurements give a clear picture of their crystallization dynamics in terms of crystalline phases and electrical properties [9, 10]. In particular, Ge-rich GST alloys crystallize in a composite structure made by two cubic phases, corresponding to fcc Ge2Sb2Te5 and Ge phase, according to the equilibrium phase diagram. This result suggests a crystallization mechanism involving a first Ge phase depletion step that slows down the overall process of crystallization before the whole crystallization of the alloy into two separated compositions: Ge2Sb2Te5 and pure Ge. More recently, transmission electron microscopy (TEM) has been used to complement the information provided by other techniques, giving physical insights into the early stages of crystal phase formation and related local effects that are not easily detectable with integral methods [11, 12].
This analysis has demonstrated the crucial role of microscopic investigation in the characterization of PCM materials, especially because the results can be directly related to programmed cells' physical properties. The microscopic study of non-programmed (or “bulk”) material properties in integrated devices has gathered increasing interest both from structural and chemical points of view [13, 14]. In particular, the latter represents a real challenge for out-of-stoichiometry alloys such as Ge-rich GST, which result at the end of the process in segregated materials characterized by significantly spread composition [9]. In this case, quantitative evaluation with conventional chemical post-analysis methods, i.e., mean and standard deviation of the elements, is not effective, since elemental dispersion is a non-negligible source of noise. Moreover, the intrinsic local nature of TEM analysis and material segregation introduces a high degree of variability in the chemical and physical results, which requires new methods and instruments to be managed.
In this work, we present a new statistical-based methodology of chemical TEM EELS (Electron Energy Loss Spectroscopy) mapping post-elaboration, potentially suitable for any type of out-of-stoichiometry and segregated material, introducing new metrics for elemental evaluation, capable of considering compositional dispersion, and detecting not so obvious hints of material modification. We exploit the developed methodology to study the physics of Ge-rich GST in the function of typical thermal budgets (TBs) involved in back-end-of-line (BEOL) processes, providing, in the end, further optimization of the memory cell through material chemical analysis.
Materials and Methods
As stated in the previous paragraph, a full understanding of the alloy microstructure and chemical properties is necessary to directly correlate process impact and electrical performance. For this reason, in this work, the GST alloy samples were extensively investigated by means of scanning transmission electron microscopy (STEM) related techniques such as dark-field STEM (DF-STEM) for the alloy microstructural characterization, while the chemical properties were investigated by STEM-EELS. DF-STEM and EELS analyses were carried out on electron-transparent lamella obtained by means of focused ion beam (FIB) thinning of cross-section TEM lamellae. The lamellae preparation was performed using a Thermofischer Helios G5UX FIB. In all the cases, particular care was taken to limit the heating and ballistic effects of ion irradiation on GST film during the final ion milling steps. In particular, a new advanced approach has been applied, reducing currents and energies progressively from a value of 30 keV to a value of low keV in order to avoid material amorphization and damage. The STEM images were performed with a Thermofischer Themis Z G3 aberration-corrected scanning transmission electron microscope equipped with an electron gun monochromator operating at 200 kV acceleration voltage. To limit the electron beam damage and effects on the crystallization process, all the STEM images and EELS maps were acquired with a low beam current (0.5 nA). The EELS experiments were performed with the post-column Quantum Gatan imaging filter operating with an energy resolution of 1 eV/channel. The GST elemental maps were obtained with a step size of 8 Å, and the data were processed using the Gatan® GMS Digital Micrograph 3.23 software.
The selected vehicle for our experiment is an integrated PCM cell in wall architecture [6, 15] in 90 nm technology [16]. Bulk analysis has been performed on pristine material inside the PCM device, which is far from the active area. The integrated PCM stack is composed of a 5–10 nm thick under-layer (UL) of Ge2Sb2Te5 and another 40–60 nm thick layer of N-doped Ge-rich GST alloy. In particular, the present alloy has been optimized to fulfill automotive requirements with a crystallization temperature of about 370°C (ramp rate 10°C/min) [6].
Results and Discussion
In Figure 1, a representative chemical analysis of the PCM stack is reported. EELS maps of main elements (Ge, Sb, Te) are shown for both as-deposited and end-of-process material together with their respective elemental plots (Sb vs. Ge, Sb vs. Te, and Te vs. Ge). As evidenced by chemical maps, the as-deposited PCM stack shows a homogeneous distribution of the elements for both UL and Ge-rich alloys. Phase homogeneity of PCM stack layers is also reflected in the elemental scatter plots. As highlighted by orange and red circles in the Sb vs. Ge plot of the as-deposited sample, the presence of two accumulation points for data distribution indicates the coexistence of two different materials, UL and Ge-rich GST, respectively, characterized by well-defined and homogeneous composition within the analyzed map. In particular, the intermediate scatter points represent interface compositions between the two layers, such as the ones Sb-enriched at the UL boundaries. On the other hand, EELS maps of the end-of-process stack show a different situation, which is as follows: areas of different composition are evidenced (see clusters of different coloring in the corresponding EELS maps) and no more distinction with UL is visible. This condition, caused by crystallization and atom diffusion, is also represented in the elemental plots, reporting a unique and spread distribution, ranging in the composition area delimited by UL and Ge-rich GST starting compositions (see dotted circles in the end-of-process Sb vs. Ge plot). In particular, as shown in the plots, point dispersion is mainly focused on two different preferential directions (see green and magenta arrows in Figure 1), giving insights into physical mechanisms for phase segregation in Ge-rich alloys as reported.
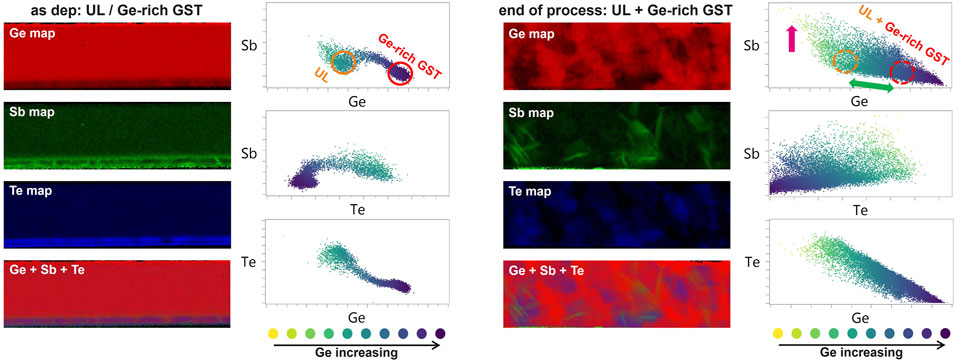
FIGURE 1. Chemical analysis of “as-deposited” and “end-of-process” PCM stack: signal maps of the three main elements (Ge, Sb, and Te) are reported together with elemental scatter plots of Sb vs. Ge, Sb vs. Te, and Te vs. Ge, where the color code from yellow to violet is proportional to Ge content. Superposition of main elements’ signal maps is also reported. Magenta and green arrows in the top right plot indicate the main directional spread of the compositional distribution.
The reported situation evidences the high sensitivity of Ge-rich stacks to process integration, including BEOL TB, resulting at the end of the process in a significantly segregated material, highly variable from a local point of view, with consequent possible variability in reliability and yield performance when integrated into memory devices [13]. Thus, a more in-depth investigation of integrated stack evolution is required to understand segregation dynamics and how to control and improve it.
In this work, we have performed a process evolution study by selecting 10 bulk samples of the integrated PCM stack, picked up from the sequential steps of the BEOL reported in Figure 1 and identified by incremental levels of TB (from T0 to Tfinal). In particular, most of the BEOL process recipes range from ambient temperature to 350°C in timeframes from minutes to hours, while temperatures above 400°C are critical for material integrity. Bulk samples were analyzed by TEM, both morphologically and chemically, as described in the “Material and Methods” paragraph, and a significant subset of them are reported in Figure 2. In the first line of Figure 2, DF-STEM images are shown, evidencing the morphological phase evolution of the PCM stack along with process integration. At the deposition level (T0), UL and Ge-rich alloys have crystalline and amorphous phases, respectively, due to their different crystallization temperatures (see first DF-STEM image in Figure 2). Just after deposition (T1), the PCM stack exhibits an intermediate stage of partial crystallization with grains formation starting from crystalline UL as evidenced in the DF-STEM image by the dotted line. Full crystallization of the stack is visible only at the subsequent level of TB (Tc), resulting in a critical point for temperature dynamics. In fact, after Tc, the material shows a finer evolution, changing crystalline texture and increasing the grain dimensions. Thus, the full crystallization point of temperature dynamics represents a significant break for the physical behavior of the PCM stack, being dominated by amorphous-to-crystal phase transition before Tc and characterized by continuous texture modulation after Tc. In particular, after Tc, PCM stack results are more sensitive to process details and the overall impact of BEOL integration can be observed [13]. Thus, a more rigorous description of the corresponding elemental plots must be performed based on the Tc threshold. In the first part of material evolution (from T0 to Tc), the connection between crystallization and previously observed compositional spread becomes clear: as reported in the elemental plots of Figure 2, passing from the as-deposited step (T0) to fully crystallized material (Tc), it is possible to observe the sequential collapse and spread of distribution points at the intermediate stage (T1), a unique distribution with a center-point between starting compositions is observable, while at full crystallization level (Tc), that unique distribution starts to increase its spread. In particular, the fully crystallized condition (Tc) evidences a peculiar distribution dispersion, mainly focused along a specific preferential direction. This direction corresponds to the Ge increasing and/or Te decreasing axes (see Sb vs. Ge and Sb vs. Te plots). Thus, directional dispersion of elemental distribution is linked to the Ge segregation phenomenon occurring during the crystallization of these alloys [9, 12, 17]. In fact, dispersion along the Ge axis indicates the presence of grains with different Ge content, varying for its expulsion degree from each crystal. For this reason, being Sb vs. Ge compatible and complementary to Sb vs. Te plot (demonstrated also by their correlation reported in each Te vs. Ge plot), in the following we will report only to the Sb vs. Ge plot for chemical analysis. In the second part of the description of elemental plots (from Tc to Tfinal), further physical mechanisms can be derived, highlighting the continuous evolution of the material also from a chemical point of view, in accordance with DF-STEM evidence: grain growth corresponds to dispersion increasing along the preferential Ge axis (from Tc to T5) due to continuous Ge expulsion by segregation, while the appearance of a second dispersion direction (T5—Tfinal), the one along the Sb increasing, indicates the insurgence of new elemental segregation rich in Sb. The latter is clearly visible in the Sb map of the end-of-process PCM stack reported in Figure 1. Sb-rich grains are evidenced in the map, occurring together with the second dispersion increasing.
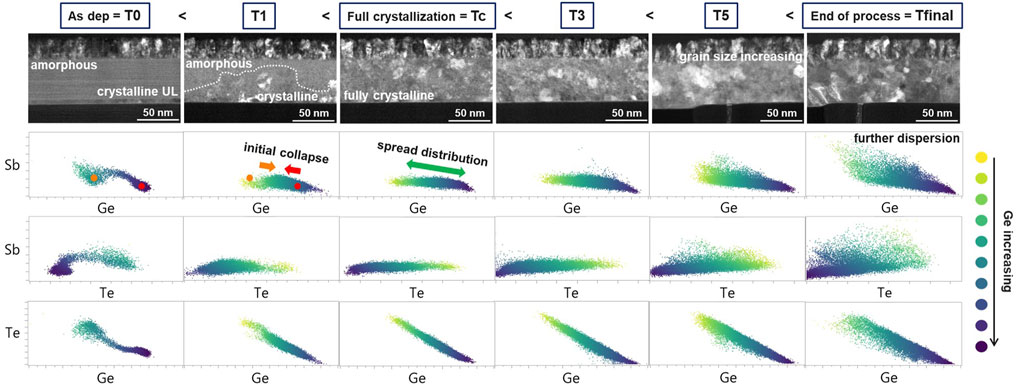
FIGURE 2. Morpho-chemical results of 6 significant BEOL steps along the entire process evolution: in the first line, DF-STEM images of patterned PCM stack are reported, where crystalline and amorphous contrasts are highlighted; in the subsequent lines, elemental scatter plots of Sb vs. Ge, Sb vs. Te, and Te vs. Ge are reported with the main focus on Sb vs. Ge plot.
The described phase segregations, rich in Ge or Sb, represent one of the main causes of PCM stack variability at the end of the process. As shown in Figure 3, different EELS acquisitions on the same kind of end-of-process samples, i.e., same PCM stack, same BEOL, and so on, can result in highly variable chemical plots. Despite a denser part of the compositional distribution, similar for center point and extension in all of the cases, each acquisition differs from the others for dispersion and shape of corresponding distributions, making it difficult for elemental evaluation and sample comparison with conventional parameters, such as distribution median or standard deviation. Moreover, the strong directional dispersion of such plots, strictly linked to the physical mechanisms involved as aforementioned, requires a new concept of data analysis for elemental studies. In the following, we propose a new methodology for chemical evaluation, based on a statistical approach, that allows reducing EELS variability by considering only the average behavior of the alloy and introduces new metrics for process dynamics investigation or material modulation comparison. It is worth mentioning that the developed methodology, applied on raw elemental data, aims at gathering descriptive insights into the underlying physics; a rigorous statistical treatment was beyond the scope of the present work.

FIGURE 3. Chemical analysis of different acquisitions performed on 6 areas of the “end-of-process” PCM stack is as follows: superposition of signal maps of main elements (Ge + Sb + Te signals, reported in red, green, and blue, respectively) is reported together with their corresponding Sb vs. Ge scatter plots. Acquisition variability is highlighted.
The proposed method is based on the calculation of the Mahalanobis distance (
where
corresponding to the definition of distribution confidence ellipse, where the value of
and confidence ellipse is parallel to space axes as follows:
where

FIGURE 4. Graphical representation of novel statistical methodology and results: (A) Mahalanobis distance vs Euclidean distance definitions and schematic applications. Red and green points have different distance ratios if calculated by simple Euclidean formula or by considering intrinsic data dispersion; (B) Mahalanobis distance and confidence ellipse concepts are applied on the Sb vs. Ge scatter plots of Figure 3 for 60 and 90% confidence levels. More compact and similar distributions are highlighted.
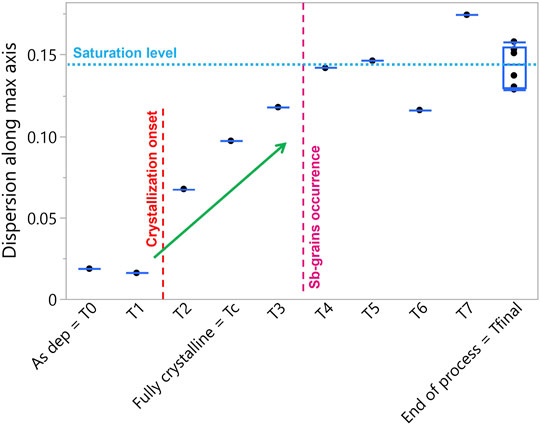
FIGURE 5. Dispersion along the maximum axis of 90% confidence ellipse in function of BEOL steps: red and magenta vertical dotted lines indicate characteristic points of process evolution, “crystallization onset” and “Sb-grains occurrence”; cyan horizontal dotted line indicates saturation level for the dispersion along the maximum axis value after the Sb-rich grains occurrence; green arrow highlights the linear trend of dispersion along the maximum axis with process steps.
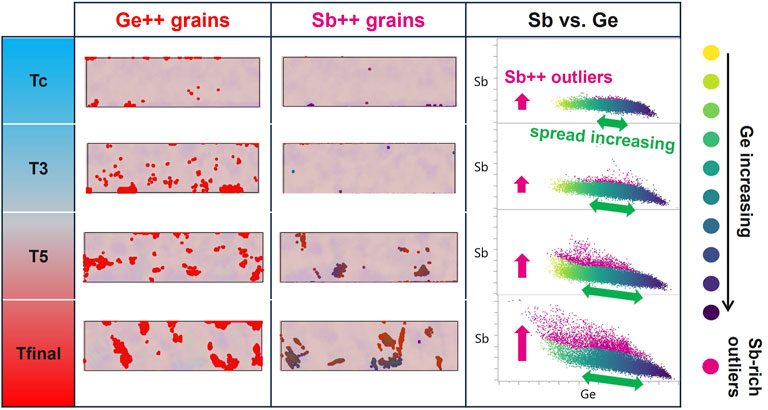
FIGURE 6. Highlights of PCM stack crystal evolution are as follows: “Ge++ grains” column reports signal maps where the highest content of Ge is highlighted; “Sb++ grains” column reports signal maps where Sb-rich outliers are highlighted; “Sb vs. Ge” column reports corresponding scatter plot where Sb-rich outliers (reported in “Sb++ grains” column) are colored in magenta. Magenta and green arrows are a guide for the eyes to highlight outliers’ population and spread increasing respectively.
A better and deeper comprehension of Ge-rich GST alloy thermal dynamics has been reached, revealing new aspects of phase segregation and crystal evolution. In particular, the introduced parameter, i.e., dispersion along the maximum axis, has been proved to describe material behavior with more detail and precision with respect to conventional or graphical analyses, allowing its exploitation as a new evaluation metric for BEOL monitoring and material optimization. For example, this methodology has been applied in the optimization of present BEOL in order to check material segregation and related process variability. In particular, the implemented optimizations are related to TB reduction and BEOL dielectric engineering. Figure 7 reports chemical results for the Ge-rich part of PCM stack integrated into the presently studied process (“old process”) and its tuned version (“optimized process”). Box plots of dispersion along the maximum axis, calculated over different acquisitions on identical samples for both cases, show a non-negligible reduction of its value, indicating the effective modulation of the material through process optimization. The relative elemental plots reported below are aligned to this statement: the distribution referred to as “optimized process” is more compact and less spread with respect to its counterpart, also highlighting the disappearance of the dispersion related to Sb segregation. These observations are further confirmed by morphological results reported in Figure 8. STEM DF images clearly evidence grain size modulation, passing from huge grains of the “old process” to little and more homogeneously distributed crystals of the optimized one. Moreover, chemical maps referred to Ge and Sb segregation show a remarkable reduction of both phenomena, perfectly in accordance with the results of metrics analysis and elemental distribution evidence. Thus, by monitoring dispersion along the maximum axis, a simple and synthetic parameter, it is possible to extract the point of physical evolution at which Ge-rich material has arrived after any thermal or process treatment and predict its physical behavior and properties.
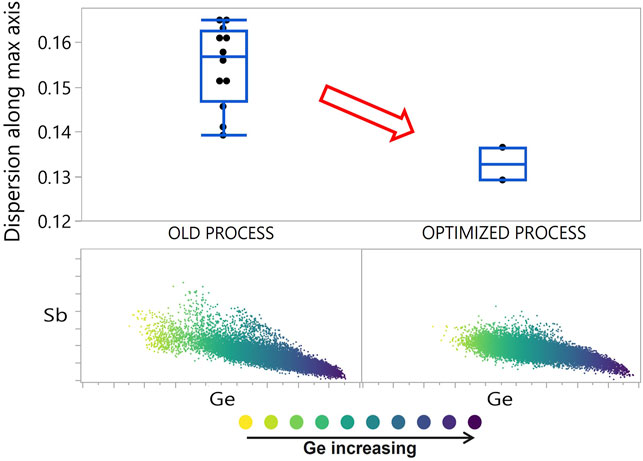
FIGURE 7. Statistical post-analysis of chemical results on “old process” vs. “optimized process”: in the first line, dispersion along the maximum axis box plots are reported, with corresponding elemental scatter plots Sb vs. Ge in the second line. The red arrow highlights decreasing dispersion trend.
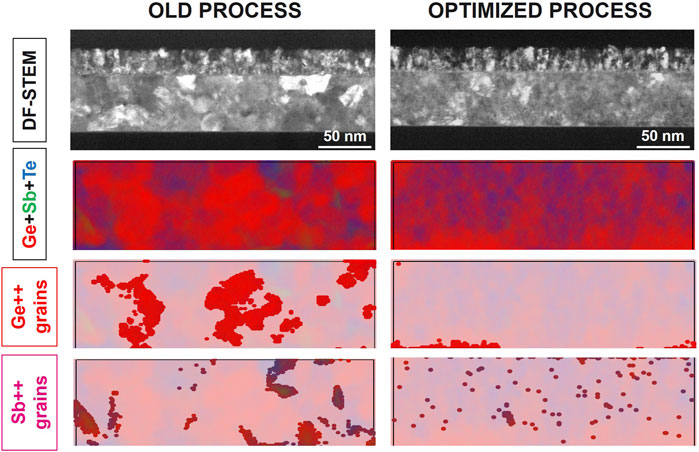
FIGURE 8. Morpho-chemical results of “old process” vs. “optimized process”: in the first line, DF-STEM images are reported, highlighting different crystalline contrasts; in the second line, superposition of main elements’ signal maps (Ge + Sb + Te signals, reported in red, green, and blue, respectively) are reported; in the third and fourth lines, corresponding signal maps are reported, where the highest content of Ge and Sb-rich outliers are highlighted, respectively.
Conclusion
In this study, a microscopic-scale chemical analysis of integrated Ge-rich GST alloy is performed on TEM EELS map data with the main focus on material BEOL evolution and local compositional variability. In particular, a new effective methodology for the post-processing of chemical data of strongly segregated materials has been introduced, exploiting statistical concepts. The statistical-based method presented in this work is capable of 1) reducing observed local variability by effectively screening outlier points of main distribution; 2) introducing new evaluation metrics to quantify and characterize main compositional properties of integrated Ge-rich GST alloys, allowing trials comparison and detection of nontrivial material modulations. In particular, the application of this methodology to the study of Ge-rich material behavior in function of BEOL integration has evidenced, shown the exact trend and peculiar features of the crystallization phenomenon, highlighting crucial physical points with precise parameters. Moreover, the correspondence between studied physical properties, such as degree of crystallization and occurrence of Sb-rich grains, with the adopted statistical concepts, such as dispersion of main distribution and outlier population, respectively, has been proved. Thus, the statistical-based methodology has been demonstrated to be robust and to return effective parameters with relevant physical meaning, allowing process study and material optimization. From this point of view, an example is proposed at the end of the article as follows: exploiting introduced metrics and methodology, an optimized BEOL process has been engineered, minimizing Ge-rich GST material segregation.
Data Availability Statement
The datasets presented in this article are not readily available because they are confidential. Requests to access the datasets should be directed to ZWxpc2EucGV0cm9uaUBzdC5jb20=.
Author Contributions
EP: conceptualization, data interpretation, writing—original draft, supervision, and writing—final review. AS and DC: data acquisition and interpretation and writing—original draft. PT and LM: data acquisition. MS and GN: data interpretation and writing—review, AR: conceptualization, supervision, and writing—final review.
Funding
This work has partially received funding from the European Union’s Horizon 2020 research and innovation program under grant agreement No 824957—BEFOREHAND Project.
Conflict of Interest
Authors EP, AS, DC, PT, LM, and AR were employed by the company STMicroelectronics.
The remaining authors declare that the research was conducted in the absence of any commercial or financial relationships that could be construed as a potential conflict of interest.
Publisher’s Note
All claims expressed in this article are solely those of the authors and do not necessarily represent those of their affiliated organizations, or those of the publisher, the editors, and the reviewers. Any product that may be evaluated in this article, or claim that may be made by its manufacturer, is not guaranteed or endorsed by the publisher.
Acknowledgments
The authors would like to thank Matteo Patelmo (STMicroelectronics) for the help in the elaboration of the method and for the fruitful discussions.
References
1. Pellizzer F, Benvenuti A, Gleixner B, Kim Y, Johnson B, Magistretti M, et al. A 90nm Phase Change Memory Technology for Stand-Alone Non-volatile Memory Applications," 2006 Symposium on VLSI Technology. Digest of Technical Papers (2006). p. 122–3. doi:10.1109/VLSIT.2006.1705247
2. Servalli G. A 45nm Generation Phase Change Memory Technology. Baltimore, MD, USA: IEEE International Electron Devices Meeting IEDM (2009). p. 1–4. doi:10.1109/IEDM.2009.5424409
3. Tang DCS, Karpov IV, Dodge R, Klehn B, Kalb JA, Strand J, et al. A Stackable Cross point Phase Change Memory. Baltimore, MD, USA: IEEE International Electron Devices Meeting IEDM (2009). p. 1–4. doi:10.1109/IEDM.2009.5424263
4. Cappelletti P, Annunziata R, Arnaud F, Disegni F, Maurelli A, Zuliani P. Phase Change Memory for Automotive Grade Embedded NVM Applications. J Phys D: Appl Phys (2020) 53:193002. doi:10.1088/1361-6463/ab71aa
5. Cheng HY, Hsu TH, Raoux S, Wu JY, Du PY, Breitwisch M, et al. A High Performance Phase Change Memory with Fast Switching Speed and High Temperature Retention by Engineering the GexSbyTez Phase Change Material.”In International Electron Devices Meeting (2011). p. 3.4.1–3.4.4. doi:10.1109/IEDM.2011.6131481
6. Zuliani P, Varesi E, Palumbo E, Borghi M, Tortorelli I, Erbetta D, et al. Overcoming Temperature Limitations in Phase Change Memories with Optimized ${\rm Ge}_{\rm X}{\rm Sb}_{\rm Y}{\rm Te}_{\rm Z}$. IEEE Trans Electron Devices (2013) 60(12):4020–6. doi:10.1109/TED.2013.2285403
7. Arnaud F, Zuliani P, Reynard JP, Gandolfo A, Disegni F, Mattavelli P, et al. Truly Innovative 28nm FDSOI Technology for Automotive Micro-controller Applications Embedding 16MB Phase Change Memory. San Francisco, CA: IEEE International Electron Devices Meeting IEDM (2018). p. 18.4.1–18.4.4. doi:10.1109/IEDM.2018.8614595
8. Arnaud F, Ferreira P, Piazza F, Gandolfo A, Zuliani P, Mattavelli P, et al. High Density Embedded PCM Cell in 28nm FDSOI Technology for Automotive Micro-controller Applications. San Francisco, CA, USA: IEEE International Electron Devices Meeting IEDM (2020). p. 24.2.1–24.2.4. doi:10.1109/IEDM13553.2020.9371934
9. Redaelli A, Petroni E, Annunziata R. Material and Process Engineering Challenges in Ge-Rich GST for Embedded PCM. Mater Sci Semiconductor Process (2022) 137:2022106184. doi:10.1016/j.mssp.2021.106184
11. Agati M, Vallet M, Joulié S, Benoit D, Claverie A. Chemical Phase Segregation during the Crystallization of Ge-Rich GeSbTe Alloys. J Mater Chem C (2019) 7:8720–9. doi:10.1039/c9tc02302j
12. Agati M, Renaud F, Benoit D, Claverie A. In-situ Transmission Electron Microscopy Studies of the Crystallization of N-Doped Ge-Rich GeSbTe Materials. MRS Commun (2018) 8(3):1145–52. doi:10.1557/mrc.2018.168
13. Redaelli A, Gandolfo A, Samanni G, Gomiero E, Petroni E, Scotti L, et al. BEOL process effects on ePCM reliability. IEEE J. Electron Devices Soc. (2021). doi:10.1109/JEDS.2022.3162755
14. Baldo M, Melnic O, Scuderi M, Nicotra G, Borghi M, Petroni E, et al. Modeling of virgin State and Forming Operation in Embedded Phase Change Memory (PCM). San Francisco, CA: IEEE International Electron Devices Meeting IEDM (2020). p. 13.3.1–13.3.4. doi:10.1109/IEDM13553.2020.9372089
15. Bez R. Chalcogenide PCM: a Memory Technology for Next Decade. IEDM Tech.Dig. (2009) 89–92. doi:10.1109/iedm.2009.5424415
16. Annunziata R, Zuliani P, Borghi M, De Sandre G, Scotti L, Prelini C, et al. Phase Change Memory Technology for Embedded Non Volatile Memory Applications for 90nm and beyond. Baltimore, MD: IEEE International Electron Devices Meeting IEDM (2009). p. 1–4. doi:10.1109/IEDM.2009.5424413
17. Bordas S, Clavaguer-Mora MT, Legendre B, Hancheng C. Phase Diagram of the Ternary System Ge-Sb-Te. Thermochim Acta (1986) 107:239–65. doi:10.1016/0040-6031(86)85051-1
Keywords: pcm, Ge-rich GST, GST, NVM, phase segregation, EELS analysis
Citation: Petroni E, Serafini A, Codegoni D, Targa P, Mariani L, Scuderi M, Nicotra G and Redaelli A (2022) Metrics for Quantification of By-Process Segregation in Ge-Rich GST. Front. Phys. 10:862954. doi: 10.3389/fphy.2022.862954
Received: 26 January 2022; Accepted: 23 March 2022;
Published: 25 April 2022.
Edited by:
Enrico Piccinini, Applied Materials, ItalyReviewed by:
Rita Rizzoli, CNR—Institute for Microelectronics and Microsystems (IMM), ItalyEnrico Varesi, Micron, United States
Copyright © 2022 Petroni, Serafini, Codegoni, Targa, Mariani, Scuderi, Nicotra and Redaelli. This is an open-access article distributed under the terms of the Creative Commons Attribution License (CC BY). The use, distribution or reproduction in other forums is permitted, provided the original author(s) and the copyright owner(s) are credited and that the original publication in this journal is cited, in accordance with accepted academic practice. No use, distribution or reproduction is permitted which does not comply with these terms.
*Correspondence: Elisa Petroni, ZWxpc2EucGV0cm9uaUBzdC5jb20=
 Elisa Petroni
 Andrea Serafini2