
95% of researchers rate our articles as excellent or good
Learn more about the work of our research integrity team to safeguard the quality of each article we publish.
Find out more
ORIGINAL RESEARCH article
Front. Phys. , 07 October 2022
Sec. Low-Temperature Plasma Physics
Volume 10 - 2022 | https://doi.org/10.3389/fphy.2022.862945
This article is part of the Research Topic Numerical Simulations of Plasma Thrusters and/or Related Technologies View all 8 articles
In-flight data from the retarding potential analyzers (RPAs) on the Russian geostationary telecommunication satellite Express-A #3 are used to validate electric thruster plume simulations. The RPAs placed on the solar array have made it possible to measure ion properties, current densities, and ion energy distribution functions (IEDFs) at different distances and field-of-view configurations with regard to the thrusters. The present work shows that the conventional probe theory used to interpret measurements is only valid if the probe is oriented toward the thruster. In most Express-A #3 measurements, this is not the case, and it leads to incorrect interpretations. In this study, a new RPA probe model is presented. It enables the physics of a tilted probe to be described more accurately, taking into account the view angle between the RPA entrance surface normal relative to the incoming flux direction, the flux direction nonaligned with the collection surface normal, the internal RPA electric fields, and masking effects due to RPA walls. This probe model is coupled with a simple model for ion transport from an electric thruster source to the probe to allow a comparison with in-flight data. The comparison between Express-A #3 RPA collected currents and calculations from the new model discriminates true ion energy shift from probe misorientation effects. It also shows that highly tilted RPA measurements that were previously never interpreted can be understood and analyzed.
To understand and predict erosion and electrostatic discharges (ESDs) on spacecrafts in the presence of a plasma thruster, it is necessary to properly represent the electrostatic coupling between the plume of the thruster and the surfaces of the spacecraft. Several works have shown that this coupling has a significant impact on the charging mechanism [1] and can increase the risk of ESDs on solar arrays [2, 3]. Erosion and contamination due to charge exchange ions created by the thruster device on sensitive components such as solar cell interconnectors can also lead to premature termination of the mission [4]. As the demand for higher power plasma thrusters and higher solar-array bus voltages increases, these issues are magnified and become a limiting factor for power upscaling [5].
Plume models aim to represent the primary ion beam dynamics and the coupling with the environment. Thus, a numerical plume simulation usually includes the transport of charged particles and neutral atoms (using full particle-in-cell (PIC) [6] or hybrid fluid–PIC [1, 7, 8] approaches), solves the Poisson equation, and computes collisions between particles. To validate the thruster plume and spacecraft interaction models, experimental data are needed.
Although large ground-based vacuum chambers permit the study of plasma thruster far fields [9, 10], the conditions are different from space. The environment in the vacuum facility is denser [11], leading to a greater charge exchange collision rate between the primary ion beam and the residual
An in-flight experiment has been conducted on SMART-1 [12], but few data are available in the literature, and the plasma diagnostic package position only makes it possible to study the backflow at a single point in space. On the other hand, the Russian geostationary telecommunication satellite Express-A #3 (launched in June 2000) provides a large number of retarding potential analyzer (RPA) measurements, at various locations with respect to the thruster firing axis, enabling a unique in-flight experimental setup to study the plasma plume. However, the RPA data processing is nonconventional due to the oblique incidence of the plasma beam coming from the thruster. The probe tilt-angle with respect to the plasma drift vector (i.e., the angle between the probe normal axis and the probe–thruster axis) is within the range of
In this study, the setup of the RPA probes onboard Express-A is presented. Then, the modeling approach for RPA measurements prediction is described, introducing a new RPA model. It makes it possible to take into account the geometry of the RPA, an oblique incidence of the plasma beam with respect to the probe normal axis, the effects of the axial electric field in the RPA on ion trajectories, and to consider grid transparency. Then, the coupling between the RPA model and a simple transport model taking into input a thruster IEDF derived from a hybrid simulation code is detailed. Finally, the comparison between the model and Express-A data is shown and discussed.
Express-A #3 is equipped with 8 Fakel SPT-100, a well-documented hall thruster used for station keeping and two RPAs mounted on solar panels (DRT1, DRT2), as shown in Figure 1. The RPA positions allow for a scan of ion current and ion energy distribution function (IEDF) as the solar arrays rotate. This unique setup is often compared to thruster plume simulation in space vacuum [14, 15, and references therein].
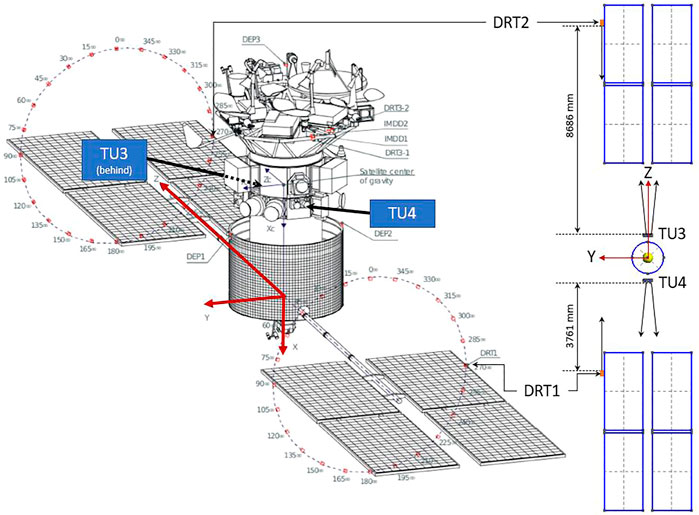
FIGURE 1. Express-A thruster and RPA locations [13].
The spacecraft is also equipped with electric field and pressure sensors, along with torque measurements induced by the thruster plume studied in other works [8, 16]. However, in the scope of this study, only RPA data will be investigated.
RPA data have previously been used and compared with simulation [16, 17]. However, we demonstrate that taking ion current measurements and IEDF without an RPA response model leads to significant errors. This approach may be used in future works to obtain plume measurements on unexploited Express-A data.
On Express-A, the RPA collector surface normal is along + Z for DRT1 and along -Z for DRT2. The DRT1 probe measures the ion current from the thruster unit TU4 and DRT2 measurements concern the TU3. It is to be noted that each thruster unit TUX consists of two SPT-100 Hall thrusters, designated as TX and RTX.
To be able to analyze and interpret the RPA measurements without biases, the probe needs to be oriented toward the studied ion source. However, regarding the position of the thruster units, TU3 and TU4, the probe tilt-angle
The Express-A RPA data have previously been used in two ways: first, as an ion current density probe and, second, to measure IEDF. Previous articles seem to take some precautions with the IEDF analysis and only consider RPA data when the probe tilt-angle is close to 0° [16]. But few cases are available. For the ion current analysis, raw RPA data are directly used despite the varying tilt-angle
This study aims to analyse the effect of probe misorientation over Express-A RPA measurements (over 170 angle/distance configurations from 3.82 to 9.26 m with an angle relative to the thruster varying from 2° to 45°, as shown in Figure 2) and to identify whether the data provide information about thruster IEDF only or if more information can be extracted such as electrostatic effects or collision effects inside the plume.
Previously, an analytical model has been developed [18] to take into account the shading effect due to the geometry of the tilted-RPA. It allows to apply a correcting factor on each RPA current measurement. In this study, a more advanced analytical RPA model is presented, allowing us to consider the RPA axial electrostatic effects as well and to study the effect of the tilted-RPA on IEDF measurements. The new RPA model is presented in Section 3.
This section introduces the model used in this study. First, in Section 3.1, the RPA theory is recalled, detailing the issue with tilted RPA measurements. Then, Section 3.2, Section 3.3, and Section 3.4 present the approach used to predict Express-A RPA measurements. To do so, the subsections successively focus on the modeling of the inside of the RPA, using a transfer function approach, then, on the input distribution function used to model the thruster ion source, and finally, on the modeling of the ion motion from the thruster to the RPA. In Section 3.5, the effect of the RPA tilt-angle on probe measurements is analyzed using the model previously described.
A retarding potential analyzer is an electrostatic hollow cylindrical probe consisting of three to four polarized grids. First, a screen grid is polarized to the probe floating body potential
Let us consider a beam of singly charged ions of charge
If a positive value of the analyzer potential
The derivative of the collected current by the analyzing potential
We finally obtain the proportionality relationship:
This equation relies on the initial hypothesis that if an ion has an axial energy
Figure 3 shows the trajectory of an
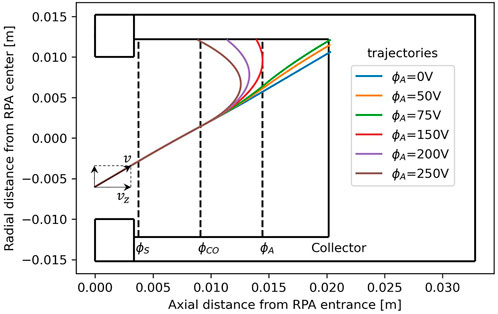
FIGURE 3. Trajectories of an ion
This simple simulation of the motion of a single ion shows that when
As the
The expression of the collected current introduced earlier can be completed by the introduction of a transfer function
where
The objective of the following approach is to express the collected current
Other RPA modeling approaches, for example, using PIC simulation, exist [19]. However, the duration time of the simulation is much larger than that of the pseudoanalytical approach due to the large number of macroparticles needed to capture the shape of the energy distribution on the collector surface with good accuracy. The misoriented RPA case has never been studied using the PIC models. In the end, the coupling between this fast analytical approach with a plasma-spacecraft solver (already time-consuming due to the description of the charged particle transport and interactions with the spacecraft) will be performed.
We will now detail the expression of
In this study, only singly charged ions are considered. Therefore,
Second, the effect of the wall filter being less straightforward is taken into account. Considering only the particles with
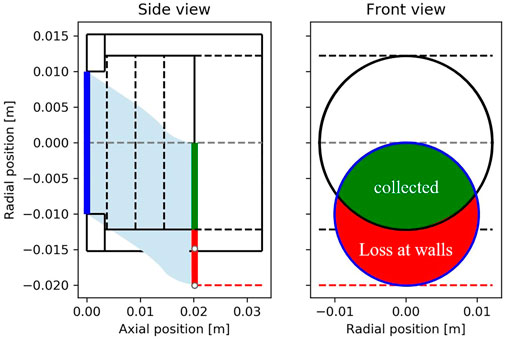
FIGURE 4. Integration over initial positions for a given velocity vector (axial kinetic energy greater than retarding potential energy).
The surface of the intersection of the disks becomes the effective collection surface
The transfer function
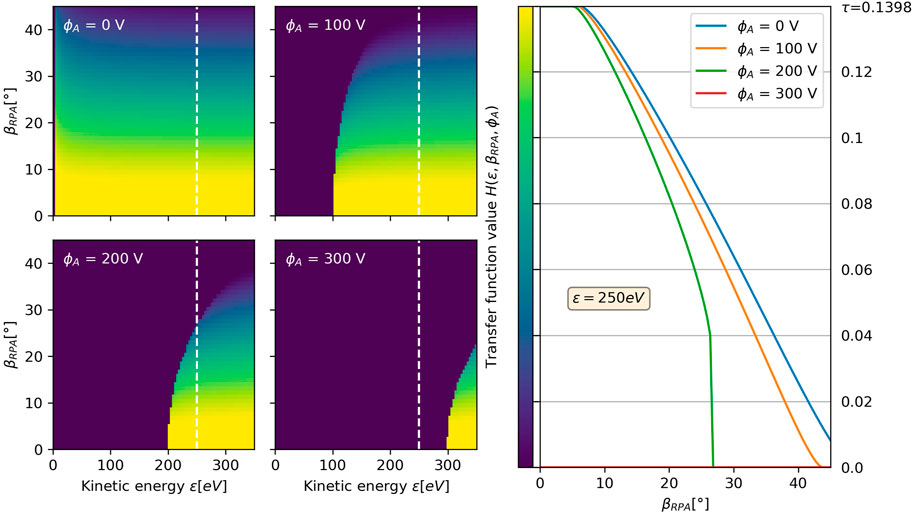
FIGURE 5. Transfer function
At this point, the IEDF at the thruster exit (i.e., the model input) needs to be specified. The transfer function between the thruster and the RPA entrance is also needed. They are described, respectively, in Sections 3.3 and 3.4.
The model presented in Section 3.2 makes it possible to compute the transfer function of the RPA. The IEDF at the RPA entrance depends on the IEDF at the thruster exit and how this distribution varies between the thruster and the RPA locations. This section presents the approach used to model the IEDF at the thruster exit.
Figure 6 illustrates an
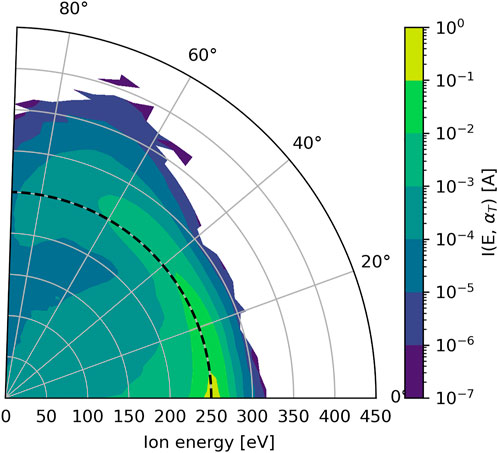
FIGURE 6. Radial ion current distribution function at the thruster cathode line boundary from the hybrid model [20]. The angle is
As shown in Figure 6, the emitted current decreases with the angle, but the shape of the current energy distribution function between 0° and 45° evolves with very little change. Therefore, the IEDF can be approximated using the separation of variables in spherical coordinates with
The velocity distribution function is defined accurately by a fitted Gaussian distribution
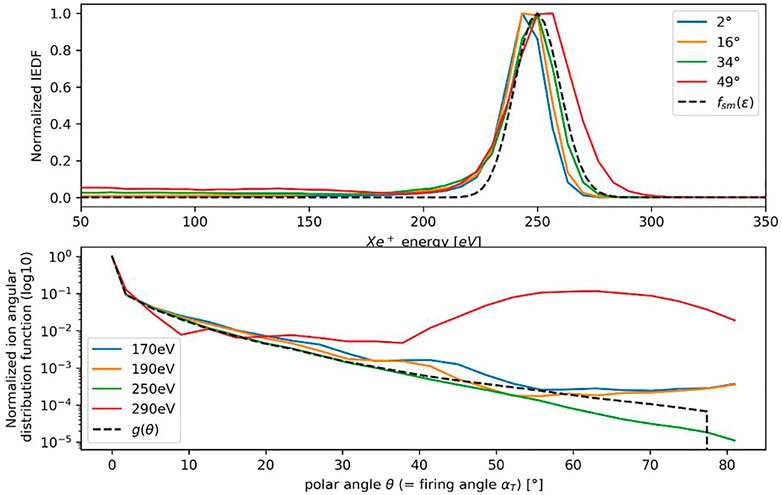
FIGURE 7. Top: normalized velocity distribution for various
To obtain the distribution function at the RPA location, the transport has to be modeled between the source and the RPA entrance. In this section, we detailed the expression of the ion distribution function as a function of the position and the velocity
First, we assume that there are no collisions and no plasma effects in the plume. This strong approximation will be discussed in Section 4.3. Second, the RPAs on Express-A #3 are far from the thrusters (in-flight data, the distance is at least
The hypothesis that the velocity distribution of the thruster is independent of the firing angle
With
With
As mentioned in Section 2, the RPA measurements can be analyzed in two interesting ways. First, the derivative of the collected current with respect to the analyzer potential
In Figure 8, the effect of the RPA tilt-angle
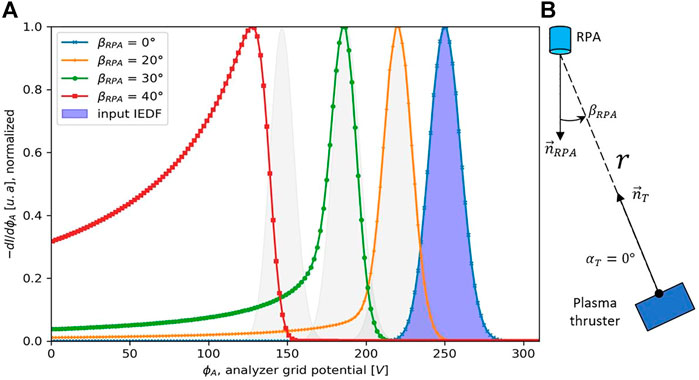
FIGURE 8. (A)
When the tilt-angle
Figure 5 shows that the effect of the tilt-angle becomes more pronounced as
For the study of the Express-A plasma thruster, the effect of wall collection on the
It is possible to deduce the ion current at the RPA location from the RPA current measurement at
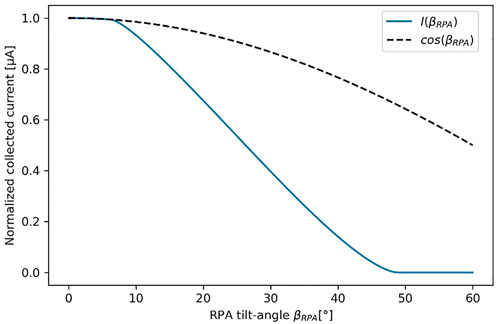
FIGURE 9. Normalized collected current as a function of the RPA tilt-angle
All of the available RPA curves were processed using the following procedure. To analyze the curves, a data cleaning-based method on the following simple criterion was applied: the probe has to collect a current
An RPA provides two useful types of measurement for thruster characterization. The first is the shape of the
In the remainder of the section, we compare the introduced transfer function model to Express-A measurements on the two kinds of measurements from an RPA probe: on one hand, the study of the ion energy distribution function and on the other hand, the analysis of the ion current at
In this section, several curves obtained from Express data are shown in Figure 10. We have decided to focus on four configurations corresponding to the DRT1 (near probe) measurements with RT4 firing with the solar array angle of (10.a) 45° and (10.c) 58°, and T4 firing with the solar array angle of (10.b) 75° and (10.d) 92° (as shown in Figure 2). All probe tilt-angles
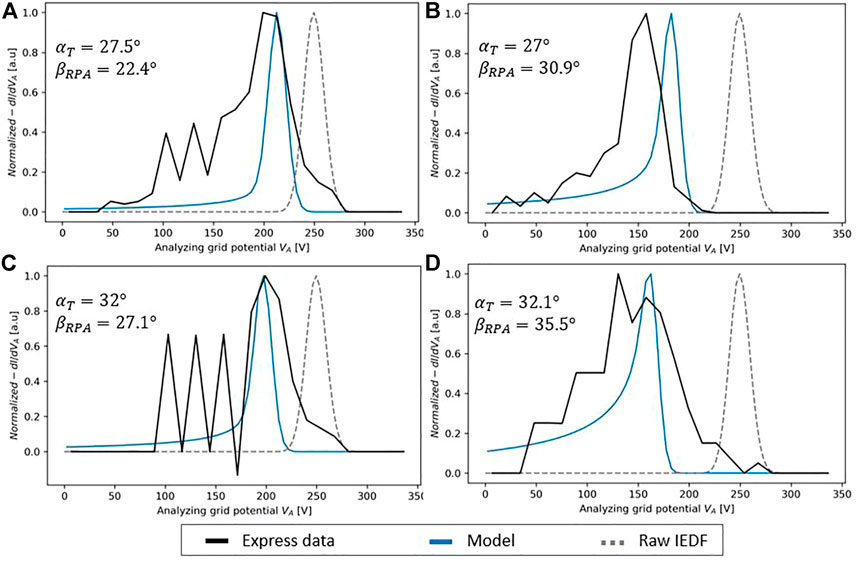
FIGURE 10. Normalized
In Figure 10, the firing angle
Comparing Figures 10C,D, the energy peak also shifts when
It should be noted that there is good agreement between the simulation results and the in-flight measurements, considering that all of the model inputs are completely theoretical (the only input of the RPA model is the distribution function at the thruster exit and the latter is taken from the hybrid model). The sources of discrepancy between the model and measurements can be due to the approximations in our modeling approach, and only primary singly charged ions are taken into account and neither collision nor plasma effects are considered. It can also come from the considered input thruster IEDF or any Express-A measurement error.
The previous section presented the bias due to a misoriented RPA on the shape of the IEDF. This section focuses on the consequences on the collected currents (in absolute values) and, therefore, on the measurement of the angular distribution function of the emitted ion current.
To fit plasma parameters in simulation from the experimental data, Manzella [15] and Sang-Wook Kim [21] used a normalization to reconstruct the
Figure 11 shows the comparison between the transfer function model as described in Section 3 and the processed Express-A RPA measurements.
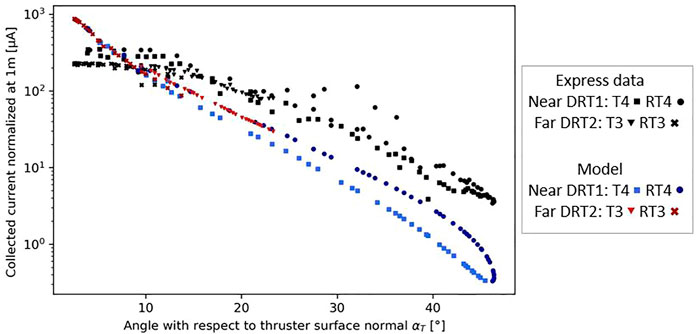
FIGURE 11. Collected current normalized at 1 m from the thruster using a
Each point represents the collected current for a configuration (a unique set of thruster, probe, and solar array rotation angle). These configurations are summarized in Figure 2. The RPA data are presented in black and the transfer function model predictions for a misoriented RPA, with the loss at the RPA walls, are in red and blue. The model prediction splits into two curves as the firing angle
The comparison between the transfer function model prediction and the Express-A measurements shows that the model overestimates the collected current at low angles (
These observations indicate that the beam at the RPA location seems too focalized. The beam divergence is too low compared to what the Express measurements show. The difference between measurements and the model prediction can be attributed to several plume effects. First, electrostatic effects and second, collisions. Considering the electrostatic effects, ion transport from the thruster exit to the probe is not purely radial due to the plasma effects. In particular, a radial electric field builds up in the plume due to electron pressure. High-velocity ions are then attracted outside of the main beam modifying the velocity vector. These plasma effects can be seen in the measurements by comparing the near RPA measurements (∼4 m) to the far ones (∼9 m). Once normalized at 1 m (Figure 11), we can see in Figure 11 that the normalized RPA collected current at small angles (<15°) do not overlap for the near and far RPA (nearly a difference of a factor of 2), as it should be if the
Moreover, the results in Figure 11 only consider the primary ion beam. However, charge exchange collisions (CEX) take place in the plume, and fast ions can exchange their charge with slow neutrals, creating slow ions. These slow ions are also attracted in the radial direction and may increase the measured current at large
In addition to plume effects and collisions, the gap between the measurements and model could also be due to the modeling of the thruster. Indeed, only singly charged ions are modeled, while a significant proportion of the emitted current is doubly or triply charged (respectively,
Section 4.3 shows that the model is not able to predict the shape of the emitted current measured by the RPA. To highlight the tilt-angle effects in Express-A RPA measurements, it is necessary to change the modeling approach. Figure 10 shows that the velocity distribution
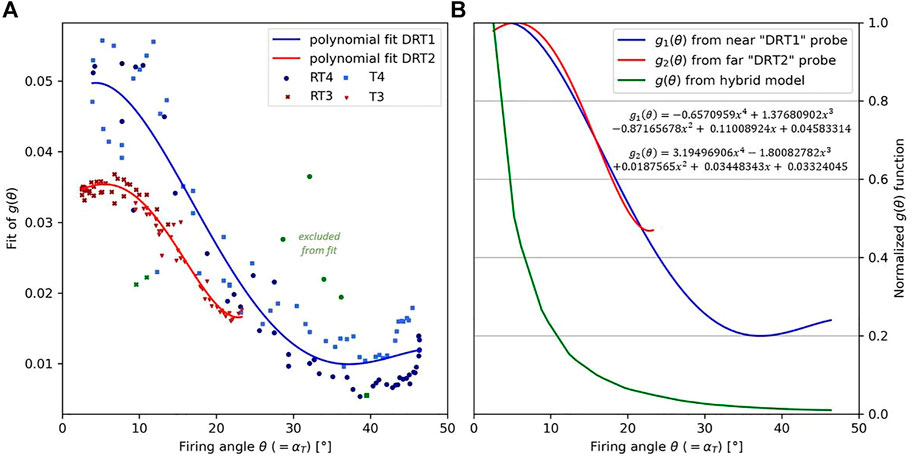
FIGURE 12. (A) Fit of the ion angular distribution function
The experimental results of
Then, a fit is performed using a fourth-order polynomial. The function is normalized to match the Express-A measurements at a very low firing angle. Ideally (i.e., if the model assumptions were true), the Express-A data in Figure 12 and Figure 11A should be on a unique curve. However, this is not the case and can be due to the dispersion in Express-A measurements on one side and strong model hypotheses on the other side. In Figure 11, the normalization at 1 m shows that the normalized measurements of the near probe were twice the normalized measurements of the far probe, suggesting that the divergence increases in the plume between the probes and invalidating the
In conclusion, without taking into account the plasma effects in the plume, this approach is not able to give the
Figure 13 shows the comparison between the collected current normalized at 1 m (for
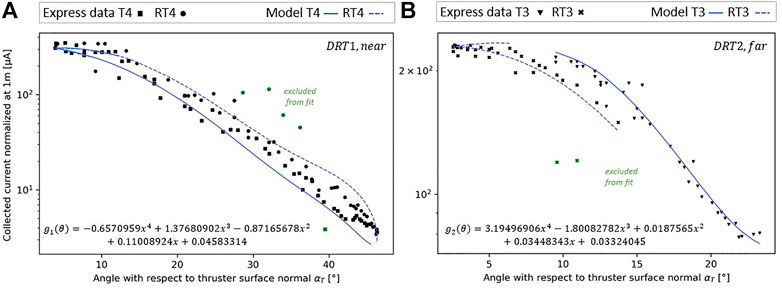
FIGURE 13. Collected current normalized at 1 m from the thruster exit as a function of the firing angle. Comparison of the processed Express-A data and model results. (A) Near probe and (B) far probe. The input IEDF is a shifted Maxwellian distribution for energy (
First, the far probe results (Figure 13B) show that the Express-A data follow two distinct tendencies between
Second, the experimental data and model prediction for the near probe ‘DRT1’ are compared in Figure 13A. As for the far probe, the predicted collected current is different depending on the firing thruster, due to the same tilt-angle effect. The prediction made with the T4 thruster configuration led to the bottom branch and the RT4 thruster configuration to the top one. The Express-A measurements are more dispersed with ‘DRT1’ than ‘DRT2’. However, the measurements for
To conclude, both the far and near probe analyses demonstrate that the effects of the tilt-angle are noticeable on the Express-A RPA absolute current measurements and that plotting the current normalized at 1 m as a function of the thruster firing angle
The new model presented in this study makes it possible to predict the RPA response for cases where the tilt-angle is significant. The new RPA model uses a transfer function formalism, describing the motion of ions inside the RPA. It considers the RPA geometry (with boundary effects, grid transparency, and the field of view with respect to the source) and the ion deflection due to the axial electrostatic fields between each grid. The space charge effects that can appear in the dense plasma are not taken into account in this model. To be able to compare this RPA model to the Express-A measurements, the plasma thruster has been modeled as a point source, using a realistic SPT-100 IEDF from the existing simulation results, considering only the primary singly charged ions. The ion propagation model used between the thruster exit and the RPA entrance assumes no space charge effects and no collisions in the plume.
The analysis of the RPA transfer function theoretically suggests that the tilt-angle effects are significant in Express-A configurations. Comparing these predictions to the actual RPA measurements, it has been shown that RPA misorientation effects are indeed visible on both the
For the IEDF analysis, the results from the model are in good agreement with the Express-A measurements. It demonstrates that the probe misorientation induces two biases. First, the measured ion energies are shifted toward lower values. Second, the
Concerning the angular dependency of the collected current
The simple ion transport model has shown some limitations and underlines the necessity to model the plasma effects in the plume to more accurately predict the shape of
The present probe model can also be applied in vacuum facilities, where it is not always possible to have a perfectly oriented RPA due to the shape of the chamber. This could be interesting to acquire more precise backflow measurements. The distance between the plasma source and the RPA needs to be large enough to consider a point source and point RPA. Moreover, the simplicity of this kind of probe model (with respect to much more sophisticated codes using the hybrid or particle-in-cell methods) means it can be integrated into other numerical tools or used to solve the inverse problem. For example, the probe model can be combined with an optimization code and a more advanced plasma model to extract the IEDF parameters using RPA data as input.
The raw data supporting the conclusion of this article will be made available by the authors, without undue reservation.
LN, PS, and LG performed the conceptual design of the study. LN and PS designed the calculation model and wrote the simulation codes. LN performed the simulations. The data were analyzed by LN and discussed by PS, LG, SH, and MV. The first draft of the manuscript was written by LN and revised by PS, LG, SH, and MV.
The authors declare that the research was conducted in the absence of any commercial or financial relationships that could be construed as a potential conflict of interest.
All claims expressed in this article are solely those of the authors and do not necessarily represent those of their affiliated organizations, or those of the publisher, the editors, and the reviewers. Any product that may be evaluated in this article, or claim that may be made by its manufacturer, is not guaranteed or endorsed by the publisher.
1. Sarrailh P, Hess SL, Mateo-Velez J-C. 2015, Simulations of plasma thruster effect on the electrostatic behavior of spacecrafts in GEO. In: Proceeding AIAA SPACE 2015 Conference and Exposition; 28 Aug 2015; Pasadena, CA. AIAA-2015-4640. doi:10.2514/6.2015-4640
2. Wright KH, Schneider TA, Vaughn JA, Hoang B, Funderburk VV, Wong FK, et al. Electrostatic discharge testing of multijunction solar array coupons after combined space environmental exposures. IEEE Trans Plasma Sci IEEE Nucl Plasma Sci Socieee Trans Plasma Sci (2012) 40(2):334–44. doi:10.1109/TPS.2011.2174447
3. Likar JJ, Bogorad AL, Malko TR, Goodzeit NE, Galofaro JT, Mandell MJ. Interaction of charged spacecraft with electric propulsion plume: On orbit data and ground test results. IEEE Trans Nucl Sci (2006) 53:3602–6. doi:10.1109/TNS.2006.885107
4. Yan L, Wang P-Y, Ou Y-H, Kang X-L. (2012) Numerical study of Hall thruster plume and sputtering erosion. J Appl Math 2020 1–16. doi:10.1155/2012/327021
5. Reza M, Faraji F, Andreussi T. Characterization of a high-power Hall thruster operation in direct drive. Acta Astronautica (2021) 178:392–405. doi:10.1016/j.actaastro.2020.09.008
6. Shan K, Chu Y, Li Q, Zheng L, Cao Y. Numerical simulation of interaction between Hall thruster CEX ions and SMART-1 spacecraft. In: NR Junuthula, editor. Mathematical problems in engineering (2015). p. 1–8. doi:10.1155/2015/418493
7. Muranaka T, Inanaga Y. Development of a numerical tool for Hall thruster plume and spacecraft interaction analysis. AEROSPACE TECHNOLOGY JAPAN (2018) 16:366–73. doi:10.2322/tastj.16.366
8. Mikellides IG, Jongeward GA, Gardner BM, Katz I, Mandell MJ, Davis VA. A Hall-effect thruster plume and spacecraft interactions modeling package. In: Proceeding 27th International Electric Propulsion Conference; 15-19 October, 2001; Pasadena, CA. IEPC-01-251 (2001).
9. Giono G, Gudmundsson JT, Ivchenko N, Mazouffre S, Dannenmayer K, Loubère D, et al. Non-Maxwellian electron energy probability functions in the plume of a SPT-100 Hall thruster. Plasma Sourc Sci Technol (2017) 27:015006. doi:10.1088/1361-6595/aaa06b
10. Kim S-W, Gallimore AD. Plume study of a 1.35-kW SPT-100 using an ExB probe. J Spacecraft Rockets (2002) 39:904–9. doi:10.2514/2.3897
11. Passaro A, Vicini A, Biagioni L. Plasma thruster plume simulation: Effect of vacuum chamber environment. In: Proceeding 35th AIAA Plasmadynamics and Lasers Conference; Portland. paper AIAA-2004-2357 (2004). doi:10.2514/6.2004-2357
12. Di Cara DM, Estublier D. Smart-1: An analysis of flight data. Acta Astronautica (2005) 57:250–6. doi:10.1016/j.actaastro.2005.03.036
13. Sitnikova N, Volkov D, Maximov I, Petrusevich V, Allen D. "Hall effect thruster interactions data from the Russian express-A2 and express-A3 satellites - task 27A," (2003). Available at: https://ntrs.nasa.gov/citations/20030062907.
14. Boyd I. 2020, Hall thruster far field plume modeling and comparison to Express flight data. In: Proceeding 40th AIAA Aerospace Sciences Meeting & Exhibit (2002); 14 January 2002 - 17 January 2002; NV Reno. AIAA. doi:10.2514/6.2002-487
15. Manzella D, Jankovsky R, Elliott F, Mikellides IG, Jongeward GA, Allen D. Hall thruster plume measurements on-board the Russian express satellites. In: Proceeding 27th International Electric Propulsion Conference; October 14-19, 2001; Pasadena, CA. IEPC (2001). Available at: http://citeseerx.ist.psu.edu/viewdoc/download;jsessionid=505965F4BFAC7A689E0E7A4C589B9ADC?doi=10.1.1.618.6148&rep=rep1&type=pdf.
16. Mikellides IG, Jongeward GA, Katz I, Manzella DH. Plume modeling of stationary plasma thrusters and interactions with the express-A spacecraft. J Spacecraft Rockets (2002) 39:894–903. doi:10.2514/2.3896
17. Boyd ID, Dressler RA. Far field modeling of the plasma plume of a Hall thruster. J Appl Phys (2002) 92:1764–74. doi:10.1063/1.1492014
18. Korsun AG, Tverdokhlebova EM, Gabdullin FF. The distinction between the ep plume expansion in space and in vacuum chamber. In: Proceeding 29th International Electric Propulsion Conference. Princeton, NJ: Central Research Institute of Machine Building (TsNIIMASH)Pionerskaya str (2005). paper IEPC-2005-073. Available at: https://www.researchgate.net/profile/Ekaterina-Tverdokhlebova/publication/236171538_The_Distinction_between_the_EP_Plume_Expansion_in_Space_and_in_Vacuum_Chamber/data/0deec516d1b0e0b0e2000000/IEPC-2005-073.pdf.
19. Chao CK, Su S-Y. Charged particle motion inside the retarding potential analyzer. Phys Plasmas (2000) 7:101–7. doi:10.1063/1.873817
20. Garrigues L, Hagelaar GJM, Boniface C, Boeuf JP. Anomalous conductivity and secondary electron emission in Hall effect thrusters. J Appl Phys (2006) 100:123301. doi:10.1063/1.2401773
21. Kim S-W, Foster J, Gallimore A. Very-near-field plume study of a 1.35 kW SPT-100. In: Proceeding 32nd Joint Propulsion Conference and Exhibit; 22 Aug 2012; Lake Buena Vista, FL. AIAA (1996). doi:10.2514/6.1996-2972
Keywords: RPA (retarding potential analyzer), Express-A, SPT-100, plasma thruster, in-flight measurements, IEDF measurement, tilted, misoriented
Citation: Nicolle L, Sarrailh P, Garrigues L, Hess S and Villemant M (2022) Modeling of a retarding potential analyzer and comparison with Express-A in-flight measurements. Front. Phys. 10:862945. doi: 10.3389/fphy.2022.862945
Received: 26 January 2022; Accepted: 30 August 2022;
Published: 07 October 2022.
Edited by:
Agnes Granier, UMR6502 Institut des Matériaux Jean Rouxel (IMN), FranceReviewed by:
Nickolay Ivchenko, Royal Institute of Technology, SwedenCopyright © 2022 Nicolle, Sarrailh, Garrigues, Hess and Villemant. This is an open-access article distributed under the terms of the Creative Commons Attribution License (CC BY). The use, distribution or reproduction in other forums is permitted, provided the original author(s) and the copyright owner(s) are credited and that the original publication in this journal is cited, in accordance with accepted academic practice. No use, distribution or reproduction is permitted which does not comply with these terms.
*Correspondence: L. Nicolle, bHVjYXMubmljb2xsZUBvbmVyYS5mcg==
Disclaimer: All claims expressed in this article are solely those of the authors and do not necessarily represent those of their affiliated organizations, or those of the publisher, the editors and the reviewers. Any product that may be evaluated in this article or claim that may be made by its manufacturer is not guaranteed or endorsed by the publisher.
Research integrity at Frontiers

Learn more about the work of our research integrity team to safeguard the quality of each article we publish.