 Qiang Niu
 Ran Zhang
 Yuping Yang
95% of researchers rate our articles as excellent or good
Learn more about the work of our research integrity team to safeguard the quality of each article we publish.
Find out more
ORIGINAL RESEARCH article
Front. Phys. , 16 March 2022
Sec. Optics and Photonics
Volume 10 - 2022 | https://doi.org/10.3389/fphy.2022.859924
This article is part of the Research Topic Application of Terahertz Frequency in Substance Detection and Recognition View all 9 articles
High sensitivity and quantitative detection of the severe acute respiratory syndrome coronavirus 2 (SARS-CoV-2) spike protein (S protein) is of great significance for the diagnosis and treatment of coronaviruses. Here, we utilized terahertz time-domain spectroscopy (THz-TDS) integrated with a metamaterial (MM)-based biosensor and biological modification technology to demonstrate a high accuracy and label-free detection of the SARS-CoV-2 S1 protein by comparing the changes of the dielectric environment before and after binding the S1 protein. To confirm the sensing characteristics observed in the experiments and provide a further insight into the sensing mechanisms, we performed numerical simulations through varying the thickness, quantity, position, and refractive index of analyte aggregates. The sensitivity increases with the increase of the number of gaps and the amount of analyte near the gaps, which convincingly proves that the frequency shift and sensing performance are strongly influenced by the field enhancement and near-field coupling at the gap area.
Spike protein is a kind of structural protein with spines on the surface of coronaviruses, which is also known as S protein and contains information on the pathogenic mechanism, source, treatment method, and pathogenicity of the severe acute respiratory syndrome coronavirus 2 (SARS-CoV-2) [1]. The S protein is composed of two subunits, the amino-terminal (N-terminal) S1 subunit (spherical) and the carboxy-terminal (C-terminal) S2 subunit (rod-shaped). In particular, the S1 protein plays an important role in the process of specific recognition and binding to the host cell surface receptor [2–5]. Therefore, it is of great significance to detect the trace SARS-CoV-2 S1 protein for the diagnosis and treatment of coronaviruses.
At present, great advancements have been made to achieve the diagnosis of SARS-CoV-2, including reverse transcription-polymerase chain reaction (RT-PCR) and the antibody detection method [6–11]. Based on the known RNA sequence of the virus, the RT-PCR technique can be used to convert the viral RNA in the nasal or the throat into DNA, and the DNA concentration will be subsequently amplified and detectable. This method has a high accuracy but it is time-consuming, which usually takes 5 h to obtain the results. Lateral flow immunoassay (LFIA), which uses test strips to detect viral antigens or IgM antibodies in the patient’s blood, shortens the test time to about 20 min, but the accuracy and sensitivity are very low, and the false positive rate is relatively high. Thus, it is highly desired to develop innovative high sensitivity and specific diagnostic techniques for the SARS-CoV-2 S1 protein in both qualitative and quantitative manner that are easily accessible and low-cost.
As a developing spectroscopic technique bridging the gap between microwave and infrared spectroscopies, terahertz time-domain spectroscopy (THz-TDS) based on the coherent detection technology has been rapidly developed and consequently applied to biomolecular detection due to a high signal-to-noise ratio (SNR), low photon energy of THz radiation, and a broad bandwidth [12, 13]. More recently, combined with metamaterial (MM)-based THz biosensors with subwavelength artificial structures, the sensitivity of typical THz-TDS detection has been further improved and used for label-free biological detection because the localized electromagnetic field excited by surface plasmonic resonance is extremely sensitive to the surrounding dielectric environment [14–16]. At the same time, this technology has the advantages of low cost, less consumption, real-time, non-destructive detection, and so on. In 2008, O’Hara et al. [17] analyzed the sensing capability of a THz metamaterial with a double split ring structure fabricated on a silicon substrate. Tao et al. [18, 19] reported that the sensitivity of the THz biosensor can be significantly enhanced by fabricating THz MM on some thin and low-permittivity substrates to reduce the insertion loss and the induced capacitance. Furthermore, in 2013, Wu et al. [20] achieved a label-free, alkanethiol-functionalized, and a specific THz MM sensor for streptavidin-agarose (SA) by using the biological combination of biotin and streptavidin, and detected different concentrations of streptavidin using different redshifts of resonance frequency. Lately, various functionalized THz MM chips based on periodic hole arrays, metamaterials, absorbers, Fano resonances, and 2D materials have been employed for high-sensitivity sensing and accurate discrimination in biomedical detection of proteins [21], cancer cells [22], DNA mutations [23], viruses [24], and microorganisms [25]. For example, Yoon et al. [26] demonstrated highly sensitive identification of viruses by comparing their dielectric permittivity. Ahmadivand et al. [27] designed a toroidal THz MM to detect SARS-CoV-2 S proteins at a low level. However, the proposed sensors do not exhibit the specific selectivity or the wide applicability due to an overlayer analyte forming by directly dropping or the complex experimental process.
In this work, we integrated THz-TDS, THz metamaterials, and biological modification technology to demonstrate a THz MM biosensor with a three-split ring (TSR) resonator for high accuracy SARS-CoV-2 S1 protein detection. Based on numerical simulations, we find that the three splits are crucial to the sensitivity enhancement of the proposed MM sensor due to the field localization and the near-field coupling between two terminals. In experiments, the resonance frequency shift and FWHM variation are almost proportional to the concentration of the S1 protein solution, and the limit of detection (LOD) is less than 5 ng. Consequently, a high sensitivity and label-free detection of S1 protein is achieved.
The SARS-CoV-2 S1 protein solution was purchased from Nanjing Mingyan Biotechnology Co. China. For biological modification, the purchased S1 protein solution was diluted with phosphate buffer saline (PBS) to various concentrations from 1 to 30 μg/ml. According to the ratio of 1-(3- dimethylaminopropyl)-3-ethylcarbodiimide hydrochloride (C8H17N3, EDC) and sulfo-N-hydroxysuccinimide (C4H5NO6S, NHS) with 3:1, the EDC and NHS solutions were diluted with 18.2 MΩ ultrapure water to 22.5 mg/ml and 7.5 mg/ml, respectively. The ultrapure water was also used to dilute the 3-mercaptopropionic acid (MPA) solution to 5 mmol/L.
A three-split ring (TSR) resonator, as illustrated in Figure 1A, was designed to realize the high-sensitivity THz sensor due to its more excellent sensing characteristics than SR resonators with single or double splits [23, 28]. The geometric parameters of the sensor are listed in Table 1. The structure was fabricated by conventional photolithography and metallization processing. A 200-nm-thick Au film was deposited on a 1-mm-thick silicon (Si) substrate. Although the sensitivity of the proposed TSR metamaterial on a silicon substrate is lower than that of thin- or low-permittivity substrates, its fabrication process and biological modification are simpler and of large area and low cost, which enables systematic and highly reproducible studies of their resonant properties. Finally, a lift-off process was performed to form the designed metamaterial. Figure 1B displays the microscopic image of a set of fabricated TSR unit cells.
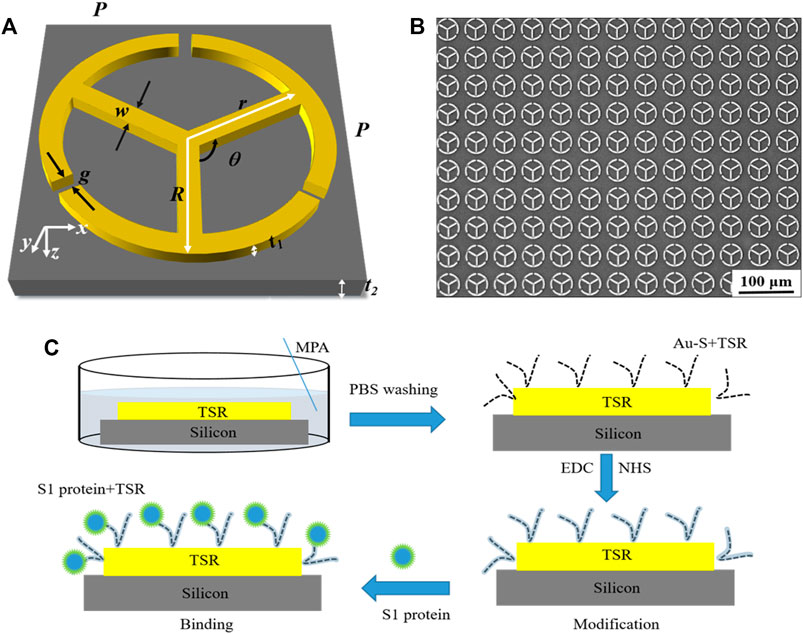
FIGURE 1. (A) Schematic representation of the proposed TSR resonator. The incident THz wave is polarized along the x axis. (B) Microscope image of the fabricated TSR unit cells. (C) Biological modification process.

TABLE 1. Geometric parameters of the unit cell.
To verify the experimental observation and gain an insight into the sensing mechanisms, we carry out finite element analysis (FEA) simulations using the CST Microwave Studio. The silicon substrate was set as a lossy-free material with dielectric permittivity ε = 11.9, the Au film was modeled as a perfect electric conductor with the conductivity of 4.56 × 10⁷ S/m. The input THz pulse, polarized along the x axis, was at normal incidence to the metal surface of the sample, as shown in Figure 1A.
The specific modification process is shown in Figure 1C. Briefly, the MM sensor was immersed in the MPA solution to form Au–S bonds at room temperature (22°C) for about 24 h. Then, in order to enhance the activity of the carboxyl group on MPA, the mixed solution of EDC and NHS was dropped on the surface of the proposed MM sensor at room temperature (22°C) for 30 min. Finally, the S1 protein solution was incubated on the proposed MM for 30 min. Before the test, the MM sensor was rinsed three times with the PBS solution and purged with nitrogen gas.
As shown in Figure 2A, a homemade THz-TDS system was used to characterize samples, which composes of a femtosecond (fs) pulse laser, a pair of photoconductive antennas, time-delay line, etc. An 800 nm, 100 fs, 82 MHz mode-locked Ti: sapphire laser is divided into probe and pump beams by a cubic beam splitter (CBS). The pump beam passing through a chopper and the time delay line is incident on a dipole antenna (THz emitter) to generate the terahertz pulse, which is collimated by a high-resistivity Si lens and a parabolic mirror. The probe light is focused on the THz receiver, and the instantaneous THz electric field is amplified and recorded by a lock-in amplifier. The entire system is located in an airtight enclosure to avoid water vapor absorption on the THz path. In measurements, the THz wave is normally incident to the designed MM biosensor, and the polarization direction of the THz electric field is parallel to the upper opening gap on the proposed MM, as shown in Figure 2B. All tests were performed at room temperature of 22°C and humidity below 5%.
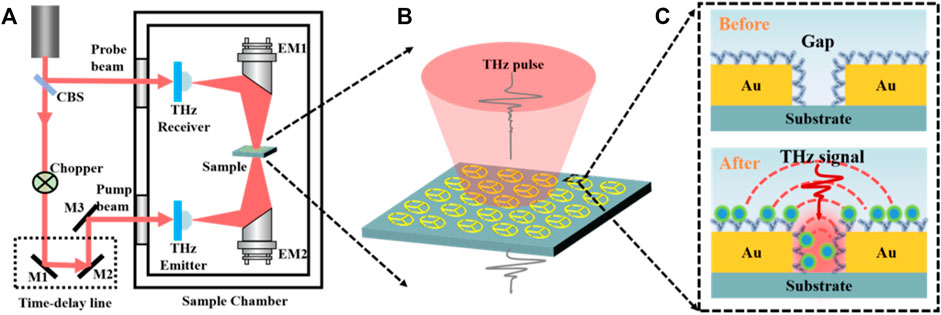
FIGURE 2. Schematic of the experimental setup and the sample. (A) THz-TDS and the magnified pictures of the sample (B) and the dotted rectangle (C) which contains Au structures and air gaps before and after the combination of the S1 protein.
The blank silicon wafer and the MM chips with or without samples were measured as the reference and sample signals of Eref(t) and Esam(t), respectively. Then, the corresponding amplitude spectra were obtained by fast Fourier transform (FFT) and denoted as Eref(ω) and Esam(ω). Finally, the amplitude transmission spectra are defined as t(ω) = Esam(ω)/Eref(ω). For specific comparison, the THz pulses transmitted through the MM chips before and after the combination of S1 protein were measured, as shown in Figure 2C.
Sensitivity (S) and figure of merit (FOM) are usually used to describe the sensing performance of MM biosensors, which can be described as S = Δf/Δn and FOM = S/Δν, respectively, where Δf is the redshift of the central frequency, Δn is the change of the refractive index of the analyte, and Δν is the full width at half maximum (FWHM) of the resonance dip. The sensitivity is used to represent the frequency shift of the resonance peak (or dip), which is of great significance to describe the distinguishing ability of the analytes with various refractive indices. The FOM takes into account both sensitivity and FWHM, which is used to characterize the performance of MM biosensors more reasonably. In this article, we use sensitivity and FOM as the main parameters to evaluate the proposed THz MM chip.
The transmission spectrum of the uncoated THz MM sensor is displayed in Figure 3A by the black curve. Two distinct resonances are observed as transmission dips. The low-frequency resonance mode (dip 1) originated from inductor–capacitor (LC) oscillation, whereas the high-frequency resonance mode (dip 2) is attributed to the electric dipole oscillator. The surface current and the electric field distribution at the resonant frequencies of dip 1 (0.680 THz) and dip 2 (1.627 THz) are shown in Supplementary Figure S1, indicating that the distributions of the electric field for both LC and dipole resonances are dominated by a substantial signal confinement and enhancement in the gap area. The resonance frequency and sensing performance are strongly influenced by the field localization and the near-field coupling between two terminals.
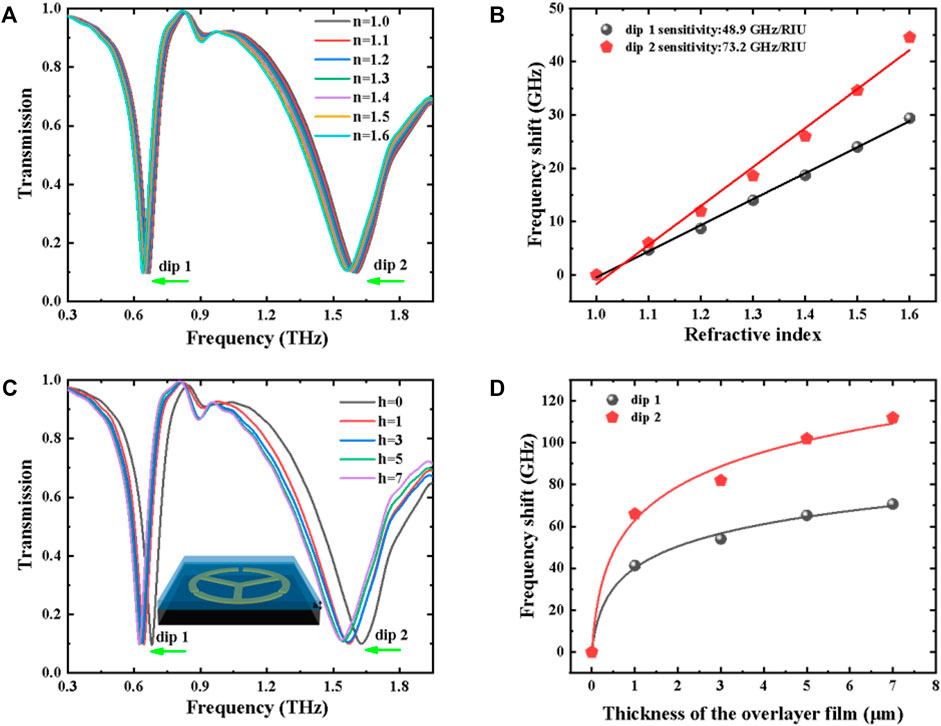
FIGURE 3. (A) Transmission spectra of the TSR resonator under different refractive indices. (B) Frequency shift (∆f) as a function of refractive index for dip 1 and dip 2. (C) Transmission spectra of the TSR resonator under various overlayer thicknesses. The inset is the schematic diagram of the layered analyte coating on the surface of a meta-biosensor. (D) Frequency shift (∆f) as a function of thickness for dip 1 and dip 2.
In order to characterize the sensitivity of the proposed MM biosensor, a 4-μm-thick analyte coating on the surface of the THz chip was evaluated at various refractive indices, as shown in Figure 3A. Upon increasing n from 1.1 to 1.6, the resonance frequencies of the LC and dipole modes experience an obvious shift toward low frequency. The linear relationship between the frequency shift and the refractive index is shown in Figure 3B, the sensitivities for dip 1 and dip 2 are 48.9 and 73.2 GHz/RIU, and the corresponding FOMs are 0.543 and 0.191, respectively. Also, the thickness-dependent transmission spectra are investigated and displayed in Figure 3C. It can be seen from Figure 3D that the proposed MM biosensor with a thicker analyte has a higher sensitivity than that with a thinner analyte, and the frequency shift and the overlayer thickness show a non-linear relationship. Hence, we can realize qualitative and quantitative identifications based on different concentrations (or thicknesses) and substances (or refractive indices) simultaneously.
According to the LC circuit model, the resonance frequency f0 can be defined as [29, 30]
where the equivalent inductance L is determined by the geometric parameters of the MM structure. Based on O’Hara’s research [17], the equivalent capacitance (C) is determined approximately by the following equation: C=C1 + C2 + C3 + C4 + C5, where C1, C2, C3, C4, and C5 can be expressed as the flux within the substrate, the fringing flux between the substrate and the MM structure, the flux within the gap of the MM structure, the flux within the overlayer, and the fringing flux between the overlayer and the MM structure, respectively. Hence, the overlayer coating on the surface of the MM biosensors chip can effectively induce the redshift of dip 1 due to the increase of C2, C3, C4, and C5. Furthermore, we additionally designed the single split ring (SSR) and double split ring (DSR) MM biosensors (Supplementary Figure S2A). It can be seen from Supplementary Figures S2B, S2C that the proposed TSR biosensor has a higher sensitivity than SSR and DSR biosensors due to the enhancement of the equivalent capacitance and the superimposition of the resonance peak.
In the case of TSR MM, the dipole resonance is not composed of an isolated segment, but of a pair of segments (such as gap antenna) [31, 32]. The resonant frequency of the gap antenna is mainly governed by the resonance of each individual arm and the near-field coupling that results in the redshift of the resonant peak (or dip) [33–36]. Resonance angular frequency ωres is described as ωres = ωd-Δω, where ωd is the resonant angular frequency for the single strip segment and Δω is the redshift of the resonant dip (or peak) due to near-field coupling between two terminals. ωd can be expressed as [20]
Here, the value of d depends on the geometric size of the single strip. εeff is the effective permittivity of the dielectric environment surrounding the MM biosensor as follows:
where εair, εsam, and εsub represent the dielectric constants of the air, sample, and substrate, respectively, and k is the filling fraction of the analyte surrounding the MM chip. If εair ≈ 1, the εeff can be simplified as
For the 4-μm-layered analyte, Δω can be considered as a constant, whereas k and εeff increase gradually with the increasing thickness and refractive index, respectively. As a result, the resonance frequency of dip 2 decreases with the increase of thickness and refractive index.
After the biological modification, we can observe under the microscope that the analyte covered on the surface of MM tends to partial aggregation instead of uniform film, which is distinctly different from the overlayer simulations, as shown in Figure 3. Therefore, in order to further explore the influence of the analyte aggregation on the sensing performance, we used discrete hemispheres with a radius of 3 μm located randomly at different positions of the MM surface to compare their sensing characteristics. Figure 4 shows notable discrepancy in sensing performance due to the inhomogeneity of the sample distribution, which has been categorized into four cases with the same quantity located at different positions: (I) all analytes are adhered to Au metal of the TSR resonator, (II) partial analytes are gathered in three gaps, (III) partial analytes are stuck to the Au circle segments, and (IV) partial analyte is localized near the three strips inside the ring. As shown in Figure 5, the frequency shift and sensitivity caused by the first case (I) are approximately equal to the sum of the latter three cases (II, III, and IV). It is also interesting to note that the redshifts for both dip 1 and dip 2 can hardly be observed in the cases of III and IV even if they occupy more surface area. Conversely, in the case of II, even less space fraction can lead to a larger redshift. Thus, the sensing performance of the proposed THz-MM biosensor is mainly determined by the aggregated analytes concentrated at three gaps.
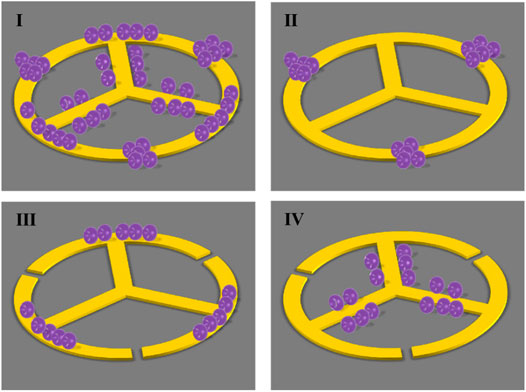
FIGURE 4. Four cases of analytes gathering on the surface of MM sensors.
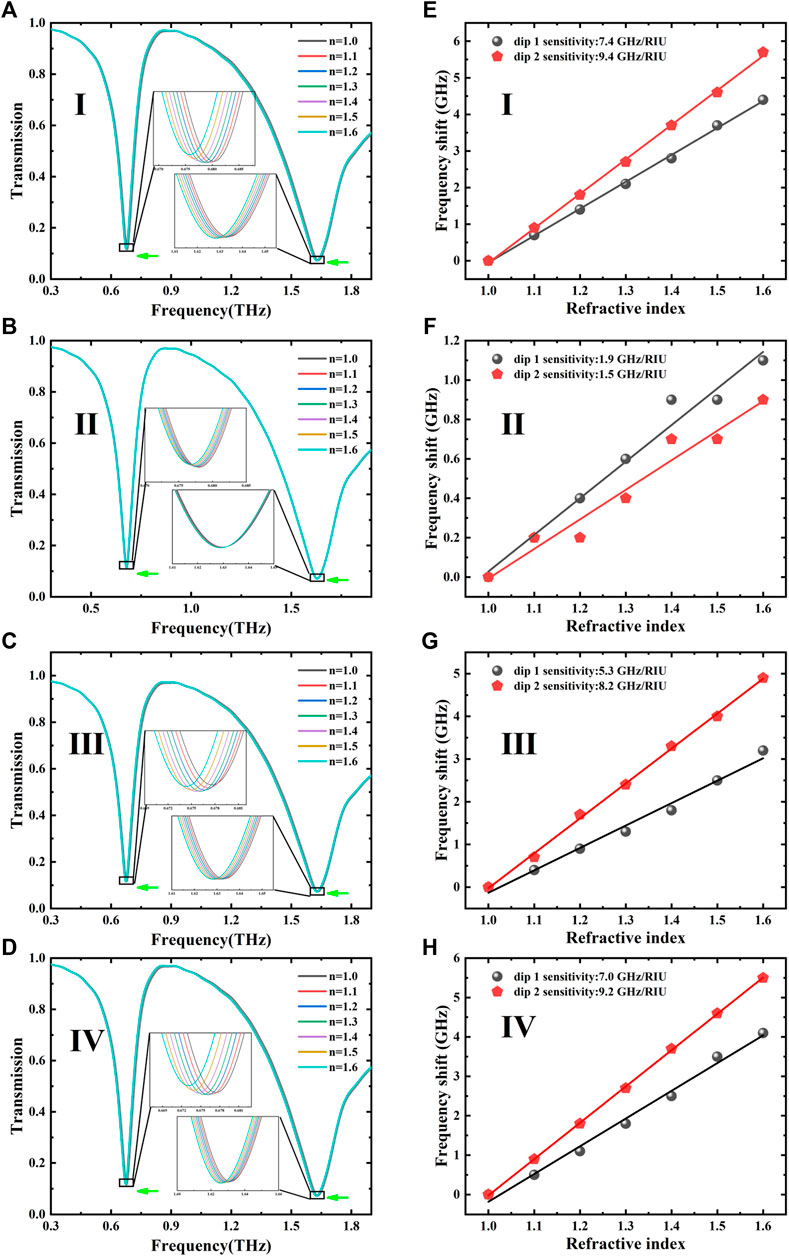
FIGURE 5. (A–D) Transmission spectra of MM sensors for four cases under various refractive indices. (E–H) Corresponding relationship between the frequency shift and the refractive index.
The relationship between the frequency shift and the refractive index in the four cases was obtained and fitted, as shown in Figures 5E–H. The simulated S and FOM for the LC and dipole resonances, respectively, are summarized in Table 2. For the LC oscillation of dip 1, the cases of II, III, and IV are mainly affected by C3, C5, and C5, respectively. Moreover, C3 becomes the main factor because the electric energy concentrated at the opening gaps results in a higher sensitivity and FOM for the case of II. In addition, more splits will lead to the increase in the effective area of near-field coupling, which leads to a larger frequency shift.
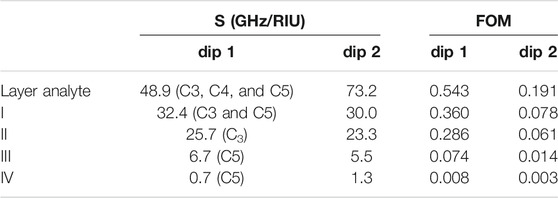
TABLE 2. Summary of sensitivity and FOM for the simulated LC and dipole resonances.
For the electric dipole oscillator of dip 2, k is nearly constant in the cases of II–IV due to the same amount of analyte on the surface of the MM unit. The significant difference on sensitivity can be attributed to near-field coupling near the gap area, where the localized electromagnetic (EM) field provides a strong interaction between the THz wave and the analyte, resulting in a high sensitivity and FOM in the case of II. In the III and IV cases, however, the coupling between the analyte on the ring (or rod) and the THz EM field is very weak, resulting in a small amount of redshift and sensitivity, even close to zero. The simulation results confirm that the resonant properties of the LC circuit and gap antennas are strongly determined by the field enhancement and the near-field coupling in the gap area.
In addition, the corresponding four cases with different quantities located at different positions (for the cases of I, II, III, and IV) are discussed in Supplementary Figure S3. It can be seen that the frequency shifts in the cases of III and IV with more analytes are hardly observable, while a significant redshift in the case of II with fewer analytes is presented. Furthermore, we have explored the sensing performance under a random distribution with different quantities located promiscuously at different positions (Supplementary Figure S4). In the cases of I, III, and IV, the similar frequency shift can be exhibited when the analyte gathers at the gaps (Supplementary Figure S5).
The measured THz temporal waveforms of air, silicon substrate, and TSR metamaterial are shown in Figure 6A. Compared with the free space (air), the transmitted THz pulses using a silicon wafer and the TSR sample show a clear delay time of 8 ps due to a high refractive index and a 1-mm thickness of the silicon substrate. Unlike the clean ring-down signal of blank silicon substrate (Eref), the time-domain THz signal transmitted through TSR chip (Esam) shows a slight decrease in amplitude and a strong oscillation after 16 ps, which can be attributed to the resonance absorption from LC and dipole oscillations.
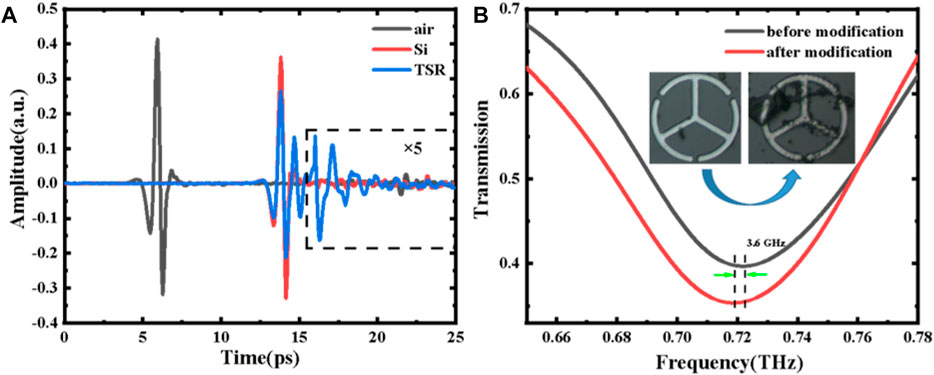
FIGURE 6. (A) Measured time-domain waveforms. (B) Comparison of the transmission spectra of the proposed MM sensors before and after modification (TSR and 0 μg/ml). The inset shows the microscopy images of the sample (TSR, 0 μg/ml).
The transmission spectra of the proposed MM sensor before and after modification (TSR and 0 μg/ml) are shown in Figure 6B, and dip 1 is chosen to detect the S1 protein due to its more excellent FOM. Compared with the bare TSR metamaterial (unmodified TSR chip), the resonance frequency of the modified TSR chip (0 μg/ml) shows a redshift of 3.6 GHz for dip 1, which convinces that the biological modification on the surface of the MM chip is successful. Figure 7A shows the measured transmission spectra of the S1 protein samples with different concentrations. The shifts in frequency fit linearly with concentration varying from 1 to 30 μg/ml, which can be described as: Δf = 5.563 + 1.084*x, as illustrated in Figure 7B. The increase of the concentration results in the increase of the filling fraction k and the effective dielectric constant εeff. Meanwhile, with increasing S1 protein concentration, the FWHM of dip 1 is significantly increased due to the absorption of the analyte. The FWHM shown in Figure 7C is also proportional to the concentration, which is defined as Δv = 0.130 + 0.002*x. Combined with the frequency shift and FWHM, the concentration of S1 protein solution can be estimated more accurately. In our measurements, the limit of detection (LOD) is less than 5 ng, achieving a high sensitivity, quantitative, and label-free detection of the SARS-CoV-2 S1 protein.
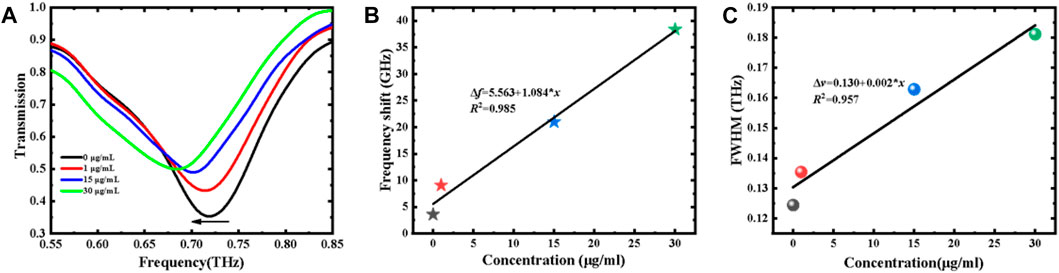
FIGURE 7. (A) Measured transmission spectra of S1 protein with various concentrations. (B) Resonance frequency shift and (C) FWHM variation vs. concentration.
Ultimately, we summarized and listed the important results of some analytical strategies in Table 3, which allows to reasonably compare the positives and negatives of different methods [9, 27, 37–39] for the detection of SARS-CoV-2. The THz meta-biosensor is meeting the constant need for selectivity, repeatability, label-free, on-chip, and sensitivity. Also, THz waves have low energy (∼few meV) that is below the ionization energies of atoms and molecules, making it possible to analyze materials without impairing the original bioactivity. Although a variety of effective approaches have been proposed to improve their sensing performance including specificity and sensitivity, THz MM biosensors cannot fully meet the real-world requirements, especially for clinical analysis where the sample matrix often contains the target protein and many other proteins. We will extend our research on SARS-CoV-2 and similar virus detection by conducting the following strategies [40–42]: 1) selecting ultrahigh specific antibodies or aptamers as biorecognizing elements can prove a great level of specificity and quantitative detection of SARS-CoV-2 S1 protein in aqueous environments; 2) further improvement of micro/nano processing technology resulting to in low cost of THz-MM chips is needed; 3) real-time monitoring with microfluidic devices is required for the large-scale application, while there is no need for qualified personnel and a special room; and 4) the meta-biosensor can be reusable.
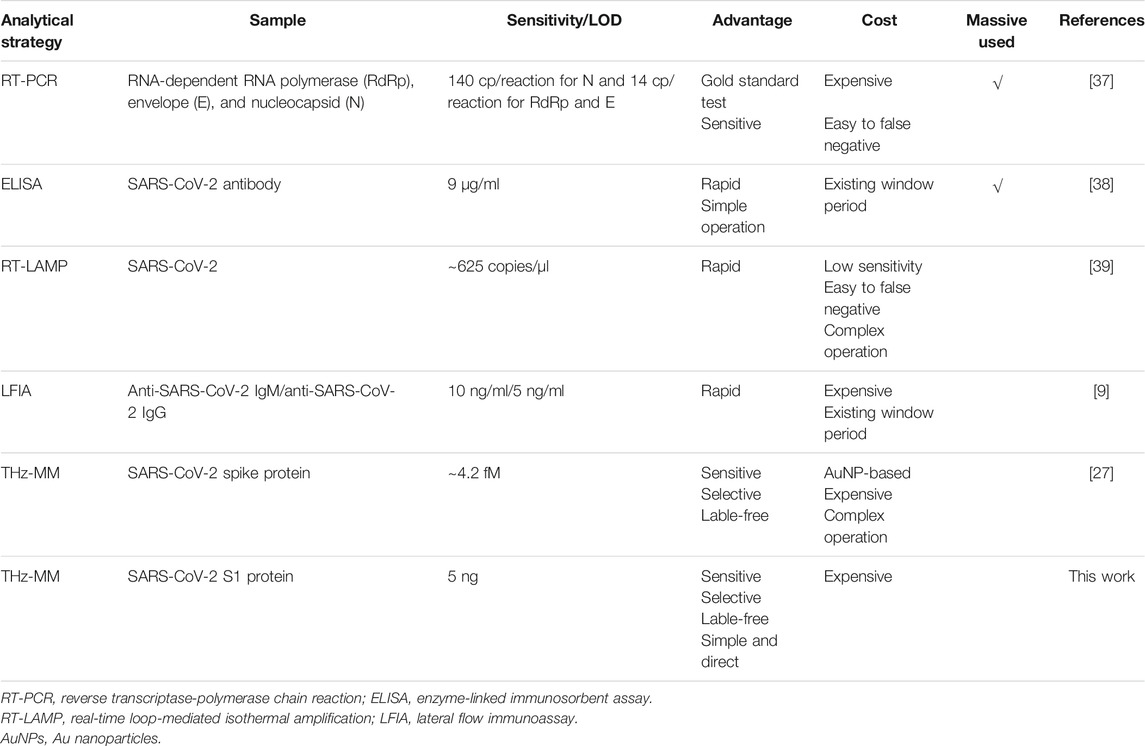
TABLE 3. Comparison of current strategies for SARS-CoV-2 detection.
In summary, a TSR MM biosensor was proposed to detect the SARS-CoV-2 S1 protein with high sensitivity and label-free detection. In the simulation, the discrete hemispheres were used to explore the influence of analyte aggregation on the sensing performance, and the results prove that the frequency shift is mainly influenced by the change of the environmental dielectric constant at the MM gaps and the amount of analyte, which is in good agreement with the theory. The experimental results demonstrate the sensing capability of the THz-MM biosensor for the qualitative analysis of the S1 protein with high sensitivity and label-free detection. In addition, integrated with the frequency shift and FWHM, the sensing accuracy of S1 protein concentration can be further enhanced.
The original contributions presented in the study are included in the article/Supplementary Material, further inquiries can be directed to the corresponding author.
Conceptualization: QN and YY. Methodology: QN and YY. Formal analysis: YY and QN. Investigation: RZ and QN. Data curation: QN. Writing—original draft preparation: QN. Writing—review and editing: YY. Visualization: RZ. Supervision: YY. Project administration: YY. Funding acquisition: YY and QN.
This work was supported by the National Key R&D Program of China (Grant Nos. 2017YFB0405402 and 2020YFB2009303), the National Natural Science Foundation of China (Grant No. 62075248), and the Graduate Research and Practice Projects of Minzu University of China (Grant No. SJCX2021025).
The authors declare that the research was conducted in the absence of any commercial or financial relationships that could be construed as a potential conflict of interest.
All claims expressed in this article are solely those of the authors and do not necessarily represent those of their affiliated organizations, or those of the publisher, the editors, and the reviewers. Any product that may be evaluated in this article, or claim that may be made by its manufacturer, is not guaranteed or endorsed by the publisher.
We acknowledge Dr. Dongwei Zhai for English language checking.
The Supplementary Material for this article can be found online at: https://www.frontiersin.org/articles/10.3389/fphy.2022.859924/full#supplementary-material
1. Wu A, Peng Y, Huang B, Ding X, Wang X, Niu P, et al. Genome Composition and Divergence of the Novel Coronavirus (2019-nCoV) Originating in China. Cell Host & Microbe (2020) 27(3):325–8. doi:10.1016/j.chom.2020.02.001
2. Jiang M, Wen J, Pan D, Zhou J, Lv Y,Wei S. Structure and Function of SARS-CoV-2 Spike Protein and its Receptor. Chin Pharmacol Bull (2020) 36(11):1497–501. doi:10.3969/j.issn.1001-1978.2020.11.004
3. Zhen-lu L, Matthias B. Neuropilin-1 Assists SARS-CoV-2 Infection by Stimulating the Separation of Spike Protein Domains S1 and S2. Biophysical J (2021) 120(14):2828–37. doi:10.1016/j.bpj.2021.05.026
4. Aljindan RY, Al-Subaie AM, Al-Ohali AI, Kumar D T, Doss C GP, Kamaraj B. Investigation of Nonsynonymous Mutations in the Spike Protein of SARS-CoV-2 and its Interaction with the ACE2 Receptor by Molecular Docking and MM/GBSA Approach. Comput Biol Med (2021) 135:104654. doi:10.1016/j.compbiomed.2021.104654
5. Li F. Structure, Function, and Evolution of Coronavirus Spike Proteins. Annu Rev Virol (2016) 3(1):237–61. doi:10.1146/annurev-virology-110615-042301
6. Zhang Z, Gao Z, Huang W. Progress in Novel Coronavirus SARS-CoV-2 Detection and Analysis Technology. Chin J Pharm Anal (2020) 40:1715–26. doi:10.16155/j.0254-1793.2020.10.01
7. Chan WM, Ip JD, Chu AWH, Yip CCY, Lo LS, Chan KH, et al. Identification of Nsp1 Gene as the Target of SARS‐CoV‐2 Real‐time RT‐PCR Using Nanopore Whole‐genome Sequencing. J Med Virol (2020) 92(11):2725–34. doi:10.1002/jmv.26140
8. Nalla AK, Casto AM, Huang MW, Perchetti GA, Sampoleo R, Shrestha L, et al. Comparative Performance of SARS-CoV-2 Detection Assays Using Seven Different Primer-Probe Sets and One Assay Kit. J Clin Microbiol (2020) 58:6. doi:10.1128/JCM.00557-20
9. Bayin Q, Huang L, Ren C, Fu Y, Ma X, Guo J. Anti-SARS-CoV-2 IgG and IgM Detection with a GMR Based LFIA System. Talanta (2021) 227:122207. doi:10.1016/j.talanta.2021.122207
10. Li Y, Yao L, Li J, Chen L, Song Y, Cai Z, et al. Stability Issues of RT‐PCR Testing of SARS‐CoV‐2 for Hospitalized Patients Clinically Diagnosed with COVID‐19. J Med Virol (2020) 92(7):903–8. doi:10.1002/jmv.25786
11. Pan Y, Zhang D, Yang P, Poon LLM, Wang Q. Viral Load of SARS-CoV-2 in Clinical Samples. Lancet Infect Dis (2020) 20(4):411–2. doi:10.1016/S1473-3099(20)30113-4
12. Qi N, Zhang Z, Xiang Y, Yang Y, Liang X, Harrington Pd. B. Terahertz Time-Domain Spectroscopy Combined with Support Vector Machines and Partial Least Squares-Discriminant Analysis Applied for the Diagnosis of Cervical Carcinoma. Anal Methods (2015) 7(6):2333–8. doi:10.1039/C4AY02665A
13. Yang Y, Lei X, Yue A, Zhang Z. Temperature-Dependent THz Vibrational Spectra of Clenbuterol Hydrochloride. Sci China Phys Mech Astron (2013) 56(4):713–7. doi:10.1007/s11433-013-5039-z
14. Xu W, Xie L, Zhu J, Wang W, Ye Z, Ma Y, et al. Terahertz Sensing of Chlorpyrifos-Methyl Using Metamaterials. Food Chem (2017) 218:330–4. doi:10.1016/j.foodchem.2016.09.032
15. Liu J. High-Sensitivity Detection Method for Organochlorine Pesticide Residues Based on Loop-Shaped Absorber. Mater Chem Phys (2020) 242:122542. doi:10.1016/j.matchemphys.2019.122542
16. Qin B, Li Z, Hu F, Hu C, Chen T, Zhang H, et al. Highly Sensitive Detection of Carbendazim by Using Terahertz Time-Domain Spectroscopy Combined with Metamaterial. IEEE Trans Thz Sci Technol (2018) 8(2):149–54. doi:10.1109/tthz.2017.2787458
17. O'Hara JF, Singh R, Brener I, Smirnova E, Han J, Taylor AJ, et al. Thin-Film Sensing with Planar Terahertz Metamaterials: Sensitivity and Limitations. Opt Express (2008) 16(3):1786–95. doi:10.1364/OE.16.001786
18. Tao H, Strikwerda AC, Liu M, Mondia JP, Ekmekci E, Fan K, et al. Performance Enhancement of Terahertz Metamaterials on Ultrathin Substrates for Sensing Applications. Appl Phys Lett (2010) 97(26):261909. doi:10.1063/1.3533367
19. Tao H, Chieffo LR, Brenckle MA, Siebert SM, Liu M, Strikwerda AC, et al. Metamaterials on Paper as a Sensing Platform. Adv Mater (2011) 23(28):3197–201. doi:10.1002/adma.201100163
20. Wu X, Quan B, Pan X, Xu X, Lu X, Gu C, et al. Alkanethiol-Functionalized Terahertz Metamaterial as Label-free, Highly-Sensitive and Specificbiosensor. Biosens Bioelectron (2013) 42:626–31. doi:10.1016/j.bios.2012.10.095
21. Wang G, Zhu F, Lang T, Liu J, Hong Z, Qin J. All-Metal Terahertz Metamaterial Biosensor for Protein Detection. Nanoscale Res Lett (2021) 16(1):109. doi:10.1186/s11671-021-03566-3
22. Zhang Z, Yang G, Fan F, Zhong C, Yuan Y, Zhang X, et al. Terahertz Circular Dichroism Sensing of Living Cancer Cells Based on Microstructure Sensor. Analytica Chim Acta (2021) 1180:338871. doi:10.1016/j.aca.2021.338871
23. Yang Y, Xu D, Zhang W. High-sensitivity and Label-Free Identification of a Transgenic Genome Using a Terahertz Meta-Biosensor. Opt Express (2018) 26(24):31589–98. doi:10.1364/OE.26.031589
24. Hong JT, Jun SW, Cha SH, Park JY, Lee S, Shin GA, et al. Enhanced Sensitivity in THz Plasmonic Sensors with Silver Nanowires. Sci Rep (2018) 8:15536. doi:10.1038/s41598-018-33617-2
25. Park SJ, Son BH, Choi SJ, Kim HS, Ahn YH. Sensitive Detection of Yeast Using Terahertz Slot Antennas. Opt Express (2014) 22(25):30467–72. doi:10.1364/OE.22.030467
26. Yoon SA, Cha SH, Jun SW, Park SJ, Park J-Y, Lee S, et al. Identifying Different Types of Microorganisms with Terahertz Spectroscopy. Biomed Opt Express (2019) 11(1):406–16. doi:10.1364/BOE.376584
27. Ahmadivand A, Gerislioglu B, Ramezani Z, Kaushik A, Manickam P, Ghoreishi SA. Functionalized Terahertz Plasmonic Metasensors: Femtomolar-Level Detection of SARS-CoV-2 Spike Proteins. Biosens Bioelectron (2021) 177:112971. doi:10.1016/j.bios.2021.112971
28. Zhao R, Zou B, Zhang G, Xu D, Yang Y. High-Sensitivity Identification of Aflatoxin B1 and B2 Using Terahertz Time-Domain Spectroscopy and Metamaterial-Based Terahertz Biosensor. J Phys D: Appl Phys (2020) 53(19):195401. doi:10.1088/1361-6463/ab6f90
29. He X. Tunable Terahertz Graphene Metamaterials. Carbon (2015) 82:229–37. doi:10.1016/j.carbon.2014.10.066
30. Cheng Y, Nie Y, Gong R. A Polarization-Insensitive and Omnidirectional Broadband Terahertz Metamaterial Absorber Based on Coplanar Multi-Squares Films. Opt Laser Technol (2013) 48:415–21. doi:10.1016/j.optlastec.2012.11.016
31. Yang Y-P, Zhang W-L, Singh R. Resonance Properties of THz Plasmonic Dipole-Bowtie Antenna Array: The Critical Role of the Substrate. Chin Phys. B (2014) 23(12):568–72. doi:10.1088/1674-1056/23/12/128702
32. Yang Y, Singh R, Zhang W. Anomalous Terahertz Transmission in bow-tie Plasmonic Antenna Apertures. Opt Lett (2011) 36(15):2901–3. doi:10.1364/ol.36.002901
33. Ghenuche P, Cherukulappurath S, Taminiau TH, van Hulst NF, Quidant R. Spectroscopic Mode Mapping of Resonant Plasmon Nanoantennas. Phys Rev Lett (2008) 101(11):116805. doi:10.1103/physrevlett.101.116805
34. Fischer H, Martin OJF. Engineering the Optical Response of Plasmonic Nanoantennas. Opt Express (2008) 16(12):9144–54. doi:10.1364/oe.16.009144
35. Ding W, Bachelot R, Kostcheev S, Royer P, Espiau de Lamaestre R. Surface Plasmon Resonances in Silver Bowtie Nanoantennas with Varied bow Angles. J Appl Phys (2010) 108(12):124314. doi:10.1063/1.3524504
36. Barnard ES, White JS, Chandran A, Brongersma ML. Spectral Properties of Plasmonic Resonator Antennas. Opt Express (2008) 16(21):16529–37. doi:10.1364/oe.16.016529
37. Favaro M, Mattina W, Pistoia ES, Gaziano R, Di Francesco P, Middleton S, et al. A New Qualitative RT-PCR Assay Detecting SARS-CoV-2. Sci Rep (2021) 11:18955. doi:10.1038/s41598-021-98114-5
38. Kasetsirikul S, Umer M, Soda N, Sreejith KR, Shiddiky MJA, Nguyen N-T. Detection of the SARS-CoV-2 Humanized Antibody with Paper-Based ELISA. Analyst (2020) 145:7680–6. doi:10.1039/D0AN01609H
39. Dudley DM, Newman CM, Weiler AM, Ramuta MD, Shortreed CG, Heffron AS, et al. Optimizing Direct RT-LAMP to Detect Transmissible SARS-CoV-2 from Primary Nasopharyngeal Swab and Saliva Patient Samples. PLoS ONE (2020) 15:e0244882. doi:10.1101/2020.08.30.20184796
40. Liu Y, Liu H, Tang M, Huang J, Liu W, Dong J, et al. The Medical Application of Terahertz Technology in Non-invasive Detection of Cells and Tissues: Opportunities and Challenges. RSC Adv (2019) 9:9354–63. doi:10.1039/c8ra10605c
41. Zhou J, Zhao X, Huang G, Yang X, Zhang Y, Zhan X, et al. Molecule-Specific Terahertz Biosensors Based on an Aptamer Hydrogel-Functionalized Metamaterial for Sensitive Assays in Aqueous Environments. ACS Sens. (2021) 6:1884–90. doi:10.1021/acssensors.1c00174
Keywords: SARS-CoV-2 S1 protein, THz-TDS, biosensor, near-field coupling, sensitivity
Citation: Niu Q, Zhang R and Yang Y (2022) High Sensitivity and Label-Free Detection of the SARS-CoV-2 S1 Protein Using a Terahertz Meta-Biosensor. Front. Phys. 10:859924. doi: 10.3389/fphy.2022.859924
Received: 22 January 2022; Accepted: 14 February 2022;
Published: 16 March 2022.
Edited by:
Xiaoyong Hu, Peking University, ChinaReviewed by:
Zhuochen Du, Peking University, ChinaCopyright © 2022 Niu, Zhang and Yang. This is an open-access article distributed under the terms of the Creative Commons Attribution License (CC BY). The use, distribution or reproduction in other forums is permitted, provided the original author(s) and the copyright owner(s) are credited and that the original publication in this journal is cited, in accordance with accepted academic practice. No use, distribution or reproduction is permitted which does not comply with these terms.
*Correspondence: Yuping Yang, eXB5YW5nQG11Yy5lZHUuY24=
Disclaimer: All claims expressed in this article are solely those of the authors and do not necessarily represent those of their affiliated organizations, or those of the publisher, the editors and the reviewers. Any product that may be evaluated in this article or claim that may be made by its manufacturer is not guaranteed or endorsed by the publisher.
Research integrity at Frontiers
Learn more about the work of our research integrity team to safeguard the quality of each article we publish.