- 1Key Laboratory of Ministry of Education for Geomechanics and Embankment Engineering, Hohai University, Nanjing, China
- 2Research Institute of Geotechnical Engineering, Hohai University, Nanjing, China
- 3Nuclear Industry Huzhou Engineering Survey Institute Co. Ltd., Huzhou, China
The seepage failure induced by high water pressure along the fault structural plane is one of the main factors for the deformation and failure of underground caverns. Based on the pipe domain seepage model with the discrete element particle flow method, the law of flow conservation is introduced, and the pressure renewal equation is improved by connecting the change of mechanical volume in timestep with the effective stress. The model for pipe domain seepage analysis of fractured rock mass is established, and the sample seepage model is used to simulate and verify the seepage process. Then, seepage failure induced by water pressure in an underground tunnel is analyzed by using this model. The results show that the improved pipe domain seepage model conforms to Darcy’s law, the seepage velocity of the model can be changed by controlling the viscosity coefficient, and the tunnel failure phenomenon is consistent with the actual phenomenon in the practical project. The research results can provide a theoretical basis and method for investigating the deformation and failure of underground caverns under complex seepage.
Introduction
Seepage effects are crucial for evaluating the stability of geotechnical engineering, and seepage mainly occurs along structural planes, such as the discontinuous plane, faults, and joints in rock mass. Thus, revealing the mechanical behaviors of seepage in rock mass with structural planes is important for the theoretical research and guiding the engineering practice.
The finite element method and finite difference method are widely used for the numerical analysis of seepage. In terms of the finite element method, a variety of seepage finite element methods [1, 2] were developed and used to analyze the seepage path, deformation and failure of rainfall, water-rich foundation pit, and cross-river tunnel [3–7]. However, these methods are mostly used in the homogeneous continuous medium, which cannot well reflect the hydraulic conductivity and dominant flow effect of fracture network in real structural rock masses, and ignore the microseepage damage to the rock. Under the erosion of high water pressure seepage, microcracks gradually appear inside the rock. The integrity of the rock is destroyed by the appearance of the microcracks, and the seepage inside the rock is aggravated, which further accelerates the erosion of the rock, promotes the gradual increase and expansion of the microcracks, and even leads to the penetration of microcracks. Finally, the damage of rocks is caused. Therefore, the discrete element method is emerged in the simulation of seepage in rock mass as the DEM can well construct the fractures inside rock mass and capture the micro-mechanical behaviors inside the fractures. By using the coupling method of computational fluid dynamics and discrete element method (CFD-DEM), behaviors in the seepage process, such as erosion, landslide, and the relationship between hydraulic gradient and flow velocity [8–11], can be investigated. In addition, a two-dimensional fracture–pore mixed seepage model based on the finite discrete element method (FDEM) was proposed [12], which can analyze the seepage process in a single-fracture or multi-fracture porous medium.
In recent years, research on seepage deformation and failure of geotechnical medium by the particle flow method has attracted more and more attention. To consider the internal seepage of geotechnical medium, there are two main methods: one is the coarse grid method and the other is the pipe domain method. The former is a simplified method and commonly used to simulate seepage in the particle medium. The fluid flow is determined by solving the average fluid pressure and velocity of each fluid grid. This algorithm is relatively accurate and reliable, but the flow and solid calculation should be integrated. As the particle position changes all the time, the process is cumbersome. For example, the coarse grid fluid method was used in the particle flow code (PFC) [13] to research the internal phenomenon and seepage direction of granular soil seepage process, and some certain results are achieved. The other method, the pipe domain seepage model, is introduced into the particle system; with this method, each domain has a certain fluid pressure, and the flow occurs through flow pipes; the flow and flow velocity vary with the size of the tube. Because the solid and fluid calculations are based on the same particle system, the solid–fluid coupling can be realized more conveniently, and the method has a better effect in rock fracture simulation.
Based on the pipe domain seepage model, the law of flow conservation is introduced into its governing equation, the pressure renewal equation is deduced, and an improved pipe domain seepage model is established with the particle flow code. Then, its applicability is verified by the simulation of sample seepage and high water pressure tunnel seepage, and the deformation and failure of high water pressure tunnel under seepage are investigated. This method was used to initially simulate hydraulic fracturing of fractured rock mass from a mesoscopic perspective [14].
Pipe Domain Seepage Model
Generation of Pipe Domain Model
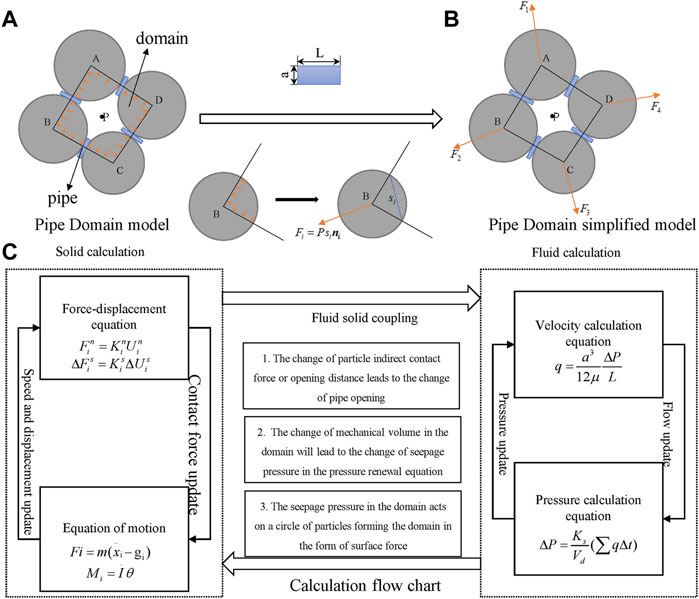
Seepage is simulated by introducing the domain and pipe into the particle system in the pipe domain seepage model. With the particle flow code, a series of particles are usually bonded to represent mechanical properties of geotechnical materials. As shown in Figure 1, a domain is formed by interconnected particles, and a pipe is formed by particle contacts. Firstly, the network of domain and pipe is formed on the particles of model. Each domain is composed of a circle of closed particles, and the seepage pressure in the domain represents the fluid pressure at the centroid of the domain. As shown in Figure 1A, the contact between each two adjacent particles in the closed particle circle is described as a pipe, each pipe is connected with two adjacent domains, and seepage is considered to occur in the pipe. The pipe domain seepage model can well describe the real physical process. The rock and soil mass are granular media, and the water pressure mainly exists in the pore units between particles. The transmission of seepage between particles is similar to the flow transmission in the pipe.

FIGURE 1. Pipe domain model and calculation flow chart. (A) and (B) are the force diagram of fluid pressure on particles, and (C) is the flow chart of fluid solid coupling.
The pressure gradient caused by seepage in the pipe is assumed to be concentrated at the corresponding contact, and the fluid pressure in the domain is uniform and acts on the particles with the same size. As shown in Figure 1B, the resultant force of the fluid pressure in the domain on each particle is
where
Pressure Governing Equation
The water flow in each pipe is assumed to satisfy the smooth parallel plate [15] flow, and its velocity (flow per unit time) is
where
where
where
In a timestep
where
where
The total stress is assumed to be unchanged; according to the effective stress principle,
According to formulas 5 and 7, the renewal equation of seepage pressure can be derived, such as the following formula:
If the fluid is assumed to be incompressible, the formula above can be simplified to
The physical meaning of the updated equation is clear. When a certain flow (
Coupling Implementation
The mechanical calculation of the network of pipe and domain is based on the particle system, similar to that of the particle flow method. The change of the volume of the domain and the opening of the pipe will be caused by the deformation of the particles. Therefore, the coupling of seepage and stress can be effectively simulated by the pipe domain model. The coupling calculation process is shown in Figure 1C. A certain flow will be transferred through the pipe at each timestep, and the change of seepage pressure will be caused by the inflow or outflow of flow in the domain. Because the whole region is full of domains, the change of seepage field can be reflected by the change of seepage pressure in all domains.
Stable Timestep
In seepage calculation, if the seepage timestep used exceeds the critical timestep, the solution of seepage pressure will oscillate and distort [16]:
where
Method Validation and Infiltration Law
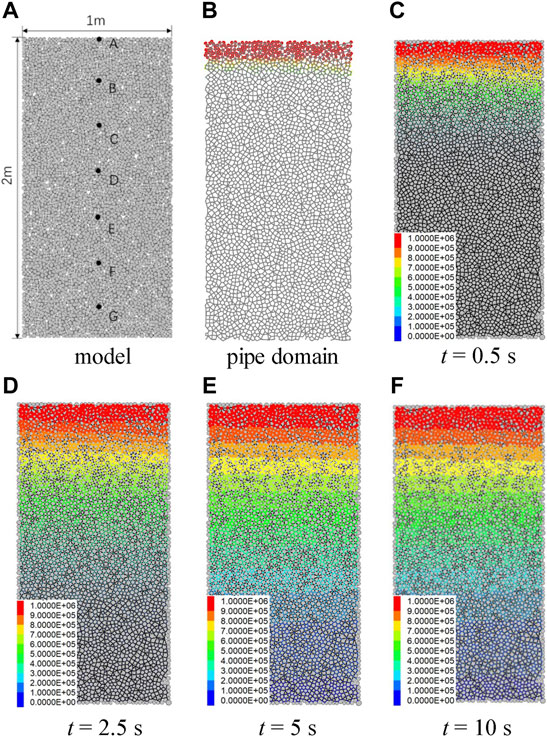
To verify the suitability of the domain–pipe model for simulating seepage, as shown in Figure 2A, the numerical model is constructed, with a width of 1 m and a height of 2 m. The left and right boundaries of the model are impermeable. A fixed water pressure boundary of 1 MPa is applied on the upper side and 0 MPa on the lower side. The fluid is assumed to be incompressible. The seepage pressure here is hyperstatic seepage pressure. As shown in Figure 2B, gray lines are the pipelines, and the seepage pressure is displayed in the form of particles in the center of the domain, that is, the pipe junction. Seven measurement points A (h = 1.9 m), B (h = 1.6 m), C (h = 1.3 m), D (h = 1.0 m), E (h = 0.7 m), F (h = 0.4 m), and G (h = 0.1 m) are set at different heights of the sample.

FIGURE 2. Distribution of seepage pressure in domains at different times under seepage. (A) and (B) are the sample diagram and pipe domain diagram, and (C–F) is the seepage pressure distribution diagram at different times.
The linear parallel bonding model is adopted for the contact between particles. The basic parameters of the particles in the model are as follows: the density is 2500 kg/m3, the range of radius is 0.01–0.015 m, the porosity is 0.18, the parallel bond Young’s modulus is 20 GPa, the parallel bond tensile strength is 0.2 GPa, the parallel bond cohesion strength is 0.1 GPa, the parallel bond friction angle is 80°, the normal-to-shear stiffness ratio is 2.5, the pipe opening is 1 × 10⁻⁵ m, the compression modulus of rock mass is 6 GPa, and the compression modulus of fluid is 2 GPa.
It can be seen from Equation 2 that the permeability coefficient

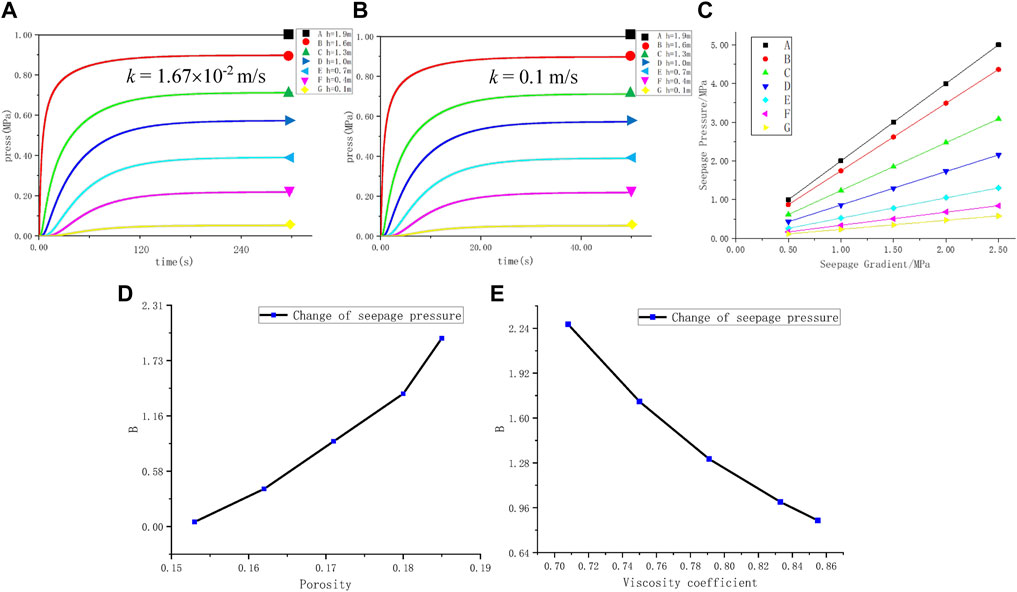
FIGURE 3. Variation curve of seepage pressure. (A) and (B) are seepage pressure curves at different measurement points under different permeability coefficients, (C) is the variation curves of seepage pressure with seepage gradient in steady state, (D) and (E) are the parameter sensitivity analysis of the porosity and viscosity coefficient of the model to the growth rate of seepage pressure of the model.
Therefore, in order to accelerate the progress of simulation, a small viscosity coefficient is set to amplify the flow velocity, and the permeability coefficient k = 0.1 m/s. The distribution of seepage pressure at different times of the rock sample under seepage is shown in Figures 2C–F. The size of seepage pressure is proportional to the particle size. A fixed seepage pressure boundary of 1 MPa is applied on the upper side of the model, and the lower seepage pressure is 0. Therefore, the real seepage simulation path is in the range of 0.1 m ≤ h ≤ 1.9 m, as shown in Figure 2. As the seepage progresses, the model gradually infiltrates from top to bottom, and the seepage pressure also decreases gradually from top to bottom, which basically conforms to the seepage principle.
When the progress time of the seepage is long enough, the inflow flow and outflow flow tend to be consistent, and the seepage reaches stability. As shown in Figure 3B, the seepage pressure versus time at seven measuring points is recorded, respectively. And the pressure at each measuring point tends to be stable after increasing to a certain value.
Sensitivity analysis of the model parameters is carried out by adjusting the parameters within a certain range up and down and observing the change of seepage pressure transmission speed. In order to facilitate the display of the change of seepage pressure, the ordinate is set as the change amplitude, i.e.,
The fixed seepage pressure boundary of 1 MPa, 2 MPa, 3 MPa, 4 MPa, and 5 MPa is set on the upper side of the model, respectively, and 0 MPa is set on the lower side. The seepage process is, respectively, simulated to obtain the seepage pressure when the seepage reaches stability and then draw the variation diagram of the seepage pressure with the seepage gradient, as shown in Figure 3C. The seepage pressure of the model is approximately proportional to the seepage gradient. The seepage pressure distribution of rock sample simulated by the modified pipe domain seepage model is in good agreement with the seepage law, which proves that the model is accurate and applicable.
Application Research of Tunnel Seepage
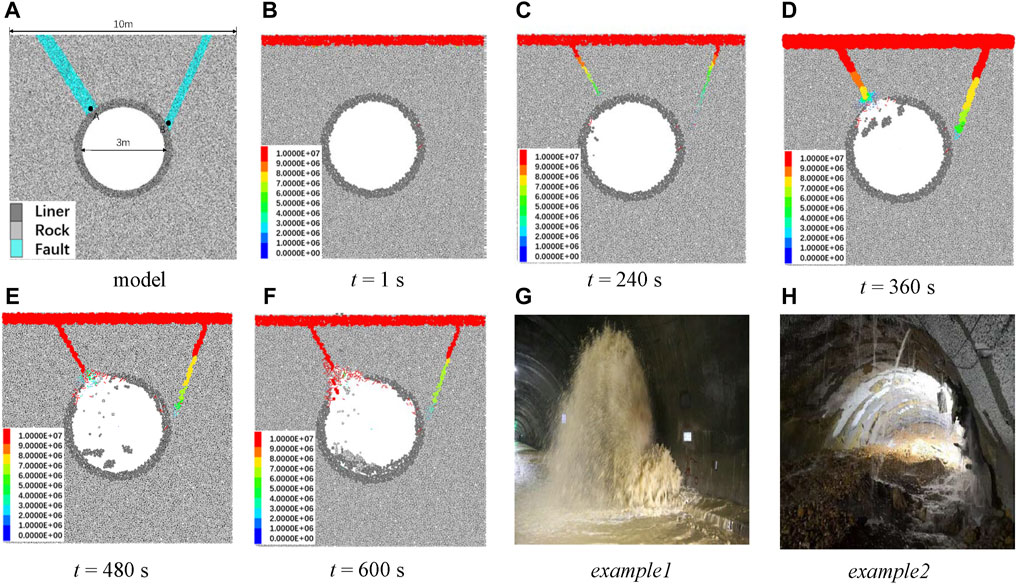
As shown in Figure 4A, the length and width of the surrounding rock mass are 10 m, the diversion tunnel shape is circular, the diameter is 3 m, there is a liner with a width of 0.3 m around, and there are two faults above the tunnel. The model’s boundary conditions are fixed. In the normal working period, the diversion tunnel mainly bears internal water pressure, and in the unused period, such as maintenance, the tunnel changes to bear external water pressure. Due to the deep buried depth and high water pressure in the upper part of the tunnel, a fixed seepage pressure boundary of 10 MPa is applied above the tunnel. The improved pipe domain seepage model is used to simulate the seepage situation of the tunnel. The micro-parameters of the rock mass are basically consistent with those of the rock sample. The compression modulus of the rock mass is 6 GPa, the compression modulus of the fluid is 2 GPa, and the porosity is 0.18. The parameters of fault are as follows: the deformation modulus is 1.8 GPa, the parallel bond Young’s modulus is 6 GPa, the parallel bond tensile strength is 0.06 GPa, the parallel bond cohesion strength is 0.03 GPa, the parallel bond friction angle is 30°, and the pipe opening is 1 × 10⁻⁴ m. The parameters of liner and the junction between liner and rock mass are as follows: the deformation modulus is 3 GPa, the parallel bond Young’s modulus is 10 GPa, the parallel bond tensile strength is 0.1 GPa, the parallel bond cohesion strength is 0.05 GPa, the parallel bond friction angle is 50°, and the pipe opening is 1 × 10⁻⁵m. During the numerical simulation, the timestep is set to 1 × 10⁻⁷, that is, the simulation is carried out for 1×10⁷ cycles for 1 s. The real time is set as the termination condition in the simulation process. When the corresponding number of seconds is reached, the model stops the simulation.

FIGURE 4. Damage and seepage pressure distribution of the tunnel at different times under high water pressure. (A) is the tunnel model diagram, (B–F) is the diagram of tunnel seepage pressure, deformation and failure at different times, (G) and (H) are seepage failure diagrams in practical engineering.
The distribution of seepage pressure at different times is shown in Figures 4B–F. Under the action of high water pressure, due to the low strength of rock mass near the fault and structural planes, seepage mainly occurs along the fault. With the development of seepage, fractures gradually appear near the junction of the tunnel and the fault and continue to develop along the fault under the action of seepage, resulting in local damage to the tunnel liner. As is shown in Figure 4D, point A begins to be damaged under the action of seepage. The failure gradually develops outward along the fault. With the development of fractures, some section of the surrounding rock begins to be damaged. In Figures 4E,F, due to the influence of small fault width and low location, seepage failure also began to occur at point B after point A was damaged for a period of time. The whole process of deformation and failure is consistent with the actual engineering phenomenon as is shown in Figures 4G,H.
Discussion
The discrete element particle flow pipe domain method can well visualize the microscopic fractures inside the rock mass caused by seepage. Obviously, the strength of the rock mass is an important factor affecting the seepage failure. The lower the strength, the more obvious the influence of seepage failure. In addition, the integrity of the rock also affects the seepage. The size of the porosity in the rock mass, the number of cracks, and the degree of penetration of the cracks all affect the seepage. The greater the internal porosity of the rock mass, the more the number of cracks, the higher the degree of penetration of the cracks, and the more obvious the influence of seepage damage. At the same time, because the solid and the fluid are based on the same particle system, the fluid–solid coupling is more convenient. The improved seepage model of the pipe domain method makes the results more reasonable through the introduction of the principle of flow conservation and the solid compression modulus. However, this method still has shortcomings for the particle processing of the model boundary. At the model boundary, the particle may not be wrapped by the domain, so the seepage state cannot be well reflected in the seepage process. This is also an issue that needs to be addressed in future research.
Conclusion
Based on the discrete element pipe domain seepage model, the concept of flow conservation is introduced to improve the pressure renewal equation and form an improved pipe domain seepage model, which can intuitively analyze the deformation and failure of high water pressure tunnel. The main conclusions are as follows:
1) The law of flow conservation and the compression modulus of solid skeleton
2) The simulation and verification of the seepage process of rock sample show that the seepage simulation results of the improved pipe domain seepage model accord with the seepage law. The model velocity can be adjusted by adjusting the viscosity coefficient
3) The research of seepage failure process of typical projects under high external water pressure shows that this model can reveal the whole process of deformation and failure of near fault tunnel under high water pressure, which is consistent with the actual engineering phenomenon.
Data Availability Statement
The original contributions presented in the study are included in the article/Supplementary Material, further inquiries can be directed to the corresponding author.
Author Contributions
CS conceptualized and designed the study. CS and WZ performed numerical simulations and drafted the manuscript. All authors analyzed the data.
Funding
This work was supported by the National Natural Science Foundation of China (Grant No. 41831278, 51679071) and the Huzhou South Taihu innovation team.
Conflict of Interest
CS is employed by Nuclear Industry Huzhou Engineering Survey Institute Co. Ltd.
The remaining authors declare that the research was conducted in the absence of any commercial or financial relationships that could be construed as a potential conflict of interest.
Publisher’s Note
All claims expressed in this article are solely those of the authors and do not necessarily represent those of their affiliated organizations, or those of the publisher, the editors, and the reviewers. Any product that may be evaluated in this article, or claim that may be made by its manufacturer, is not guaranteed or endorsed by the publisher.
Supplementary Material
The Supplementary Material for this article can be found online at: https://www.frontiersin.org/articles/10.3389/fphy.2022.857158/full#supplementary-material
References
1. Sharma V, Fujisawa K, Murakami A. Space-Time Finite Element Method for Transient and Unconfined Seepage Flow Analysis. Finite Elem Anal Des (2021) 197:103632. doi:10.1016/j.finel.2021.103632
2. Xu M-f., Jiang A-n., Lin G, Xue-liang Z, Wang Y-f. “Analysis of Large-Section Tunnels With Small Spacing in Elastoplastic Stress-Seepage-Damage Model,” in Proceedings of GeoShanghai 2018 International Conference: Tunnelling and Underground Construction (2018). p. 63–73. doi:10.1007/978-981-13-0017-2_6
3. Yuan C, Hu Z, Zhu Z, Yuan Z, Fan Y, Guan H, et al. Numerical Simulation of Seepage and Deformation in Excavation of a Deep Foundation Pit under Water-Rich Fractured Intrusive Rock. Geofluids (2021) 2021:1–10. doi:10.1155/2021/6628882
4. Lü X, Su Z, Huang M, Zhou Y. Strength Reduction Finite Element Analysis of a Stability of Large Cross-River Shield Tunnel Face with Seepage. Eur J Environ Civil Eng (2020) 24:336–53. doi:10.1080/19648189.2017.1383942
5. Liu G, Tong F, Tian B. A Finite Element Model for Simulating Surface Run‐off and Unsaturated Seepage Flow in the Shallow Subsurface. Hydrological Process (2019) 33:3378–90. doi:10.1002/hyp.13564
6. Fadaie S, Veiskarami M. Bearing Capacity Failure of Supported Cuts in the Presence of Seepage Flow by Coupled Finite Elements and Stress Characteristics Method. Int J Civ Eng (2020) 18:817–25. doi:10.1007/s40999-020-00495-7
7. Liu S, Wang W, Gong C, Li H. Numerical Simulation on Time-dependent Behavior and Long-Term Safety Analysis of Soft Rock Tunnel under Seepage Condition. IOP Conf Ser Earth Environ Sci (2020) 570:052027. doi:10.1088/1755-1315/570/5/052027
8. Ma Z, Wang Y, Ren N, Shi W. A Coupled CFD-DEM Simulation of Upward Seepage Flow in Coarse Sands. Mar Georesources Geotechnology (2019) 37:589–98. doi:10.1080/1064119X.2018.1466223
9. Sun Z, Tao Y, Cao Y, Wang Y. Numerical Simulation of Seepage Failure of sandy Soil between Piles Induced by an Underground Leaking Pipe. Arab J Sci Eng (2021) 46:10489–503. doi:10.1007/s13369-021-05354-8
10. Qian J-G, Li W-Y, Yin Z-Y, Yang Y. Influences of Buried Depth and Grain Size Distribution on Seepage Erosion in Granular Soils Around Tunnel by Coupled CFD-DEM Approach. Transportation Geotechnics (2021) 29:100574. doi:10.1016/j.trgeo.2021.100574
11. Zhang D-M, Gao C-P, Yin Z-Y. CFD-DEM Modeling of Seepage Erosion Around Shield Tunnels. Tunnelling Underground Space Techn (2019) 83:60–72. doi:10.1016/j.tust.2018.09.017
12. Yan C, Fan H, Huang D, Wang G. A 2D Mixed Fracture-Pore Seepage Model and Hydromechanical Coupling for Fractured Porous media. Acta Geotech. (2021) 16:3061–86. doi:10.1007/s11440-021-01183-z
13. Zhou Z, Li Z, Ranjith PG, Wen Z, Shi S, Wei C. Numerical Simulation of the Influence of Seepage Direction on Suffusion in Granular Soils. Arab J Geosci (2020) 13:13. doi:10.1007/s12517-020-05504-6
14. Yang Y, Chang X, Zhou W, Zhou C. Simulation of Hydraulic Fracturing of Fractured Rock Mass by PFC∼(2D). Journal of Sichuan University. Engineering Science Edition (2012). p. 78–85. doi:10.15961/j.jsuese.2012.05.003
15. Dippenaar MA, Van Rooy JL. On the Cubic Law and Variably Saturated Flow through Discrete Open Rough-Walled Discontinuities. Int J Rock Mech Mining Sci (2016) 89:200–11. doi:10.1016/j.ijrmms.2016.09.011
Keywords: seepage, underground cavern, discrete element, pipe domain, high water pressure
Citation: Shi C, Zhang W, Chen X and Wang L (2022) Seepage Deformation and Failure of Rock Mass Under High Water Pressure With a Discrete Element Method. Front. Phys. 10:857158. doi: 10.3389/fphy.2022.857158
Received: 18 January 2022; Accepted: 15 March 2022;
Published: 12 April 2022.
Edited by:
Wanqing Shen, Université de Lille, FranceReviewed by:
Jinfeng Zhang, Tianjin University, ChinaZhan Yu, Northeastern University, China
Chi Yao, Nanchang University, China
Copyright © 2022 Shi, Zhang, Chen and Wang. This is an open-access article distributed under the terms of the Creative Commons Attribution License (CC BY). The use, distribution or reproduction in other forums is permitted, provided the original author(s) and the copyright owner(s) are credited and that the original publication in this journal is cited, in accordance with accepted academic practice. No use, distribution or reproduction is permitted which does not comply with these terms.
*Correspondence: Wenhao Zhang, endoenl4d3c5OEAxNjMuY29t
 Chong Shi1,2,3
 Wenhao Zhang