- 1Department of Physics, Ben Gurion University of the Negev, Beersheba, Israel
- 2Department of Earth, Planetary, and Space Sciences, University of California, Los Angeles, CA, United States
- 3Swedish Institute of Space Physics, Uppsala, Sweden
The Mach number is one of the key parameters of collisionless shocks. Understanding shock physics requires knowledge of the spatial scales in the shock transition layer. The standard methods of determining the Mach number and the spatial scales require simultaneous measurements of the magnetic field and the particle density, velocity, and temperature. While magnetic field measurements are usually of high quality and resolution, particle measurements are often either unavailable or not properly adjusted to the plasma conditions. We show that theoretical arguments can be used to overcome the limitations of observations and determine the Mach number and spatial scales of the low-Mach number shock when only magnetic field data are available.
1 Introduction
Collisionless shocks [1] are one of the most ubiquitous phenomena in space plasmas. The unfading interest in collisionless shocks is related to the fact that they are the most efficient accelerators of charged particles in the known universe [2–14]. A shock is a discontinuity in terms of magnetohydrodynamics (MHD) [15], at which the flow velocity along the shock normal drops while the density increases. In reality, this discontinuity has a finite width, and the electric and magnetic fields vary continuously inside the transition from the upstream region of low density and entropy to the downstream region of higher density and entropy. A collisionless shock efficiently converts the energy of the directed flow into the thermal energy of charged particles, the energy of accelerated particles, and the field energy. The conversion occurs via the interaction between charged particles and the electric and magnetic fields of the shock. Thus, understanding the processes inside the shock requires, first and foremost, knowledge of the fields inside the transition layer together with their dependence on time and space. Observational determination of this is not an easy problem. Direct observational separation of spatial and temporal variations is not possible with single-spacecraft measurements. Multi-spacecraft measurements help (e.g., Russell et al. [16], Dunlop [17]) but to a limited extent. In addition, determination of the Mach number and the spatial scales requires sufficiently good particle measurements. At present, most spacecraft that study shocks are not designed to properly measure parameters of narrow cold beams [18–22]. Therefore, the solar wind is not resolved to the required precision. At the same time, the available magnetic field measurements are typically very good. It would be helpful if the Mach number and the spatial scales could be reasonably estimated using magnetic field data alone. It makes sense to first attempt to develop such a methodology for low-Mach number shocks, which are expected to be nearly stationary and planar and have moderately structured profiles [23–31]. There is no strict definition of what low-Mach numbers are. Typically, a shock with the Alfvénic Mach number M ≲ 4 may be expected to suit the above purposes. In contrast, in several theoretical works, dependences of several spatial scales on the Alfvénic Mach number have been derived, and certain tools have been proposed for application to the magnetic field data [32–38].
The Mercury bow shock is typically a low-Mach number shock and the 20 Hz MESSENGER magnetic field measurements are sufficiently good for the application of the proposed methods [39, 40]. This study demonstrates the efficiency and consistency of theoretical predictions by applying the proposed methods to selected shocks. The study is organized as follows: first, we summarize the theoretical estimates of the width of various shock features proposed so far (Section 2). Next, we briefly outline the numerical analysis used as an additional check (Section 3). After that, we analyze in detail two selected shock profiles.
2 Theoretical Basis for Estimates of the Shock Scales and Mach Number
Several theoretical estimates are available for planar stationary shocks when the ion reflection is weak. Note that these estimates allow determining the scales in terms of the ion inertial length but do not allow determining the latter in dimensional units (km). The analysis in the study is done in the normal incidence frame (NIF), that is, the shock frame in which the upstream plasma flow is along the shock normal.
2.1 Phase-Standing Whistler Precursor
In the shock with a coherent whistler precursor, the wavelength of the whistler wave train can be estimated if the precursor is assumed to be phase standing in the shock frame [29, 36, 41, 42]:
where Vu is the NIF upstream plasma velocity, θBn is the angle between the shock normal and the upstream magnetic field, M = Vu/VA is the Alfvénic Mach number,
2.2 Foot Length
Usually, the expression by Gosling and Thomsen [43] is used to estimate the foot length. This expression is derived for a specularly reflected ion entering the shock with the velocity of the flow. More detailed studies have shown that ion reflection is non-specular and the foot length is substantially smaller and can be estimated as
where M is the Alfvénic Mach number and Ωu = eBu/mpc is the upstream gyrofrequency [33, 38].
2.3 Downstream Magnetic Oscillations
Coherent magnetic oscillations arise due to the gyration of the ion distributions produced at the shock crossing [28, 44–46]. If the oscillations are periodic, the effect of the reflected ions is weak. For directly transmitted ions, the distance between two successive maxima can be estimated as [47]
where Vdrift is the component of the downstream flow velocity along the shock normal. In the quasi-perpendicular case, this drift velocity can be approximated as Vdrift ≈ Vu(Bu/Bd), which is sufficient for the estimate. The amplitude of the oscillations decreases due to the gyrophase mixing. The decay is faster for higher upstream ion temperatures [45]. If the effect of reflected ions is significant, other peaks/dips may exist between the main maxima/minima [48, 49]. In this case, Δ would correspond to the distance between a maximum and the next second maximum, or approximately the twice distance between two adjacent maxima.
2.4 Distance From the Overshoot Maximum to the Undershoot Minimum
This distance is more difficult to evaluate. As a rough approximation, it can be estimated as a gyroradius of the ion, which just crossed the ramp, in the downstream magnetic field. Within the narrow shock approximation [47, 50] the ion speed upon crossing the shock is
where ϕNIF is the cross-shock potential in the normal incidence frame. For the low upstream temperature, the ion velocity at the entry to the ramp is approximately equal to the flow speed. Therefore, a rough approximation for the distance from the overshoot maximum to the undershoot minimum would be
This estimate is less reliable than the others because the gyration occurs in the inhomogeneous magnetic field between the ramp and the undershoot. Note the use of the particle velocity and not the drift velocity because the analysis refers only to a part of the gyration.
2.5 Noncoplanar Magnetic Field
In laminar shocks or shocks with weak ion reflection, the noncoplanar magnetic field component inside the ramp is approximately [34, 35]
This approximation is not valid behind the ramp where the ion distributions begin to gyrate as a whole.
3 Basics of Numerical Analysis
Further check of the estimates will be done using the adjustable test particle analysis [51, 52]. We briefly describe the principles of the method. Model magnetic and electric fields are chosen, determined by a small number of parameters. The equations of motion for ions are solved numerically in these fields. A large number of ions from the initial upstream ion distribution are thus numerically traced across the shock front, which provides the ion distribution everywhere. The relevant moments of this distribution are determined numerically and used in the corresponding conservation law, pressure balance (see below). The pressure balance equation is used to derive the magnetic field, which would be consistent with the numerically found ion pressure. The derived magnetic field is compared with the chosen model field. The parameters of the chosen model are varied until a reasonable agreement is achieved. For a model low-Mach number shock, a reasonable model profile is given by the following expressions [45, 51]:
The parameters Rz = Bd,z/Bu,z and θBn are taken from observations. The shock ramp width D is one of the adjustable parameters. The electrostatic field along the shock normal is modeled using
whereas the noncoplanar component of the magnetic field is taken from Eq. 7. An incident Maxwellian distribution of ions is traced across the shock. The total ion pressure is numerically determined as a function of the coordinate x along the shock normal. The pressure is inserted in the pressure balance:
where pi,xx is the total ion pressure, which is the sum of the dynamic and kinetic pressure. The electron pressure pe is assumed adiabatic, pe ∝ nγ, γ = 5/3. We also assume βe = βi, where
4 A Low-Mach Number Subcritical Shock
Figure 1 shows the shock crossing at 2011/083/12:25:00 at two different scales. The top panel shows the very transition as the magnetic field within ±20 s around the crossing. The bottom panel shows the shock and the magnetic field around the shock, ± 180 s, around the crossing. Figure 2 shows the magnetic field components in MSO coordinates and the magnetic field magnitude. The red vertical lines mark the upstream region used to calculate the normal from the magnetic coplanarity, and the blue vertical lines mark the downstream region. The black vertical line marks the crossing time. The upstream magnetic field vector Bu is found by averaging the magnetic field vector over the chosen upstream region. The downstream magnetic field vector Bd is determined similarly. In the following, Bu = |Bu| and Bd = |Bd|.
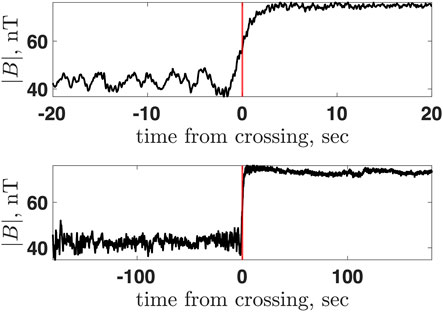
FIGURE 1. Magnetic field magnitude of a MESSENGER measured shock. Top: ± 20 s around the crossing. Bottom: ± 180 s around the crossing.
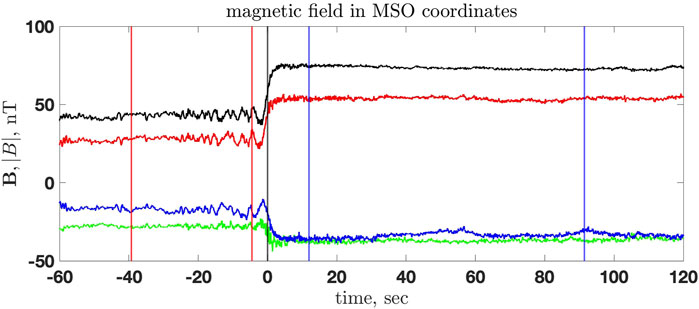
FIGURE 2. The magnetic field in MSO coordinates: Bx (green), By (red), Bz (blue), and |B| (black) for the shock crossing 2011/083/12:25:00. The red vertical lines mark the upstream region used to calculate the normal from magnetic coplanarity, and the blue vertical lines mark the downstream region. Time is measured in seconds from the shock crossing (marked by the black vertical line).
Figure 3 shows the normalized magnetic field rotated into the shock coordinates: x is along the shock normal and y is the noncoplanarity direction. The fields are normalized on the upstream magnetic field magnitude Bu. The rotation is made using the unit vectors:
The main magnetic field, Bz, has a clear monotonic ramp, a whistler precursor, and a barely noticeable overshoot: Bd/Bu = 1.7 and max |B|/Bu = 1.75. There is no visible foot. The region between the blue and the red vertical lines in the Figure 3 is the whistler precursor. The region between the red and the green vertical lines is the ramp. The black vertical line passes through the maximum of the overshoot. Judging by the above-described features of the profile, the shock should be a low-Mach number subcritical shock with no or negligible ion reflection. The noncoplanar magnetic field exhibits fluctuations at the spatial scale of the ramp and the whistler precursor. The normal component fluctuates inside the ramp. The spatial scales of these fluctuations are substantially smaller than the ramp width. We tend to interpret these deviations from planarity as a small-scale rippling inside the ramp, which propagates along the shock surface. The normal component of the magnetic field does not have fluctuations at the whistler spatial scale outside the ramp, which makes us conclude that the whistler propagates or phase stands along the normal. The angle between the shock normal and the upstream magnetic field is θBn = 67° and cos θBn = 0.39. Moderate changes of the upstream and downstream intervals did not affect the normal determination noticeably.
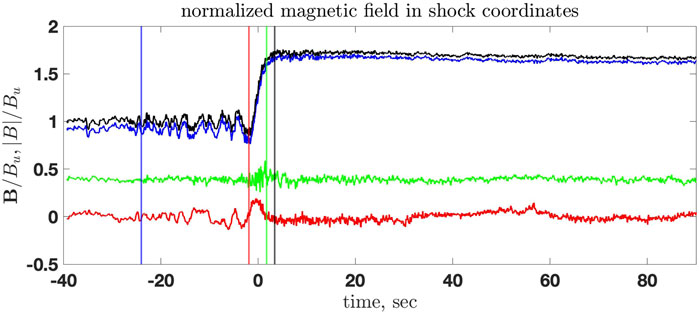
FIGURE 3. The normalized magnetic field rotated into the shock coordinates: x is along the shock normal, and y is the noncoplanarity direction. Colors are as in Figure 2. The region between the blue and the red vertical lines is the whistler precursor. The region between the red and the green vertical lines is the ramp. The black vertical line passes through the maximum of the overshoot.
Figure 4 is a close-up of Figure 3 but plotted using points to show explicitly the resolution of the magnetic field measurements. The horizontal black line marks B = 0. The magnetic field increase in the ramp is nearly linear, and the noncoplanar magnetic field has a rather broad maximum. The behavior is consistent with the relation (7).
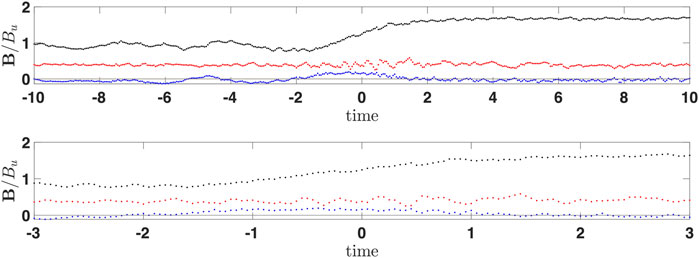
FIGURE 4. Close-up of Figure 3.
The magnetic field is measured as a function of time in the spacecraft frame. Accordingly, in the following, all scales are given as temporal equivalents of the corresponding spatial scales. Proper conversion of temporal durations into spatial lengths should be done by multiplying by the unknown shock speed Vsh in the spacecraft frame. This speed cannot be determined in dimensional units (km/s) without density measurements. Inspection of Figure 3 has shown that the time separation of the two successive maxima of the whistler precursor is ΔtW = 3.19 s, which gives the spatial-to-temporal correspondence λ = 2πLW = VshΔtW (see (2)), or lW = VshΔtW/2π = Vsh ⋅ 0.5 s. Using the estimate based on the noncoplanar magnetic field from Eq. 7 and d/dt = Vsh (d/dx), one gets lW = Vsh ⋅ 0.6 s. The agreement is quite good. The ramp duration is Δtr = 2.4 s so that the ramp width is D = VshΔtr = Vsh ⋅ 2.4 s and
Assuming D ≈ c/ωpi [27], we get an estimate of the Alfvénic Mach number: MA ≈ 1.6.
The shock is laminar, indicating low β [23, 25, 26]. Figure 5 shows the results of the adjustable test particle analysis. The shock angle was taken from the above determination using magnetic coplanarity, and the ramp width was taken as one ion inertial length. In contrast, the Mach number M, the cross-shock potential s, and the ion βi were varied. The best convergence to the downstream magnetic field was found for M = 1.65, βi = 0.1, and s = 0.63. The overshoot in the derived profile is also in agreement with the observations.
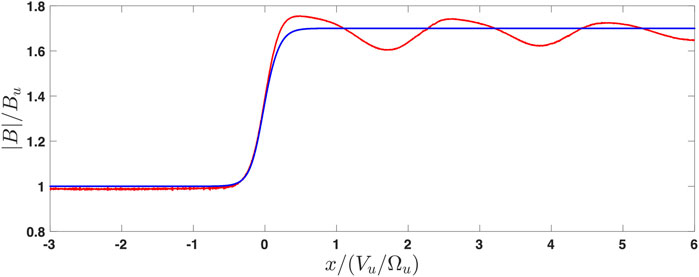
FIGURE 5. Profile adjusted using test particle analysis with M = 1.65, βi = 0.1, and s = 0.63. The initial profile is shown by the blue line. The red line is the magnetic field derived from the pressure balance.
5 A Low-Mach Number Supercritical Shock
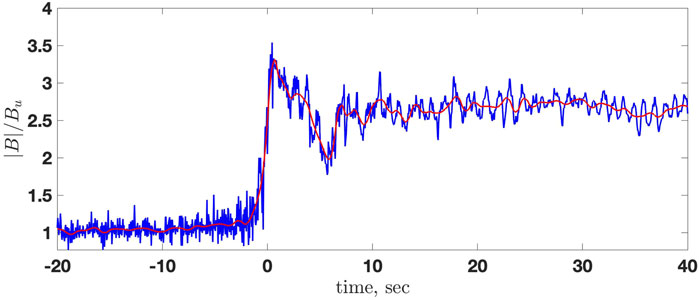
Figure 6 shows the shock crossing at 2013/047/06:57:00 in a format similar to Figure 1. Figure 7 shows the magnetic field components in MSO coordinates, as well as the magnetic field magnitude, the shock crossing moment, and the upstream and downstream regions used in the analysis. The format is similar to that of Figure 2. Figure 8 shows the normalized magnetic field rotated into the shock coordinates, similar to Figure 3. This shock has a clear overshoot and a noticeable foot, which means that this shock is expected to be a moderately supercritical shock. The downstream-to-upstream main magnetic field ratio is Rd = Bd/Bu = 2.66 and max |B|/Bu = 3.54. The angle between the shock normal and the upstream magnetic field is θBn ≈ 63° and cos θBn ≈ 0.45. Moderate changes of the upstream and downstream intervals did not affect the normal determination noticeably. High-frequency turbulence is present. We remove it using the wavelet denoising as follows: 1) 211 points of data are taken around the crossing time to cover sufficiently the upstream and downstream regions, 2) the Daubechies-10 wavelet transform is applied, 3) five smallest scales are removed, and 4) the inverse wavelet transform is performed. The procedure is done for Bx, By, Bz and separately for |B| because, otherwise, the foot region is smeared out. Figure 9 shows the magnetic field magnitude with the high-frequency noise removed. The maximum magnetic field is now Rm = |Bdn, max|/Bu = 3.3. We shall adopt this value as the maximum overshoot magnetic field.
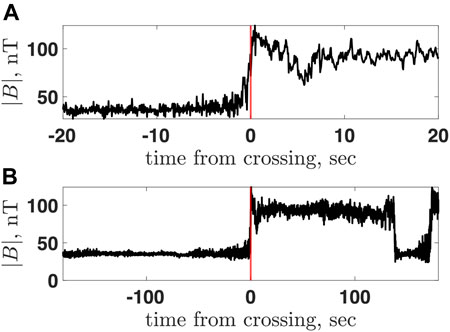
FIGURE 6. Magnetic field magnitude of a MESSENGER measured shock. (A): ± 20 s around the crossing. (B): ± 180 s around the crossing.
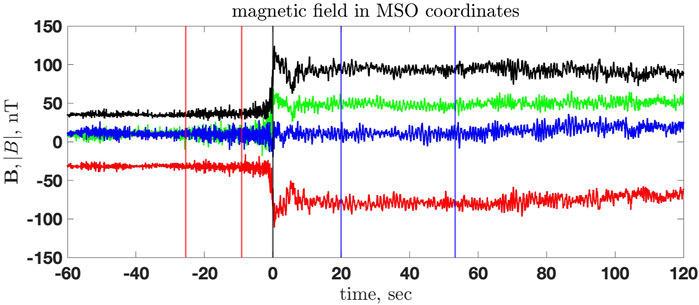
FIGURE 7. The magnetic field in MSO coordinates: Bx (green), By (red), Bz (blue), and |B| (black), for the shock crossing 2013/047/06:57:00. The red vertical lines mark the upstream region used to calculate the normal from magnetic coplanarity, and the blue vertical lines mark the downstream region. Time is measured in seconds from the shock crossing (marked by the black vertical line).
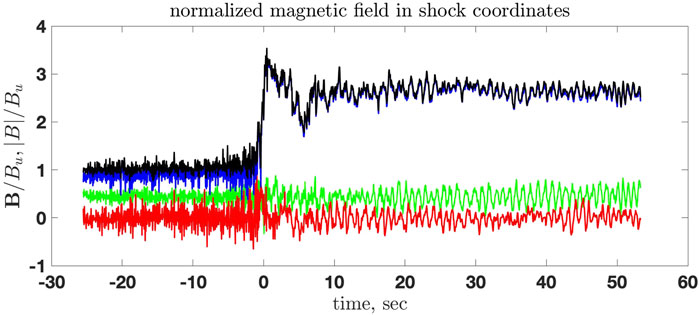
FIGURE 8. The normalized magnetic field rotated into the shock coordinates: x is along the shock normal, y is the noncoplanarity direction. Colors as in Figure 7.
Figure 10 shows some meaningful points marked at the magnetic field profile. Among these, the most important for us will be the beginning of the foot at t1 = − 10 s, the end of the foot and the beginning of the ramp at t2 = − 1.9 s, with the elevation of the magnetic field of ΔBfoot/Bu = 0.1, and the overshoot maximum at t3 = 0.7 s, with the additional elevation of the magnetic field of ΔBro/Bu = 2.2. The minimum of the undershoot occurs at t5 = 5.8 s, and the magnetic field there drops to B5/Bu = 2, well below the downstream value. The width of the foot is estimated as Lfoot ≈ 0.5M(c/ωpi) = Vsh ⋅ 8.1 s, where M is the Alfvénic Mach number [33]. Figure 11 shows all three components of the magnetic field with high-frequency noise removed. The normal component Bx (red line) remains reasonably constant with only small variations inside the ramp. The noncoplanar component has the maximum value of By/Bu ≈ 0.4 inside the ramp where the slope is the steepest,
Note that this relation is not valid behind the ramp because of the strong non-gyrotropy of the ion distribution [32]. Together with the estimate of Lfoot, we get the estimate of the Mach number
Another estimate of the Mach number can be obtained from [50]
where
The distance between the maximum of the overshoot and the minimum of the undershoot is 5 s. A rough estimate of this distance is
which is not bad at all. Consistence of all these estimates encourages to conclude that the chosen s = 0.5 is not far from reality.
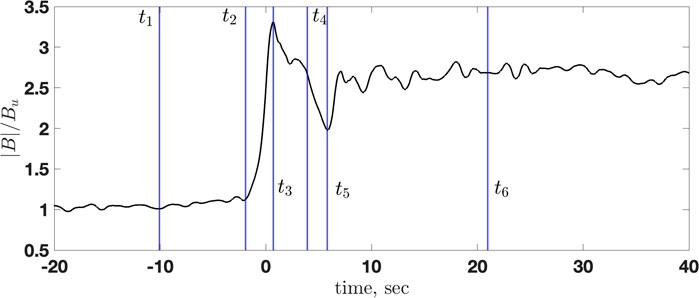
FIGURE 10. The denoised B and the meaningful points, from left to right: the beginning of the foot (t1), the end of the foot and the beginning of the ramp (t2), the overshoot maximum (t3), the point where the magnetic field decreases to the value nearly equal to the downstream magnetic field magnitude (t4), the minimum of the undershoot (t5), the point where the mean magnetic field essentially levels off (t6).
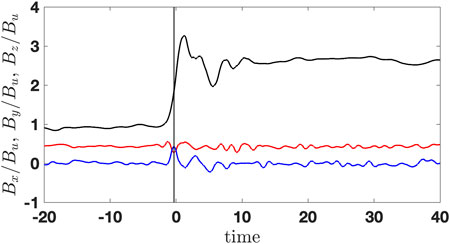
FIGURE 11. Three components of the denoised magnetic field: Bx (red), By (blue), and Bz (black). The maximum of By lies inside the ramp at the point with the steepest slope.
The absence of downstream magnetic oscillations, that is, only one overshoot and undershoot, indicates high β [45]. Figure 12 shows the results of the adjustable test particle analysis. The best convergence to the downstream magnetic field was found for M = 4, βi = 0.75, and s = 0.5. The overshoot in the derived profile is also in agreement with the observations. The position of the undershoot is close to the predicted. However, the magnetic field in the undershoot of the derived profile is somewhat higher than the observed one probably because the overshoot modifies the ion motion. The initial profile used for adjustment was a simple tanh-like profile. A better agreement could potentially be achieved by using a more sophisticated model with an overshoot and undershoot. We leave this issue for further studies.
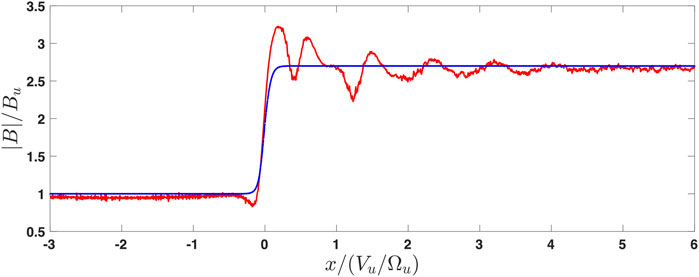
FIGURE 12. Profile adjusted using test particle analysis with M = 4, βi = 0.75, and s = 0.5. The initial profile is shown by the blue line. The red line is the magnetic field derived from the pressure balance.
6 Verification With Magnetospheric Multiscale
There were no particle data for the analyzed MESSENGER shocks. The above analysis has been done using magnetic field measurements alone. It is desirable to verify this analysis with shocks for which the Mach number and the scales could be determined by the above methods and, independently, by the conventional methods involving additional measurements. For this task, an MMS1 shock was selected with sufficient magnetic features to apply the above approach. Two independent analyses have been performed: one applied the theoretical estimates to the magnetic profile without utilizing any other information and the other was done in the standard way. We present the comparison below. The shock crossing occurred at 2020-11-12 14:36:04. Figure 13 shows a part of the shock, |B|/Bu, in GSE coordinates, with the time set to zero at the shock crossing. The black line shows the normalized magnetic field magnitude. The sampling rate is 16 measurements per second. The upstream magnetic field is determined by averaging over about 20 first seconds of the Figure 13. The downstream magnetic field is determined by averaging over about 50 last seconds of the figure. The shock normal is determined using magnetic coplanarity. The found shock normal is
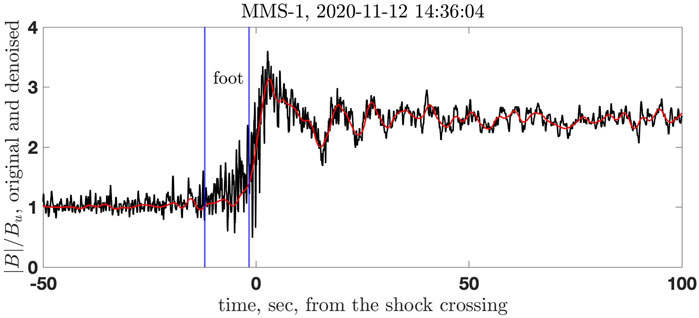
FIGURE 13. The MMS shock used for verification. The black line shows the normalized magnetic field magnitude. The red line shows the denoised magnetic field. The vertical blue lines show the beginning and the end of the foot. See details in the text.
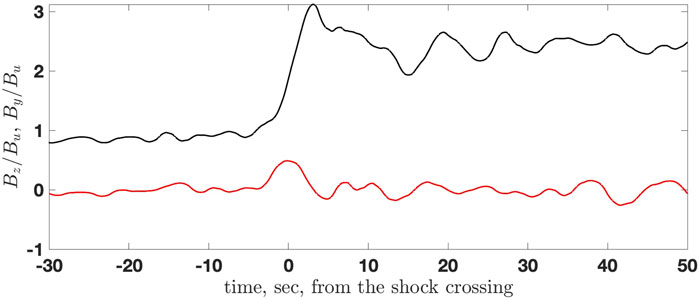
FIGURE 14. The noncoplanar magnetic field By (red) and the main magnetic field component Bz (black).
The shock was independently analyzed using the MMS magnetic field and particle (density and velocity) measurements. The upstream and downstream magnetic field vectors in GSE coordinates are Bu = (1.48, − 6.53, 4.52) nT and Bd = (7.93, − 12.94, 12.4) nT, respectively. The upstream and downstream velocity vectors in the spacecraft frame and GSE coordinates are V1 = ( − 376, 33, − 19) km/s and V2 = ( − 264, 133, − 18) km/s, respectively. The upstream and downstream number densities, measured by MMS, are Nu = 8.11 cm−3 and Nd = 23.12 cm−3, respectively. The model shock normal [53]
Note that the model shock normal and the normal found earlier from coplanarity are quite similar. In order to avoid confusion, velocities V1 and V2 are the bulk plasma velocities relative to the spacecraft in the upstream and downstream regions, respectively. Value Vu is the NIF upstream plasma speed. The Mach number is M = Vu/VA, where
7 Discussion and Conclusion
In this study, we applied existing theoretical estimates to the magnetic field measurements to determine the Aflvénic Mach number and the scale parameters of two low-Mach number shocks. One of these shocks has a very low overshoot and a clear whistler precursor. Another one possesses a substantial overshoot and a foot. In both cases, we estimated the Mach number using at least two independent theoretical approaches and found good agreement between the various methods. In addition, this allowed us to determine the correspondence of the duration of the measurement of a particular feature to its physical spatial scale in terms of the upstream convective gyroradius and/or ion inertial length. As always, the determination of the shock parameters requires making some assumptions, such as stationarity and planarity. Although the methods were applied to rather clean shocks with classical profiles at this stage, they will possibly allow extension to less favorable cases, in part by comparison with the success of the present study. The method has been tested with an MMS observed shock, for which sufficiently good particle measurements are also available. The Mach number obtained with the magnetic measurements and theory and the Mach number obtained with both magnetic field and particle measurements differ by less than 10%, which is encouraging.
Data Availability Statement
Publicly available datasets were analyzed in this study. These data can be found at: https://pds-ppi.igpp.ucla.edu/mission/MESSENGER/MESS/MAG https://lasp.colorado.edu/mms/sdc/public/
Author Contributions
MG, EG, CR, and AD participated in the analysis and paper writing.
Funding
This research was partially supported by the European Union’s Horizon 2020 Research and Innovation Programme under Grant Agreement no. 101004131. APD received financial support from the Swedish National Space Agency (Grant #2020-00111).
Conflict of Interest
The authors declare that the research was conducted in the absence of any commercial or financial relationships that could be construed as a potential conflict of interest.
Publisher’s Note
All claims expressed in this article are solely those of the authors and do not necessarily represent those of their affiliated organizations or those of the publisher, the editors, and the reviewers. Any product that may be evaluated in this article, or claim that may be made by its manufacturer, is not guaranteed or endorsed by the publisher.
Acknowledgments
WaveLab 850 package for wavelet analysis (https://statweb.stanford.edu/\∼wavelab/Wavelab_850/index_wavelab850.html) was used in the study.
References
1. Sagdeev RZ. Cooperative Phenomena and Shock Waves in Collisionless Plasmas. Rev Plasma Phys (1966) 4:23.
2. Jokipii JR. A Model of Fermi Acceleration at Shock Fronts with an Application to the Earth's Bow Shock. ApJ (1966) 143:961. doi:10.1086/148571
3. Axford WI, Leer E, Skadron G. The Acceleration of Cosmic Rays by Shock Waves. A79-44583 19-93. In: 15th International Cosmic Ray Conference; August 13-26, 1977; Plovdiv, Bulgaria. B’lgarska Akademiia na Naukite (1977). p. 132–7.
4. Krymskii GF. A Regular Mechanism for the Acceleration of Charged Particles on the Front of a Shock Wave. Soviet Phys Doklady (1977) 22:327.
5. Vasilev VN, Toptygin IN, Chirkov AG. Interaction between Energetic Particles and a Shock Front in a Turbulent Medium. Geomagnet Aeronomy (1978) 18:415–22.
6. Bell AR. The Acceleration of Cosmic Rays in Shock Fronts - I. Monthly Notices R Astronom Soc (1978) 182:147–56. doi:10.1093/mnras/182.2.147
7. Blandford RD, Ostriker JP. Particle Acceleration by Astrophysical Shocks. ApJ (1978) 221:L29–L32. doi:10.1086/182658
8. Toptyghin IN. Acceleration of Particles by Shocks in a Cosmic Plasma. Space Sci Rev (1980) 26:157–213. doi:10.1007/bf00167370
9. Jokipii JR. Particle Drift, Diffusion, and Acceleration at Shocks. ApJ (1982) 255:716–20. doi:10.1086/159870
10. Drury LOC. An Introduction to the Theory of Diffusive Shock Acceleration of Energetic Particles in Tenuous Plasmas. Rep Prog Phys (1983) 46:973–1027. doi:10.1088/0034-4885/46/8/002
11. Blandford R, Eichler D. Particle Acceleration at Astrophysical Shocks: A Theory of Cosmic ray Origin. Phys Rep (1987) 154:1–75. doi:10.1016/0370-1573(87)90134-7
12. Giacalone J. The Physics of Particle Acceleration by Collisionless Shocks. Planet Space Sci (2003) 51:659–64. doi:10.1016/S0032-0633(03)00101-6
13. Vink J. Shocks and Particle Acceleration in Supernova Remnants: Observational Features. Adv Space Res (2004) 33:356–65. doi:10.1016/j.asr.2003.05.012
14. Lee MA, Mewaldt RA, Giacalone J. Shock Acceleration of Ions in the Heliosphere. Space Sci Rev (2012) 173:247–81. doi:10.1007/s11214-012-9932-y
15. de Hoffmann F, Teller E. Magneto-Hydrodynamic Shocks. Phys Rev (1950) 80:692–703. doi:10.1103/PhysRev.80.692
16. Russell CT, Mellott MM, Smith EJ, King JH. Multiple Spacecraft Observations of Interplanetary Shocks: Four Spacecraft Determination of Shock Normals. J Geophys Res (1983) 88:4739–48. doi:10.1029/JA088iA06p04739
17. Dunlop MW. Four-point Cluster Application of Magnetic Field Analysis Tools: The Curlometer. J Geophys Res (2002) 107:14. doi:10.1029/2001JA005088
18. Rème H, Bosqued JM, Sauvaud JA, Cros A, Dandouras J, Aoustin C, et al. The Cluster Ion Spectrometry (Cis) Experiment. Space Sci Rev (1997) 79:303–50. doi:10.1023/A:100492981640910.1007/978-94-011-5666-0_12
19. McFadden JP, Carlson CW, Larson D, Ludlam M, Abiad R, Elliott B, et al. The THEMIS ESA Plasma Instrument and In-Flight Calibration. Space Sci Rev (2008) 141:277–302. doi:10.1007/s11214-008-9440-2
20. McFadden JP, Carlson CW, Larson D, Bonnell J, Mozer F, Angelopoulos V, et al. THEMIS ESA First Science Results and Performance Issues. Space Sci Rev (2008) 141:477–508. doi:10.1007/s11214-008-9433-1
21. Angelopoulos V. The THEMIS Mission. Space Sci Rev (2008) 141:5–34. doi:10.1007/s11214-008-9336-1
22. Pollock C, Moore T, Jacques A, Burch J, Gliese U, Omoto T, et al. Fast Plasma Investigation for Magnetospheric Multiscale. Sp Sci Rev (2016) 199:331. doi:10.1007/s11214-016-0245-4
23. Greenstadt EW, Russell CT, Scarf FL, Formisano V, Neugebauer M. Structure of the Quasi-Perpendicular Laminar bow Shock. J Geophys Res (1975) 80:502–14. doi:10.1029/JA080i004p00502
24. Greenstadt EW, Scarf FL, Russell CT, Gosling JT, Bame SJ, Paschmann G, et al. A Macroscopic Profile of the Typical Quasi-Perpendicular bow Shock - Isee 1 and 2. J Geophys Res (1980) 85:2124–30.
25. Russell CT, Hoppe MM, Livesey WA, Gosling JT, Bame SJ. ISEE-1 and -2 Observations of Laminar bow Shocks: Velocity and Thickness. Geophys Res Lett (1982) 9:1171–4. doi:10.1029/gl009i010p01171
26. Mellott MM, Greenstadt EW. The Structure of Oblique Subcritical bow Shocks: ISEE 1 and 2 Observations. J Geophys Res (1984) 89:2151–61. doi:10.1029/JA089iA04p02151
27. Farris MH, Russell CT, Thomsen MF. Magnetic Structure of the Low Beta, Quasi-Perpendicular Shock. J Geophys Res (1993) 98:15285–94. doi:10.1029/93ja00958
28. Balikhin MA, Zhang TL, Gedalin M, Ganushkina NY, Pope SA. Venus Express Observes a New Type of Shock with Pure Kinematic Relaxation. Geophys Res Lett (2008) 35:L01103. doi:10.1029/2007GL032495
29. Wilson III LB, Koval A, Szabo A, Stevens ML, Kasper JC, Cattell CA, et al. Revisiting the Structure of Low-Mach Number, Low-Beta, Quasi-Perpendicular Shocks. J Geophys Res Space Phys (2017) 122:9115–33. doi:10.1002/2017JA024352
30. Pope SA, Gedalin M, Balikhin MA. The First Direct Observational Confirmation of Kinematic Collisionless Relaxation in Very Low Mach Number Shocks Near the Earth. J Geophys Res Space Phys (2019) 124:1711–25. doi:10.1029/2018JA026223
31. Pope SA. A Survey of Venus Shock Crossings Dominated by Kinematic Relaxation. J Geophys Res Space Phys (2020) 125:A028256. doi:10.1029/2020JA028256
32. Gedalin M, Zilbersher D. Non-diagonal Ion Pressure in Nearly-Perpendicular Collisionless Shocks. Geophys Res Lett (1995) 22:3279–82. doi:10.1029/95GL03284
33. Gedalin M. Ion Reflection at the Shock Front Revisited. J Geophys Res (1996) 101:4871–8. doi:10.1029/95JA03669
34. Gedalin M. Noncoplanar Magnetic Field in the Collisionless Shock Front. J Geophys Res (1996) 101:11153–6. doi:10.1029/96JA00518
35. Newbury JA, Russell CT, Gedalin M. The Determination of Shock Ramp Width Using the Noncoplanar Magnetic Field Component. Geophys Res Lett (1997) 24:1975–8. doi:10.1029/97GL01977
36. Gedalin M. Low-frequency Nonlinear Stationary Waves and Fast Shocks: Hydrodynamical Description. Phys Plasmas (1998) 5:127–32. doi:10.1063/1.872681
37. Gedalin M, Newbury JA, Russell CT. Shock Profile Analysis Using Wavelet Transform. J Geophys Res (1998) 103:6503–11. doi:10.1029/97JA03593
38. Balikhin M, Gedalin M. Collisionless Shocks in the Heliosphere: Foot Width Revisited. ApJ (2022) 925:90. doi:10.3847/1538-4357/ac3bb3
39. Anderson BJ, Acuña MH, Lohr DA, Scheifele J, Raval A, Korth H, et al. The Magnetometer Instrument on MESSENGER. Space Sci Rev (2007) 131:417–50. doi:10.1007/s11214-007-9246-7
40. Winslow RM, Anderson BJ, Johnson CL, Slavin JA, Korth H, Purucker ME, et al. Mercury's Magnetopause and bow Shock from MESSENGER Magnetometer Observations. J Geophys Res Space Phys (2013) 118:2213–27. doi:10.1002/jgra.50237
41. Bale SD, Balikhin MA, Horbury TS, Krasnoselskikh VV, Kucharek H, Möbius E, et al. Quasi-perpendicular Shock Structure and Processes. Space Sci Rev (2005) 118:161–203. doi:10.1007/s11214-005-3827-0
42. Krasnoselskikh V, Balikhin M, Walker SN, Schwartz S, Sundkvist D, Lobzin V, et al. The Dynamic Quasiperpendicular Shock: Cluster Discoveries. Space Sci Rev (2013) 178:535–98. doi:10.1007/s11214-013-9972-y
43. Gosling JT, Thomsen MF. Specularly Reflected Ions, Shock Foot Thicknesses, and Shock Velocity Determinations in Space. J Geophys Res (1985) 90:9893–6. doi:10.1029/JA090iA10p09893
44. Gedalin M, Friedman Y, Balikhin M. Collisionless Relaxation of Downstream Ion Distributions in Low-Mach Number Shocks. Phys Plasmas (2015) 22:072301. doi:10.1063/1.4926452
45. Gedalin M. Collisionless Relaxation of Non-gyrotropic Downstream Ion Distributions: Dependence on Shock Parameters. J Plasma Phys (2015) 81:905810603. doi:10.1017/S0022377815001154
46. Gedalin M. Kinematic Collisionless Relaxation of Ions in Supercritical Shocks. Front Phys (2019) 7:692. doi:10.3389/fphy.2019.00114
47. Gedalin M. Ion Heating in Oblique Low-Mach Number Shocks. Geophys Res Lett (1997) 24:2511–4. doi:10.1029/97GL02524
48. Ofman L, Gedalin M. Two-dimensional Hybrid Simulations of Quasi-Perpendicular Collisionless Shock Dynamics: Gyrating Downstream Ion Distributions. J Geophys Res Space Phys (2013) 118:1828–36. doi:10.1029/2012JA018188
49. Gedalin M. How Non-stationary Are Moderately Supercritical Shocks? J Plasma Phys (2019) 85:905850505. doi:10.1017/s0022377819000692
50. Gedalin M. Shock Heating of Directly Transmitted Ions. ApJ (2021) 912:82. doi:10.3847/1538-4357/abf1e2
51. Gedalin M. Transmitted, Reflected, Quasi-Reflected, and Multiply Reflected Ions in Low-Mach Number Shocks. J Geophys Res Space Phys (2016) 121:754–10. doi:10.1002/2016JA023395
52. Gedalin M, Pogorelov NV, Roytershteyn V. Boundary Conditions at the Heliospheric Termination Shock with Pickup Ions. ApJ (2021) 916:57. doi:10.3847/1538-4357/ac05b7
53. Farris MH, Russell CT. Determining the Standoff Distance of the bow Shock: Mach Number Dependence and Use of Models. J Geophys Res (1994) 99:17681. doi:10.1029/94JA01020
Keywords: collisionless shocks, magnetic field, planetary shocks, heliosphere, bow shock
Citation: Gedalin M, Golbraikh E, Russell CT and Dimmock AP (2022) Theory Helps Observations: Determination of the Shock Mach Number and Scales From Magnetic Measurements. Front. Phys. 10:852720. doi: 10.3389/fphy.2022.852720
Received: 11 January 2022; Accepted: 14 February 2022;
Published: 15 March 2022.
Edited by:
Christopher H. K. Chen, Queen Mary University of London, United KingdomReviewed by:
Rami Vainio, University of Turku, FinlandParisa Mostafavi, Johns Hopkins University, United States
Copyright © 2022 Gedalin, Golbraikh, Russell and Dimmock. This is an open-access article distributed under the terms of the Creative Commons Attribution License (CC BY). The use, distribution or reproduction in other forums is permitted, provided the original author(s) and the copyright owner(s) are credited and that the original publication in this journal is cited, in accordance with accepted academic practice. No use, distribution or reproduction is permitted which does not comply with these terms.
*Correspondence: Michael Gedalin, Z2VkYWxpbkBiZ3UuYWMuaWw=
 Michael Gedalin
 Ephim Golbraikh
 Christopher T. Russell2
 Andrew P. Dimmock