
94% of researchers rate our articles as excellent or good
Learn more about the work of our research integrity team to safeguard the quality of each article we publish.
Find out more
ORIGINAL RESEARCH article
Front. Phys., 17 March 2022
Sec. Chemical Physics and Physical Chemistry
Volume 10 - 2022 | https://doi.org/10.3389/fphy.2022.851279
 Oriele Palumbo1*
 Angelo Sarra1Jean-Blaise Brubach2
 Francesco Trequattrini1,3Adriano Cimini1Sergio Brutti1,4Giovanni Battista Appetecchi5
 Elisabetta Simonetti5
 Giovanna Maresca5
 Sébastien Fantini6Rongying Lin6Anaïs Falgayrat6Pascale Roy2
 Annalisa Paolone1
Two ethoxy containing ionic liquids (ILs) sharing the same anion, N-trimethyl-N (2-methoxyethyl)ammonium bis(trifluoromethanesulfonyl)imide (N111(2O1)-TFSI) and N,N-diethyl-N-methyl-N (2-methoxyethyl)ammonium bis(trifluoromethanesulfonyl)imide (N122(2O1)-TFSI), and their mixtures are studied by means of differential scanning calorimetry and infrared spectroscopy combined with DFT calculations. The two ILs, slightly differing only for the length of two short chains, diverge significantly in the thermal properties: N111(2O1)-TFSI undergoes to a crystallization upon cooling, whereas N122(2O1)-TFSI is likely to become a glass. Experimental results indicate that in N111(2O1)-TFSI the occurrence of hydrogen bonding is energetically favored, and become particularly evident in the solid phase. The comparison with computational results indicates that it could be ascribed to the CH bonds involving the C atoms directly linked to the central N atom. In N122(2O1)-TFSI, DFT calculations suggest that hydrogen bonding could take place; however, IR measurements suggest that hydrogen bonding is not energetically favored. Moreover, in N122(2O1)-TFSI there is a larger conformational disorder that prevents from the alignment of cation and anion that contributes to the detection of clear hydrogen bonding infrared active bands. The mixtures rich in N111(2O1)-TFSI crystallize at lower temperatures than the pure ionic liquid. Progressively, the energy gain due to the instauration of hydrogen bonding decreases as the concentration of N122(2O1)-TFSI increases.
Ionic liquids (ILs) are attracting large interest due to the specific properties they possess: low volatility, low flammability, large liquid temperature ranges and high thermal and electrochemical stability [1]. Moreover, a proper matching between anion and cation allows tailoring the required physical-chemical properties. The large number of available anions and cations as well as the facile solubility with other ILs or organic solvents to form homogeneous solutions further widens the possible applications [1].
In the last years, the chemical modification of the cations has also emerged as an effective method to modify the properties of ILs [2]. Indeed, most cations contain alkyl chain, whose length strongly modify the melting point of the resulting ILs, which in general decreases with longer alkyl chains [1]. Moreover, other functional groups can be bonded to the alkyl chain, like hydroxyl and ethoxy groups. Ethoxy functionalization of alkyl chains apparently tunes the functional properties of the IL in many different application fields: antimicrobial activity [3, 4], extraction of pesticides and fruit metabolites in the field of food manufacture [5], synthesis of foaming–defoaming materials [6], inhibition of some enzymes [7], recovery and separation of rare earth elements from aqueous solutions [8] or to mitigate the corrosion of carbon and mild steel in acidic media [9, 10].
It must be pointed out that the possible applications in which the ethoxy functionalization obtained more success involve various aspects of electrochemistry [11–26]. Ionic liquids in general are valuable solvents for electrolytes in electrochemical devices. Their extremely low volatility and flammability, compared to those of the organic solvents commonly used in lithium batteries or dye-sensitized solar cells, allows to envision their use in electrolytes for different electrochemical applications [27]. Moreover, they may be used as plasticizer and ion conducting media in polymeric electrolytes with interesting conduction properties [12–26]. Some studies were devoted to the investigation of basic physical properties of ethoxy substituted ILs, such as the investigation of the effect of applied pressures or the interaction between anion and cation [28–32]. One of the most important effects of the introduction of an ethoxy group in the alkyl chains of the cations of the ILs is the suppression of the crystallization at low temperature compared to the aliphatic analogues [21, 25, 26]. As a consequence, the exploitable temperature range for electrochemical applications widens up [21, 25, 26].
We recently investigated [33, 34] the physical and electrochemical properties of two ethoxy containing ILs, having the same anion and similar cations, differing only for the length of two side short alkyl chains N-trimethyl-N (2-methoxyethyl)ammonium bis(trifluoromethanesulfonyl)imide (N111(2O1)-TFSI) and N,N-diethyl-N-methyl-N (2-methoxyethyl)ammonium bis(trifluoromethanesulfonyl)imide (N122(2O1)-TFSI) (see Figure 1) [33, 34]. These two ILs have a similar decomposition temperature and vapor pressure [34] and close values of the ionic conductivity at 50°C [33]. However, despite the similarities between the two ILs, they show a completely different behavior as a function of temperature: while N122(2O1)-TFSI transforms into a glassy state at low temperatures, N111(2O1)-TFSI has a crystalline-liquid phase transition around 310 K, as shown by conductivity measurements [33]. In this work we investigate the origins of similarities and differences between N111(2O1)-TFSI and N122(2O1)-TFSI at molecular level by means of infrared spectroscopy measurements as a function of temperature coupled with computational modeling. To shed more light on the impact of the various molecular structures on the macroscopic properties of the liquids/solids we extended the experimental study also to some mixtures of the two ionic liquids.
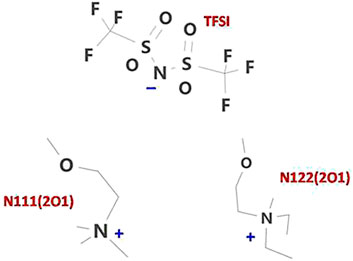
FIGURE 1. Schematic view of the TFSI anion and of the two N111(2O1) and N122(2O1) cations composing the investigated ILs.
We particularly focus on the formation of hydrogen bonds at various temperatures. Generally speaking hydrogen bonds are particularly strong in protic ionic liquids, but they have been recently observed also in aprotic ILs. While in protic ILs the involved bonds are NH … O, in aprotic ILs the hydrogen bonds in most cases originates in the weaker CH … O interactions. In ILs there are many competing forces, due to the complexity of the systems; in particular hydrogen bonds energetically compete with dispersion forces originating mainly among the tails of the cations. Hydrogen bond formation typically drives the assembling of molecules into crystalline solids, due its directionality that facilitates the growth of well-ordered 3D periodic arrangements [35].
Infrared spectroscopy, eventually supported by DFT calculations, was proved to provide useful information about the interactions between anion and cation in ILs and the possible occurrence of conformational disorder [32, 36–44]. Indeed, all the properties of ILs are the consequence of competitive microscopic interaction forces, therefore the knowledge of the microscopic properties and of the intermolecular forces is fundamental to tackle the prediction skills required for the design of ILs with specific macroscopic properties. With this aim, we also investigated the possibility of exploiting the different properties of the two liquids by mixing them to achieve a tailored system. A set of mixtures obtained by mixing in a different amount the two ILs has also been characterized by both DSC and IR spectroscopy. These investigations show that the two starting ILs present significantly different thermal behavior as well as intermolecular interactions, which are likely linked to different microscopic behavior, while the mixtures retain the properties of the main component.
The ILs N-trimethyl-N (2-methoxyethyl)ammonium bis(trifluoromethanesulfonyl)imide (N111(2O1)-TFSI) and N,N-diethyl-N-methyl-N (2-methoxyethyl)ammonium bis(trifluoromethanesulfonyl)imide (N122(2O1)-TFSI) were synthesized at Solvionic, with a purity higher than 99.9% and a water content lower than 5 ppm, as measured (at 20°C) using an automatic Karl Fischer coulometric titrator (Mettler Toledo DL32).
The four mixed samples were obtained by mixing the two starting ILs (N111(2O1)-TFSI and N122(2O1)-TFSI) at different moles ratios, where x is the molar ratio of N111(2O1))-TFSI IL overN122(2O1)-TFSI present in the mixed sample. In the following, they are labeled as S 18.9 (where the molar ratio of N111(2O1)-TFSI over N122(2O1)-TFSI is 18.9), S 9.1 (where the molar ratio of N111(2O1)-TFSI over N122(2O1)-TFSI is 9.1), S4 (where the molar ratio of N111(2O1)-TFSI over N122(2O1)-TFSI is 4) and S1 (where the molar ratio of N111(2O1)-TFSI over N122(2O1)-TFSI is 1).
Differential scanning calorimetry (DSC) measurements were performed using a Mettler-Toledo DSC3, under an inert argon flux of 50 ml/min, cooling from 320 K down to 180 K and then heating back to 315 K at a temperature rate of 5 K min−1.
Infrared absorbance measurements were performed at the AILES beamline of Soleil Synchrotron in the far infrared range (30–680 cm−1) by means of a Bruker IFS125 HR spectrometer, equipped with a bolometer detector and a Si coated mylar beamsplitter, with a resolution of 1 cm−1. The sample was cooled from room temperature down to 120 K with a temperature rate of 5 K/min by means of a Cryomech cryopump and afterwards was heated back up to 330 K. In the mid infrared range (400–6,000 cm−1), absorbance experiments were conducted at CNR in Rome by means of an Agilent Cary660 spectrometer, equipped with a DTGS detector and a KBr beamsplitter, with a resolution of 1 cm−1. The sample was cooled from room temperature down to 120 K and heated back to 350 K by means of a Specac Variable Temperature Cell Holder. For both type of measurements, a droplet of the ionic liquid was placed between the diamond optical windows of a cell for liquids, equipped with viton O-rings to avoid leaks and/or contaminations from air or water. A mylar spacer 10 (50) μm thick was used for measurements in the mid- (far-) infrared range.
A computational study of both the single ions and the ionic couples composing the ILs here investigated was conducted by means of the Spartan software [45]. In both cases, a preliminary investigation of the possible conformers of the single ions or of the ionic couples was performed by systematic rotations of 120° of the flexible bonds by means of molecular mechanics. The identified geometries were afterwards optimized by means of DFT calculations and finally the vibration frequencies and infrared intensities were computed at the same level of theory. To compare calculations with the experimental results, an expected absorption spectrum was generated summing Gaussian peaks centered at the calculated vibration frequencies, with intensity proportional to that obtained by calculations and a fixed variance of 10 cm−1. For all DFT calculations, the 6-31G** basis set was employed, with the ωB97X-D functional including empirical dispersion corrections and the presence of a polar solvent (dimethylformamide, εr = 37.22).
This choice of DFT functional, basis set and polar medium was motivated by our previous survey study on protic ILs, in which hydrogen bonding is of primary importance, where we demonstrated the superior performance of theωB97X-D functional compared to the more common B3LYP for a general interpretation of the infrared spectra of ILs [44].
To study the possible interactions between the TFSI anion and the different cations, a computational study of the ion pairs composing the two pure liquids has been performed.
Figure 2 shows the lowest energy configurations of the N111(2O1)-TFSI and N122(2O1)-TFSI ionic couples, as obtained by DFT calculations with the 6-31G** basis set and the ωB97X-D functional, including empirical dispersion corrections and the presence of a polar solvent (dimethylformamide, εr = 37.22). The TFSI is found to be in its trans-configuration, which is experimentally detected to be energetically favored with respect to the cis-one [38, 39].
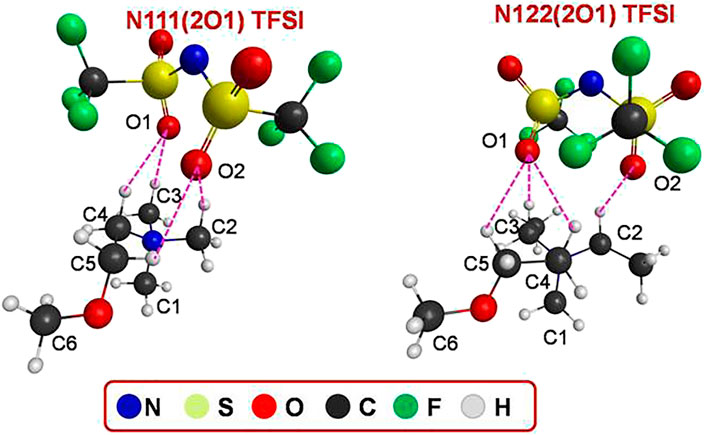
FIGURE 2. Lowest energy configurations of the two ionic couples N111(2O1)-TFSI and N122(2O1)-TFSI, as obtained by DFT calculations with 6-31G** basis set and the ωB97X-D functional, including empirical dispersion corrections and the presence of a polar solvent (dimethylformamide, εr = 37.22).
In both ionic couples there are many H atoms attached to C atoms of the cation pointing towards the O atoms of the anion. Table 1 reports the most significant HO distances and CHO angles in the two ionic couples, with reference to the labeling of Figure 2.
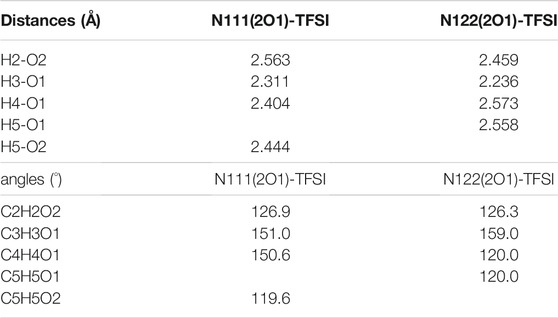
TABLE 1. The most significant HO distances (in Å) and CHO angles (in °) in N111(2O1)-TFSI and N122(2O2)-TFSI ionic couples, as obtained by DFT calculations with the 6-31G** basis set and the ωB97X-D functional, including empirical dispersion corrections and the presence of a polar solvent (dimethylformamide, εr = 37.22). Atom labels refer to Figure 2.
It can be noted in Table 1 that there are some short H-O distances, of about 2.3 Å or less, and among these we can also find some partial alignment of the CH bond of the cation and the O atoms of the anion; in particular we can notice two almost aligned (around 150°) H-O short distances in N111(2O1)-TFSI and one in N122(2O1)-TFSI. It is worth noting that the CH bonds closer and more aligned to the anion O atoms involve in both cases C atoms directly linked to the central N atom. The calculated values suggest the occurrence of a weak to moderate interaction [46–49]. Indeed, although the CH … O interaction is classified as a possible hydrogen bond analogue to NH … O, the former is much less intense and gives rise to an energy gain much smaller compared to the latter, due to the stronger covalent character of the C-H bond compared to the N-H one [46].
DFT calculations can also help in defining the degree of conformational disorder present in each IL. In fact, the systematic investigation of the possible conformers of the two ILs indicates that N122(2O1)-TFSI possesses 126 conformers whose energy differ by no more than 10 kJ/mol from the lowest energy one; on the contrary, N111(2O1)-TFSI has only 3 conformers within such an energy range (see Supplementary Figure S1 and Supplementary Figure S2 of the Supplementary Material for the geometry of the ionic couples, Supplementary Table S1 and Supplementary Table S2 for the energy difference between the conformers and Supplementary Table S3 and Supplementary Table S4 for the atomic positions of the atoms in the ionic couples). Therefore, at room temperature there is a large number of possible conformers populated for N122(2O1)-TFSI and only a few for N111(2O1)-TFSI. Based on these findings, N122(2O1)-TFSI is expected to be more disordered at molecular level than N111(2O1)-TFSI.
DSC measurements were performed to investigate the evolution of thermodynamic phases as a function of temperature and relative concentration of the ILs. The DSC curves of the two pure ILs and of their mixtures are shown in Figure 3. The curve of the N111(2O1)-TFSI sample measured on cooling (See SI) displays an exothermic peak around 265 K indicating the occurrence of crystallization, while on heating back an endothermic peak is detected around 310 K corresponding to the melting. These findings agree with previous electrical conductivity experiments which showed that N111(2O1)-TFSI undergoes a solid-liquid phase transition around 310 K [33]. On the contrary, the curves measured for the N122(2O1)-TFSI sample both on cooling and heating do not display relevant features, pointing toward the occurrence of an eventual glass transition at a temperature below our lower experimental limit. Indeed, this hypothesis is in agreement with previously reported electrical conductivity measurements of N122(2O1)-TFSI that revealed a Vogel–Fulcher–Tammann behavior between 233 and 353 K, which is typical of an IL undergoing a glass transition at low temperature [33].
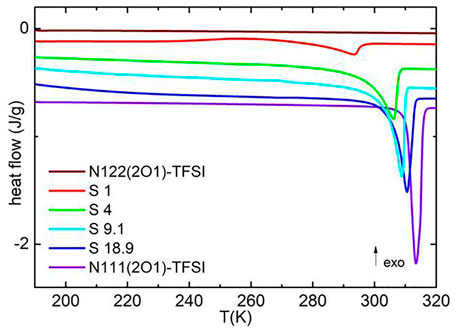
FIGURE 3. DSC curves measured on heating at 5 K min−1 of N111(2O1)-TFSI, N122(2O1)-TFSI and of their mixtures.
The DSC curves measured for the S18.9, S9.1 and S4 samples are very similar to those measured for the N111(2O1)-TFSI sample, as they display an exothermic peak on cooling and an endothermic process on heating back. These features indicate that the mixed samples with a higher amount of the N111(2O1)-TFSI liquid crystallize on cooling and then melt on heating, with the presence of the N122(2O1)-TFSI sample resulting in the lowering of the transition temperatures compared to those ones reported for the N111(2O1)-TFSI main liquid component. It can be noted that the melting temperature decreases as the relative concentration of N122(2O1)-TFSI increases, passing from 313 K in pure N111(2O1)-TFSI to 306 K in S4.
The DSC curve of the S1 sample on cooling does not display relevant features indicating that a further increase in the amount of the N122(2O1)-TFSI sample in the mixed system suppresses the occurrence of the crystallization on cooling and suggests the occurrence of a glass transition at lower temperatures, similar to what observed for the N122(2O1)-TFSI component. On heating, however, a broad and very large bump is observable above 240 K, which is followed, on further heating, by an endothermic peak whose minimum is around 293 K. These features are the signature of the occurrence of a cold crystallization on the heating scan, followed by the melting at higher temperatures. It is worth noting that the occurrence of the so-called “cold crystallization” has been reported for many ILs and that this kind of transition corresponds to the transformation of a metastable phase, reached at low temperatures, towards the stable crystalline state. In summary, even the mixture with the highest N122(2O1)-TFSI content (S1) can display a crystalline phase, even though the kinetics of the transformation is quite slow.
These results agree with previous report [50] indicating that the properties of a mixture of ILs are highly dependent not only on the nature of the added liquid, but also on the relative amount of the mixed liquids.
To investigate the microscopic changes occurring during the different phases previously described for both the pure ILs and their mixtures as well as to obtain information about the different kind of interactions governing these phases, we performed a detailed IR study of the vibrational properties of all the samples as a function of temperature.
In the following, the reported experimental results will be divided into three sections, according to the different frequency ranges to be investigated: 1) the frequency range between 550 and 700 cm−1, where one finds the markers of the TFSI conformers; 2) the range below 250 cm−1, where in similar ILs one finds the peaks due to dispersion forces and hydrogen bonding; 3) the spectral range between 2,770 and 3,100 cm−1, where one finds the CH stretching bands.
Figure 4displays the infrared absorbance spectra of N111(2O1)-TFSI,N122(2O1)-TFSI and the four mixtures, measured on heating from about 110 K in the wavenumber region where the markers of the conformers of TFSI are present. TFSI shows two conformers, namely cis and trans, that give rise two slightly different IR spectra: cis-TFSI displays two absorption bands centered around 600 and 650 cm−1, while trans-TFSI shows one intense absorption around 620 cm−1.
The occurrence of phase transitions as a function of the temperature has already been detected in TFSI containing ILs by means of the temperature evolution of the infrared spectral markers of the two anionic conformers of the anion [32, 37–39, 51, 52]. In the liquid phase both conformers coexist in equilibrium following the Boltzman distribution. When crystallization occurs, only one of them survives, usually the trans conformer, that is the most thermodynamically stable, with rare exceptions that can be mainly found in ILs containing cations with long alkyl chains [38, 39, 53]. On the contrary, upon vitrification, both conformers survive, and usually their concentrations become frozen in the glass state [39].
Regarding N111(2O1)-TFSI, one can note in Figure 4, that both conformers of the anion are present above 316 K, but the absorptions of cis-TFSI, centered around 600 and 650 cm−1, disappear below 301 K and are barely visible in the spectrum measured at 301 K, confirming the occurrence of a solid state below 301 K and of a liquid phase above 316 K.
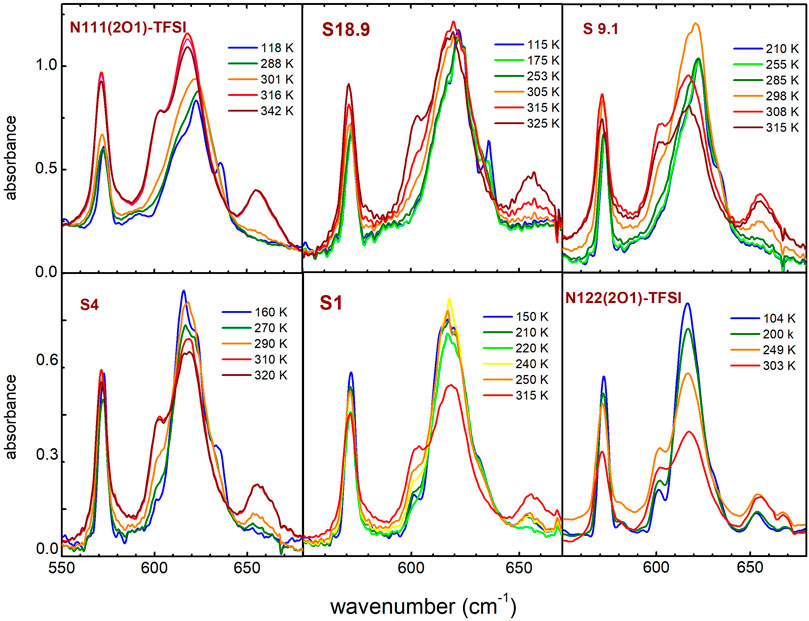
FIGURE 4. Temperature dependence of the infrared absorption spectra of N111(2O1)-TFSI, N122(2O1)-TFSI and the four mixtures, measured on heating in the wavenumber range containing the markers of the cis and trans conformers of the anion.
Conversely, as reported in Figure 4, in N122(2O1)-TFSI both conformers of the anion are present at all temperatures between 104 and 303 K in agreement with the possible occurrence of a glass transition at lower temperatures. The present measurements extend the investigation of the different phases of this ionic liquid down to 104 K.
Moreover, the spectra of samples S18.9, S9.1 and S4 at low temperatures (Figure 4) only present the absorption line of the trans-TFSI conformer around 620 cm−1:on heating, above 305, 285 and 270 K respectively for the three mixtures. Moreover, the lines of the cis conformer are detectable around 600 and 650 cm−1 confirming the occurrence of a melting in accordance with DSC results.
Sample S1 (see Figure 4) instead, at low temperature presents contributions from both conformers, while around 220 K the lines due to the cis conformer disappear and only the absorption around 620 cm−1 is visible suggesting the occurrence of a solid crystalline state. On further heating, already at 240 K both conformers are present indicating the melting of the sample towards a liquid phase. These features agree with the DSC measurement showing the occurrence during heating of a cold crystallization and a subsequent melting for S1. In general, for all concentrations of the ILs, the IR measurements are well consistent with the phase transformations observed by means of DSC.
Figure 5 displays the temperature dependence of the absorption spectra of the two pure ILs and of their mixtures in the far infrared region, below 250 cm−1. The peaks centered around 210 and 230 cm−1 are due to the vibrations of the TFSI anion [52, 53], even if it is not possible to clearly distinguish contributions coming from either the cis or the trans conformer; however, their relative intensities display an abrupt change (between 305 and 290 K) in N111(2O1)-TFSI and in samples S18.9, S9.1 and S4, while display a smooth evolution in N122(2O1)-TFSI, in agreement with the occurrence of a crystalline-liquid transition in the first group of liquids and of a glass transition in N122(2O1)-TFSI. Concerning sample S1 these two absorptions also present a rather smooth evolution, even if a small difference in their relative intensity between 220 and 250 K could be an indication of the occurring of the cold crystallization.
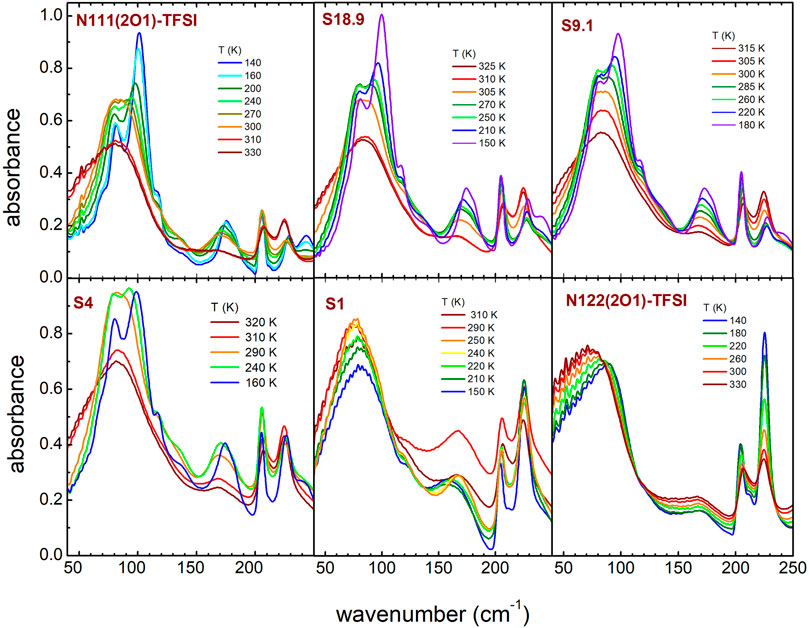
FIGURE 5. Temperature dependence of the infrared absorption spectra of N111(2O1)-TFSI, N122(2O1)-TFSI and all their mixtures, measured on heating in the wavenumber range between 40 and 250 cm−1.
Besides these peaks ascribed to TFSI, in this frequency range, absorptions due to intramolecular interactions can usually be found. In many ILs a very broad peak can be detected around 80–90 cm−1 at high temperatures [40–44], which has been attributed to the dispersion forces acting in these materials.
In the present case, this feature is visible for all the samples: indeed at high temperatures a well-developed absorption is centered at ∼80 cm−1 (at 330 K) in N111(2O1)-TFSI and at ∼70 cm−1 in N122(2O1)-TFSI. In the latter one, this feature only slightly shifts towards higher frequencies at low temperatures, reaching 90 cm−1 at 140 K. On the contrary, in the solid phase of N111(2O1)-TFSI and of the samples S18.9, S9.1 and S4 the broad band splits, and especially at the lowest temperatures one can observe two much narrower peaks centered around 80 and 100 cm−1. Moreover, in these samples a large and poorly intense peak, centered around 170 cm−1 at 330 K, strongly increases its intensity at low temperatures. On the contrary, the equivalent band in N122(2O1)-TFSI seems not to show any temperature evolution. DFT calculations suggest that these bands are due to an internal movement of the cation both in N111(2O2)-TFSI and in N122(2O2)-TFSI.
DFT calculations on the N111(2O1)-TFSI and N122(2O1)-TFSI ionic couples provide evidence that hydrogen bonds (see Figure 2) give clear marks in the far infrared region, below 200 cm−1. In fact, in both ILs one finds infrared active vibrations at 40 and 52 cm−1, that can be ascribed to a bending of the hydrogen bond, by examining the associated atomic movements. Moreover, the visual inspection of the molecular movements suggests that there are three vibrations centered around 96, 107 and 118 cm−1 in N111(2O1)-TFSI and at 90, 104 and 130 cm−1 in N122(2O1)-TFSI associated to the stretching of the hydrogen bonds.
The splitting of the broad band centered around 80 cm−1 has been previously observed in ILs exhibiting hydrogen bonding, in particular in protic ILs where this kind of bonding is more intense [40–44, 46, 54]. In general, in these ILs three contributions can be identified by means of a deconvolution fitting procedure of the absorption spectrum below 200 cm−1: the central peak centered around 80–90 cm−1, due to the dispersion forces, and two lateral bands due to the bending and the stretching modes of the hydrogen bonds, respectively. Moreover, in the liquid state, the hydrogen bonded configurations and the geometries governed by the dispersion forces are in thermal equilibrium, governed by the Boltzmann distribution. An analysis of the relative intensities of the bands due to the dispersion forces and to the hydrogen bonding can lead to the determination of their energy difference. One can define:
Furthermore, it is worth noting that the lower peak frequency of the stretching of hydrogen bonding points towards a much less intense hydrogen bond in the presently investigated sample with respect to protic ILs. Indeed, in N111(2O1)-TFSI the stretching bond is centered around 110 cm−1, while it is detected at 158 cm−1 in DEMA-MS and at 150 cm−1in DEMA-TfO [44].
Figure 6 reports the temperature dependence of the mid-infrared absorption of the two starting N111(2O1)-TFSI and N122(2O2)-TFSI samples and of their mixtures in the frequency range where the CH modes are active. At the highest temperature, where all the measured samples are in the liquid phase, they all present six main peaks centered around 2,830, 2,855, 2,905, 2,955, 3,000 and 3,055 cm−1, even though their relative intensities differ.
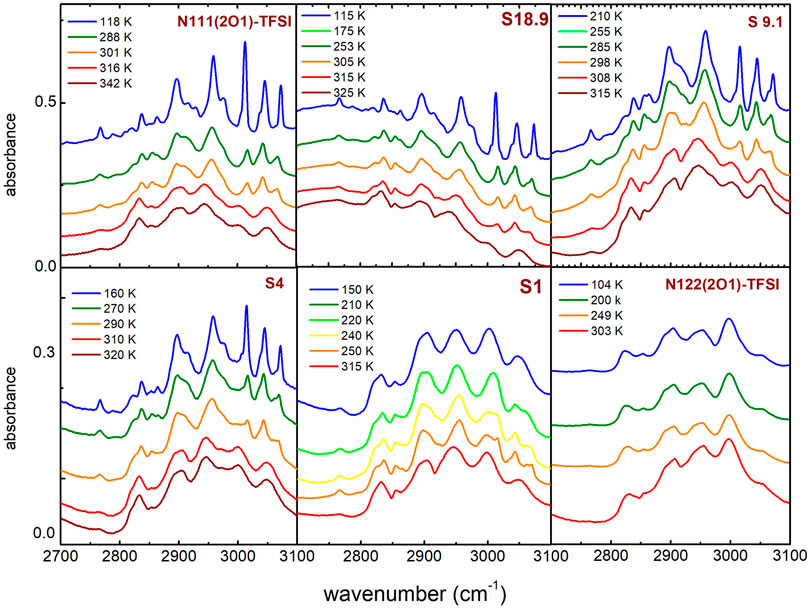
FIGURE 6. Temperature dependence of the infrared absorption spectra of N111(2O1)-TFSI, N122(2O1)-TFSI and their mixtures, measured on heating in the wavenumber range of the CH stretching vibrations.
The absorption spectrum of the N122(2O1)-TFSI looks similar at all temperatures, similarly to what observed in the frequency range where the anion conformers absorption bands are detectable. The absorption spectrum of the N111(2O1)-TFSI sample, instead, changes in the low temperature crystalline phase, where the CH bands split and many less intense lines appear. The main difference between the liquid (Figure 6 line at 342 K) and solid state (Figure 6, already at 301 K) concerns the bands above 3,000 cm−1: two contributions at high T abruptly evolve into three sharp bands in the solid phase.
A behavior like that of N111(2O1)-TFSI is showed also by the mixtures S18.9, S9.1 and S4, whose spectra appear more structured at low temperature and in particular they all present a splitting into three well separated and narrow bands above 3,000 cm−1. The sample S1 which, as showed before, on heating undergoes a cold crystallization before the melting, presents a similar spectrum at the highest and lowest temperatures, where it is supposed to be either in the glassy or liquid state. However, at intermediate temperatures (see Figure 6 curves measured at 240 and 250 K), where the cold crystallization occurs, its spectrum shows a splitting of the lines above 3,000 cm−1, even if it is less evident than in the other samples.
A detailed attribution of these bands to specific movements in this cation is missing in the literature. In imidazolium cation, the CH absorption peaks were attributed with increasing frequencies to the whole alkyl chain, and to the imidazolium ring, with the C4, C5 and C2 carbon atoms involved [55]. In pyrrolidinium cation it has been suggested that from the lowest to the highest frequencies the bands are assigned to the terminal CH3 group of the alkyl chain, to the whole alkyl chain, to the motions of the pyrrolidinium ring and finally to the CH3 methyl group directly attached to the N atom [56].
The present DFT calculation on the N111(2O1)-TFSI couple suggest that the peaks at the highest wavenumbers are associated to the movements involving the C2H2, C3H3 and C4H4 bonds (see Figure 2 for labels) directly linked to the N atom, while moving to lower frequencies the other atoms belonging to the chain containing the ethoxy moiety become involved. Therefore, the measurements indicate that the absorption bands more affected by the transition to the solid state are those due to the movements of the atoms likely involved in hydrogen bonding.
DSC measurements clearly show that the two starting ILs, differing only for the length of two short chains, present significantly different thermal behavior as, on cooling, N111(2O1)-TFSI undergoes crystallization, while N122(2O1)-TFSI is likely to become a glass. This difference is accompanied by a different evolution of the anion conformers distribution, with the retention only of the low energy trans conformer in the solid phase of the N111(2O1)-TFSI sample. These findings are in close agreement with what was already observed for other ILs with the same anion conformer and cation with short alkyl chain [38]. Moreover, in mixtures with a predominant component of the N111(2O1)-TFSI sample, the crystallization behavior is still observed with the same anion conformer distribution. In a more diluted system, i.e. for the sample where the two different ethoxy functionalized liquids are present in the same ratio, a different behavior is observed. Indeed, this mixture does not crystallize on cooling, similarly to the N122(2O1)-TFSI sample, while it presents cold crystallization and subsequent melting on heating, whereas the N122(2O1)-TFSI does not show these features. It must be pointed out that the metastable solid phase displayed by this mixture only retains the trans anion conformer. These findings can be summarized in Figure 7, reporting a sort of phase diagram of the mixed system.
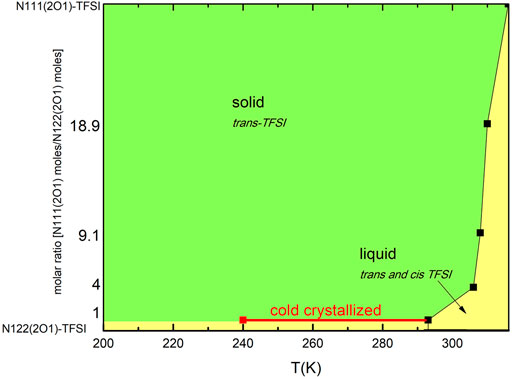
FIGURE 7. Schematic picture of different phases showed on heating by the mixed system.
Information coming from the temperature dependence of the far-infrared spectra also confirm differences between the two starting liquids. The occurrence of a possible hydrogen bond is particularly evident in the solid phase of the N111(2O1)-TFSI sample and of the mixtures where this liquid is the main component. An evaluation of the enthalpy difference between the configurations dominated by the dispersion interactions and those dominated by hydrogen bonding confirms that in these samples the H-bonded ion pairs are favored in energy over the dispersion-interaction-dominated pairs, while for sample N122(2O1)-TFSI, the ratio between the intensities of the vibrational bands of the two configurations seems to be independent of the temperature, indicating a minor role for the hydrogen bonding compared to the dispersion interactions. In particular, it seems that the differences between the configurations dominated by the dispersion interactions and those dominated by hydrogen bonding become minor with the increasing amount of the N122(2O1)-TFSI sample in the mixtures.
The comparison with computational results suggests that the observed hydrogen bonding could be ascribed to the CH bonds involving the C atoms directly linked to the central N atom, which are closer and more aligned to the anion O atoms. The calculated values for angles and distances involved in these bonding suggest the occurrence of a weak to moderate interaction and indeed, as previously discussed, the lower peak frequency of the stretching of hydrogen bonding points towards a much less intense hydrogen bond in the presently investigated sample with respect to protic ILs. Moreover, the values obtained for the enthalpy difference are close to those recently reported for the CH … O hydrogen bonding in 1-ethyl-3-methylimidazolium—trifluoromethanesulfonate [46].
It must be pointed out that computational results on the two starting ILs do not rule out the possible occurrence of hydrogen bonding in the N122(2O1)-TFSI sample, since also in this case, one can identify one CH bond quite close and aligned to the anion O atoms, whereas in the N111(2O1)-TFSI sample we can identify at least two of these bonds. However, the experimental infrared spectroscopy results and their analysis indicate that in the former liquid the occurrence of this interaction is not energetically favored. It is likely that due to the higher number of possible cation conformer, there is an high conformational disorder which hinders the directional ordering required for the formation, and detection, of this vibrational feature. Indeed, one of the main consequences of the small difference in the length of the two short alkyl chains between the two ILs is the different number of cationic conformers already populated at room temperature. In fact, a particularly large conformational disorder has been considered to be responsible for the lack of a clear hydrogen bonding contribution in the infrared spectrum also by recent measurement in 1,7-diazabicyclo [5.4.0]undec-7-ene (DBU) bis(trifluoromethanesulfonyl)-imide (TFSI) thus indicating a weaker hydrogen bonding interaction compared to the parent DBU-TfO, where less configurational disorder occurs [54].
All these observations suggest that in N111(2O2)-TFSI with a stronger hydrogen bonding there is more possibility to have a better packing between anions and cations that also help in obtaining a well-ordered crystalline state, contrarily to what happens in N122(2O2)-TFSI. Further confirming the role of the hydrogen bonding in the formation of the solid phase, the measurements indicate that the absorption bands more affected by the transition to the solid state are those due to the movements of the C atoms likely involved in hydrogen bonding. Indeed in the crystalline phase of N111(2O1)-TFSI and its mixtures, the ordering of the CH bonds is visible by a narrowing and a splitting of the corresponding CH absorption bands.
The two investigated ethoxy-containing ILs present significant different thermal behavior accompanied by a different evolution of the anion conformers distribution, with the retention only of the low energy trans conformer in the solid phase of the N111(2O1)-TFSI sample and of its mixtures. Differences between the two liquids are detected also for the intermolecular interactions, since the occurrence of a possible CH … O hydrogen bond is particularly evident in the solid phase of the N111(2O1)-TFSI sample and in all mixtures where it acts as a solvent, while it is less evident for sample N122(2O1)-TFSI. Apparently differences between the configurations dominated by the dispersion interactions and those dominated by hydrogen bonding become smaller with the increasing amount of the N122(2O1)-TFSI sample in the mixtures. The lack of a clear hydrogen bonding for the latter liquid is attributed to the higher conformational disorder due to the higher number of cationic conformer. In this framework, the different thermal behavior is clarified since in the more ordered N111(2O1)-TFSI with a stronger hydrogen bonding there are more possibility to have a better packing between anions and cations that also help in obtaining a well-ordered crystalline state, contrarily to what happens in N122(2O1)-TFSI.
The original contributions presented in the study are included in the article/Supplementary Material, further inquiries can be directed to the corresponding author.
AP and GA conceived the idea, ES, GM, RL, SF and AF performed the synthesis, AS, FT, AC, OP, SB, J-BB and PR performed the measurements, OP and AP performed data analysis and wrote the paper. All authors reviewed and edited the published version of the manuscript.
SF, RL, and AF were employed by the company Solvionic SA.
The remaining authors declare that the research was conducted in the absence of any commercial or financial relationships that could be construed as a potential conflict of interest.
All claims expressed in this article are solely those of the authors and do not necessarily represent those of their affiliated organizations, or those of the publisher, the editors and the reviewers. Any product that may be evaluated in this article, or claim that may be made by its manufacturer, is not guaranteed or endorsed by the publisher.
The authors would like to acknowledge the financial support from the European Union Horizon 2020 research and innovation program within the Si-DRIVE project, grant agreement No 814464, and the CALIPSOplus project, grant agreement No 730872, for the beamtime 20190321 at SOLEIL Synchrotron.
The Supplementary Material for this article can be found online at: https://www.frontiersin.org/articles/10.3389/fphy.2022.851279/full#supplementary-material
1. Singh SK, Savoy AW. Ionic Liquids Synthesis and Applications: An Overview. J Mol Liquids (2020) 297:112038. doi:10.1016/j.molliq.2019.112038
2. Chiappe C, Pomelli CS. Point-functionalization of Ionic Liquids: an Overview of Synthesis and Applications. Eur J Org Chem (2014) 2014:6120–39. doi:10.1002/ejoc.201402093
3. Huang RTW, Peng KC, Shih HN, Lin GH, Chang TF, Hsu SJT, et al. Antimicrobial Properties of Ethoxyether-Functionalized Imidazolium Salts. Soft Matter (2011) 7:8392–400. doi:10.1039/c1sm05759f
4. Alqurashy BA. An Efficient Preparation and Characterization of 1-(2-Ethoxy-2-Oxoethyl)imidazolium Based Ionic Liquids Derivatives as Potential Bioactive Agents. J Saudi Chem Soc (2020) 24 (8):631–635. doi:10.1016/j.jscs.2020.06.005
5. Gionfriddo E, Souza-Silva ÉA, Ho TD, Anderson JL, Pawliszyn J. Exploiting the Tunable Selectivity Features of Polymeric Ionic Liquid-Based SPME Sorbents in Food Analysis. Talanta (2018) 188:522–30. doi:10.1016/j.talanta.2018.06.011
6. Shi S, Yin T, Shen W. Switchable Foam Control by a New Surface-Active Ionic Liquid. RSC Adv (2016) 6:93621–5. doi:10.1039/c6ra17245h
7. Schutt TC, Hegde GA, Bharadwaj VS, Johns CM. Impact of Water-Dilution on the Solvation Properties of the Ionic Liquid 1-Methyltriethoxy-3-Ethylimidazolium Acetate for Model Biomass Molecules. J Phys Chem B (2017) 121:843–53. doi:10.1021/acs.jpcb.6b09101
8. Khodakarami M, Alagha L. Separation and Recovery of Rare Earth Elements Using Novel Ammonium-Based Task-specific Ionic Liquids with Bidentate and Tridentate O-Donor Functional Groups. Separation Purif Technology (2020) 232:115952. doi:10.1016/j.seppur.2019.115952
9. El-Hajjaji F, Messali M, Aljuhani A, Aouad MR, Hammouti B, Belghiti ME, et al. Pyridazinium-based Ionic Liquids as Novel and green Corrosion Inhibitors of Carbon Steel in Acid Medium: Electrochemical and Molecular Dynamics Simulation Studies. J Mol Liquids (2018) 249:997–1008. doi:10.1016/j.molliq.2017.11.111
10. Ahmed SA, Awad MI, Althagafi II, Altass HM, Morad M, Alharbi A, et al. Newly Synthesized Indolium-Based Ionic Liquids as Unprecedented Inhibitors for the Corrosion of Mild Steel in Acid Medium. J Mol Liquids (2019) 291:111356. doi:10.1016/j.molliq.2019.111356
11. Messadi A, Mohamadou A, Boudesocque S, Dupont L, Fricoteaux P, Nguyen-Van-Nhien A, et al. Syntheses and Characterisation of Hydrophobic Ionic Liquids Containing Trialkyl(2-Ethoxy-2-Oxoethyl)ammonium or N-(1-methylpyrrolidyl-2-ethoxy-2-oxoethyl)ammonium Cations. J Mol Liquids (2013) 184:68–72. doi:10.1016/j.molliq.2013.04.023
12. Watanabe M, Thomas ML, Zhang S, Ueno K, Yasuda T, Dokko K. Application of Ionic Liquids to Energy Storage and Conversion Materials and Devices. Chem Rev (2017) 117:7190–239. doi:10.1021/acs.chemrev.6b00504
13. Hess A, Barber G, Chen C, Mallouk TE, Allcock HR. Organophosphates as Solvents for Electrolytes in Electrochemical Devices. ACS Appl Mater Inter (2013) 5:13029–34. doi:10.1021/am403924t
14. He Z, Yuan X, Zhao Y, Zou C, Guo S, He B, et al. A Greener Electrochromic Liquid crystal Based on Ionic Liquid Electrolytes. Liquid Crystals (2016) 43:1110–9. doi:10.1080/02678292.2016.1160296
15. Shaplov AS, Ponkratov DO, Vlasov PS, Lozinskaya EI, Malyshkina IA, Vidal F, et al. Solid-state Electrolytes Based on Ionic Network Polymers. Polym Sci Ser B (2014) 56:164–77. doi:10.1134/s1560090414020134
16. Ponkratov DO, Lozinskaya EI, Vlasov PS, Aubert P-H, Plesse C, Vidal F, et al. Synthesis of Novel Families of Conductive Cationic Poly(ionic Liquid)s and Their Application in All-Polymer Flexible Pseudo-supercapacitors. Electrochimica Acta (2018) 281:777–88. doi:10.1016/j.electacta.2018.05.191
17. Ehsani A, Kowsari E, Boorboor Ajdari F, Safari R, Mohammad Shiri H. Influence of Newly Synthesized Geminal Dicationic Ionic Liquid on Electrochemical and Pseudocapacitance Performance of Conductive Polymer Electroactive Film. J Colloid Interf Sci (2017) 505:1158–64. doi:10.1016/j.jcis.2017.07.001
18. Ajdari FB, Kowsari E, Nadri HR, Maghsoodi M, Ehsani A, Mahmoudi H, et al. Electrochemical Performance of Silsesquioxane-GO Loaded with Alkoxy Substituted Ammonium-Based Ionic Liquid and POAP for Supercapacitor. Electrochimica Acta (2020) 354:136663. doi:10.1016/j.electacta.2020.136663
19. Appetecchi GB, Scaccia S, Tizzani C, Alessandrini F, Passerini S. Synthesis of Hydrophobic Ionic Liquids for Electrochemical Applications. J Electrochem Soc A (2006) 153:1685–91. doi:10.1149/1.2213420
20. Appetecchi GB, Carewska M, Montanino M, Alessandrini F, Passerini S. LiFSI-PYR1AFSI Binary Electrolyte Mixtures for Lithium Batteries. ECS Transac (2010) 25:49–60. doi:10.1149/1.3393839
21. Reiter J, Paillard E, Grande L, Winter M, Passerini S. Physicochemical Properties of N-Methoxyethyl-N-Methylpyrrolidinum Ionic Liquids with Perfluorinated Anions. Electrochimica Acta (2013) 91:101–7. doi:10.1016/j.electacta.2012.12.086
22. Ferrari S, Quartarone E, Mustarelli P, Magistris A, Protti S, Lazzaroni S, et al. A Binary Ionic Liquid System Composed of N-Methoxyethyl-N-Methylpyrrolidinium Bis(trifluoromethanesulfonyl)-Imide and Lithium Bis(trifluoromethanesulfonyl)imide: A New Promising Electrolyte for Lithium Batteries. J Power Sourc (2009) 194:45–50. doi:10.1016/j.jpowsour.2008.12.013
23. Appetecchi GB, Montanino M, Carewska. M, Moreno M, Alessandrini F, Passerini S. Chemical-physical Properties of Bis(perfluoroalkylsulfonyl)imide-Based Ionic Liquids. Electrochim Acta (2011) 56:1300–7. doi:10.1016/j.electacta.2021.10.023
24. Nirmale T, Khupse N, Gore R, Ambekar J, Kulkarni M, Varma A, et al. Ethoxy-ester Functionalized Imidazolium Based Ionic Liquids for Lithium Ion Batteries. ChemistrySelect (2018) 3:6255–61. doi:10.1002/slct.201800513
25. Navarra MA, Fujimura K, Sgambetterra M, Tsurumaki A, Panero S, Nakamura N, et al. New Ether-Functionalized Morpholinium- and Piperidinium-Based Ionic Liquids as Electrolyte Components in Lithium and Lithium-Ion Batteries. ChemSusChem (2017) 10:2496–504. doi:10.1002/cssc.201700346
26. Tsurumaki A, Ohno H, Panero S, Navarra MA. Novel Bis(fluorosulfonyl)imide-Based and Ether-Functionalized Ionic Liquids for Lithium Batteries with Improved Cycling Properties. Electrochimica Acta (2019) 293:160–5. doi:10.1016/j.electacta.2018.09.205
27. Navarra MA. Ionic Liquids as Safe Electrolyte Components for Li-Metal and Li-Ion Batteries. MRS Bull (2013) 38:548–53. doi:10.1557/mrs.2013.152
28. Trequattrini F, Palumbo O, Gatto S, Appetecchi GB, Paolone A. A Computational and Experimental Study of the Conformers of Pyrrolidinium Ionic Liquid Cations Containing an Ethoxy Group in the Alkyl Side Chain. Adv Chem (2016) 2016:7297268. doi:10.1155/2016/7297268
29. Shukla M. Hydrogen Bonding Interactions in Nicotinamide Ionic Liquids: a Comparative Spectroscopic and DFT Studies. J Mol Struct (2017) 1131:275–80. doi:10.1016/j.molstruc.2016.11.067
30. Dhungana KB, Margulis CJ. Comparison of the Structural Response to Pressure of Ionic Liquids with Ether and Alkyl Functionalities. J Phys Chem B (2017) 121:6890–7. doi:10.1021/acs.jpcb.7b04038
31. Park SK, Han KS, Lee JH, Murugesan V, Lee SH, Koo CM, et al. Evolution of Ion-Ion Interactions and Structures in Smectic Ionic Liquid Crystals. J Phys Chem C (2019) 123:20547–57. doi:10.1021/acs.jpcc.9b04056
32. Tsurumaki A, Trequattrini F, Palumbo O, Panero S, Paolone A, Navarra MA. The Effect of Ether-Functionalisation in Ionic Liquids Analysed by DFT Calculation, Infrared Spectra, and Kamlet-Taft Parameters. Phys Chem Chem Phys (2018) 20:7989–97. doi:10.1039/c7cp08134k
33. Brutti S, Simonetti E, De Francesco M, Sarra A, Paolone A, Palumbo O, et al. Ionic Liquid Electrolytes for High-Voltage, Lithium-Ion Batteries. J Power Sourc (2020) 479:228791. doi:10.1016/j.jpowsour.2020.228791
34. Cimini A, Palumbo O, Simonetti E, De Francesco M, Appetecchi GB, Fantini S, et al. Decomposition Temperatures and Vapour Pressures of Selected Ionic Liquids for Electrochemical Applications. J Therm Anal Calorim (2020) 142:1791–7. doi:10.1007/s10973-020-10334-5
35. [Hbond] Duong A, Rajak S, Tremblay AA, Maris T, Wuest JD. Molecular Organization in Crystals of Bis(diaminotriazinyl)-Substituted Derivatives of Benzene, Pyridine, and PyrazineCryst. Growth Des (2019) 19:1299–307. doi:10.1021/acs.cgd.8b01694
36. Palumbo O, Trequattrini F, Brubach J-B, Roy P, Paolone A. Crystallization of Mixtures of Hydrophilic Ionic Liquids and Water: Evidence of Microscopic Inhomogeneities. J Colloid Interf Sci (2019) 552:43–50. doi:10.1016/j.jcis.2019.05.034
37. Vitucci FM, Palumbo O, Trequattrini F, Brubach J-B, Roy P, Meschini I, et al. Interaction of 1-Butyl-1-Methylpyrrolidinium Bis(trifluoromethanesulfonyl)imide with an electrospunPVdF Membrane: Temperature Dependence of the Anion Conformers. J Chem Phys (2015) 143:094707. doi:10.1063/1.4929986
38. Palumbo O, Trequattrini F, Appetecchi GB, Paolone A. Influence of Alkyl Chain Length on Microscopic Configurations of the Anion in the Crystalline Phases of PYR1A-TFSI. J Phys Chem C (2017) 121:11129–35. doi:10.1021/acs.jpcc.7b02365
39. Capitani F, Gatto S, Postorino P, Palumbo O, Trequattrini F, Deutsch M, et al. The Complex Dance of the Two Conformers of Bis(trifluoromethanesulfonyl)imide as a Function of Pressure and Temperature. J Phys Chem B (2016) 120:1312–8. doi:10.1021/acs.jpcb.5b12537
40. Fumino K, Stange P, Fossog V, Hempelmann R, Ludwig R. Equilibrium of Contact and Solvent-Separated Ion Pairs in Mixtures of Protic Ionic Liquids and Molecular Solvents Controlled by Polarity. Angew Chem Int (2013) 52:12439–42. doi:10.1002/anie.201303944
41. Fumino K, Fossog V, Wittler K, Hempelmann R, Ludwig R. Dissecting Anion-Cation Interaction Energies in Protic Ionic Liquids. Angew Chem Int Ed (2013) 52:2368–72. doi:10.1002/anie.201207065
42. Fumino K, Reichert E, Wittler K, Hempelmann R, Ludwig R. Low-Frequency Vibrational Modes of Protic Molten Salts and Ionic Liquids: Detecting and Quantifying Hydrogen Bonds. Angew Chem Int Ed (2012) 51:6236–40. doi:10.1002/anie.201200508
43. Fumino K, Fossog V, Stange P, Paschek D, Hempelmann R, Ludwig R. Controlling the Subtle Energy Balance in Protic Ionic Liquids: Dispersion Forces Compete with Hydrogen Bonds. Angew Chem Int Ed (2015) 54:2792–5. doi:10.1002/anie.201411509
44. Palumbo O, Cimini A, Trequattrini F, Brubach J-B, Roy P, Paolone A. The Infrared Spectra of Protic Ionic Liquids: Performances of Different Computational Models to Predict Hydrogen Bonds and Conformer Evolution. Phys Chem Chem Phys (2020) 22:7497–506. doi:10.1039/d0cp00907e
45. Shao Y, Molnar LF, Jung Y, Kussmann J, Ochsenfeld C, Brown ST, et al. Advances in Methods and Algorithms in a Modern Quantum Chemistry Program Package. Phys Chem Chem Phys (2006) 8:3172–91. doi:10.1039/b517914a
46. Palumbo O, Cimini A, Trequattrini F, Brubach J-B, Roy P, Paolone A. Evidence of the CH…O Hydrogen Bonding in Imidazolium Based Ionic Liquids from Far-Infrared Spectroscopy Measurements and DFT Calculations. Int J Mol.Sci (2021) 22:6155. doi:10.3390/ijms22116155
47. Jeffrey GA. An Introduction to Hydrogen Bonding. New York, NY, USA: Oxford University Press (1997).
48. Steiner T. The Hydrogen Bond in the Solid State. Angew Chem Int (2002) 41:48–76. doi:10.1002/1521-3773(20020104)41:1<48::aid-anie48>3.0.co;2-u
49. Hunt PA, Ashworth CR, Matthews RP. Hydrogen Bonding in Ionic Liquids. Chem Soc Rev (2015) 44:1257–88. doi:10.1039/c4cs00278d
50. Palumbo O, Trequattrini F, Navarra MA, Brubach J-B, Roy P, Paolone A. Tailoring the Physical Properties of the Mixtures of Ionic Liquids: a Microscopic point of View. Phys Chem Chem Phys (2017) 19:8322–9. doi:10.1039/c7cp00850c
51. Paschoal VH, Faria LFO, Ribeiro MCC. Vibrational Spectroscopy of Ionic Liquids. Chem Rev (2017) 117:7053–112. doi:10.1021/acs.chemrev.6b00461
52. Vitucci FM, Trequattrini F, Palumbo O, Brubach J-B, Roy P, Paolone A. Infrared Spectra of Bis(trifluoromethanesulfonyl)imide Based Ionic Liquids: Experiments and DFT Simulations. Vibrational Spectrosc (2014) 74:81–7. doi:10.1016/j.vibspec.2014.07.014
53. Vitucci FM, Trequattrini F, Palumbo O, Brubach J-B, Roy P, Navarra MA, et al. Stabilization of Different Conformers of Bis(trifluoromethanesulfonyl)imide Anion in Ammonium-Based Ionic Liquids at Low Temperatures. J Phys Chem A (2014) 118:8758–64. doi:10.1021/jp504833e
54. Triolo A, Paolone A, Sarra A, Trequattrini F, Palumbo O, Appetecchi GB, et al. Structure and Vibrational Features of the Protic Ionic liquid1,8-diazabicyclo[5.4.0]-Undec-7-Ene-8-Ium Bis(trifluoromethanesulfonyl)amide, [DBUH][TFSI]. J Mol Liq (2022) 347:117981. doi:10.1016/j.molliq.2021.117981
55. Haddad B, Brandán SA, Assenine MA, Paolone A, Villemin D, Bresson S. Bidentate Cation-Anion Coordination in the Ionic Liquid 1-Ethyl-3-Methylimidazolium Hexafluorophosphate Supported by Vibrational Spectra and NBO, AIM and SQMFF Calculations. J Mol Struct (2020) 1212:128104. doi:10.1016/j.molstruc.2020.128104
Keywords: ionic Liquids, phase transitions, infrared spectroscopy, DFT calculations, hydrogen bonding
Citation: Palumbo O, Sarra A, Brubach J-B, Trequattrini F, Cimini A, Brutti S, Appetecchi GB, Simonetti E, Maresca G, Fantini S, Lin R, Falgayrat A, Roy P and Paolone A (2022) So Similar, yet so Different: The Case of the Ionic Liquids N-Trimethyl-N (2-methoxyethyl)ammonium Bis (trifluoromethanesulfonyl)imide and N,N-Diethyl-N-methyl-N(2-methoxyethyl)ammonium bis(trifluoromethanesulfonyl)imide. Front. Phys. 10:851279. doi: 10.3389/fphy.2022.851279
Received: 09 January 2022; Accepted: 18 February 2022;
Published: 17 March 2022.
Edited by:
Mauro C. C. Ribeiro, Universidade de São Paulo, BrazilReviewed by:
Manish Pratap Singh, Veer Bahadur Singh Purvanchal University, IndiaCopyright © 2022 Palumbo, Sarra, Brubach, Trequattrini, Cimini, Brutti, Appetecchi, Simonetti, Maresca, Fantini, Lin, Falgayrat, Roy and Paolone. This is an open-access article distributed under the terms of the Creative Commons Attribution License (CC BY). The use, distribution or reproduction in other forums is permitted, provided the original author(s) and the copyright owner(s) are credited and that the original publication in this journal is cited, in accordance with accepted academic practice. No use, distribution or reproduction is permitted which does not comply with these terms.
*Correspondence: Oriele Palumbo, b3JpZWxlLnBhbHVtYm9Acm9tYTEuaW5mbi5pdA==
Disclaimer: All claims expressed in this article are solely those of the authors and do not necessarily represent those of their affiliated organizations, or those of the publisher, the editors and the reviewers. Any product that may be evaluated in this article or claim that may be made by its manufacturer is not guaranteed or endorsed by the publisher.
Research integrity at Frontiers
Learn more about the work of our research integrity team to safeguard the quality of each article we publish.