
94% of researchers rate our articles as excellent or good
Learn more about the work of our research integrity team to safeguard the quality of each article we publish.
Find out more
ORIGINAL RESEARCH article
Front. Phys., 23 September 2022
Sec. Optics and Photonics
Volume 10 - 2022 | https://doi.org/10.3389/fphy.2022.847656
This article is part of the Research TopicAdvances in Optical Imaging Techniques for Microscopy and NanotechnologyView all 7 articles
 Yixuan Shi1,2†
 Yanan Sun3†Rongrong Huang1,2Yong Zhou4Haoyu Zhai1,2Zhipeng Fan1,2Zechao Ou5Pengsheng Huang5
 Honghui He1,2*
 Chao He6*
 Yi Wang3*
 Hui Ma1,2,7
In this study, we propose a quantitative technique to analyze and evaluate microstructures of skin hair follicles based on Mueller Matrix transmission microscopy. We measure the Mueller matrix polar decomposition (MMPD) parameter images to reveal the characteristic linear birefringence distribution induced by hair follicles in mouse skin tissue samples. The results indicate that the Mueller matrix-derived parameters can be used to reveal the location and structural integrity of hair follicles. For accurate hair follicle location identification and quantitative structural evaluations, we use the image segmentation method, sliding window algorithm, and image texture analysis methods together to process the Mueller matrix-derived images. It is demonstrated that the hair follicle regions can be more accurately recognized, and their locations can be precisely identified based on the Mueller matrix-derived texture parameters. Moreover, comparisons between manual size measurement and polarimetric calculation results confirm that the Mueller matrix parameters have good performance for follicle size estimation. The results shown in this study suggest that the technique based on Mueller matrix microscopy can realize automatically hair follicle identification, detection, and quantitative evaluation. It has great potential in skin structure-related studies and clinical dermatological applications.
Skin health and structure detection have an extensive usage value in various fields from cosmetics to disease diagnosis [1,2]. Many imaging methods have been developed for skin detection, such as optical coherence tomography (OCT) [3], confocal laser scanning microscopy [4], and dermoscopy [5–7]. Among all the skin tissue structures, hair follicles play an important functional role in regulating hair growth. Moreover, the shape, structure, and quantity of hair follicles can indicate some diseases, such as androgenetic alopecia [8], which is a common form of hair loss occurring in both women and men. A recent study also shows that stem cells in the hair follicle can lead to melanoma, one of the deadliest skin cancers [9]. Thus, hair follicle identification, detection, and quantitative evaluation are important in studies and clinical applications. Mueller matrix polarimetry is a promising method for many studies [10], especially biomedical and clinical applications [11–13], because it has numerous advantages in tissue micro- and nano-structure detection. As a non-contact and label-free imaging method, Mueller matrix polarimetry can provide abundant quantitative structural information on tissue samples. Also, traditional optical equipment such as microscopes and endoscopes can be conveniently upgraded to the Mueller matrix microscope and endoscope by adding a polarization state generator (PSG) and analyzer (PSA) to their optical path [14]. Recent studies have demonstrated that the Mueller matrix microscope can be used to acquire structural characteristics of various pathological tissue samples and assist in diagnosis of skin cancer [15], liver fibrosis and cancer [16,17], cervical cancer [18–20], colon cancer [21], breast cancer [22–24], inflammatory bowel diseases [25], and screening and evaluating β-amyloidosis in Alzheimer’s disease [26]. Especially, Mueller matrix polarimetry is suitable for detection of anisotropic structures, such as muscle fibers, collagen fibers, and elastin fibers, with prominent linear birefringence properties [11,13,27,28]. To obtain quantitative information on fibrous structures in tissues and cells, in the past decades, several Mueller matrix analyzing methods have been proposed, such as the Mueller matrix polar decomposition (MMPD) [29] and the Mueller matrix transformation (MMT) [30], through which groups of parameters with clear physical meaning can be derived. It has been shown that the MMPD and MMT parameters can help us extract structural features of tissues accurately. Considering that hair follicles usually contain anisotropic structures such as root sheath, Mueller matrix microscopy can be a potential method for their detection and evaluation. In the practice of skin detection, Mueller matrix microscopy, whose transmission mode is forward, is usually used in trephine biopsy for skin histopathological diagnosis, such as skin cancer [15].
In this study, for quantitatively analyzing and evaluating microstructures of skin hair follicles, we first measure the microscopic Mueller matrices of mouse skin tissue slices. We calculate the MMPD parameter δ and θ (shown in Eq. 3) images, which have been prevalently adopted to reveal the value and angular distribution of linear birefringent micro- and nano-structures of turbid medium samples [31]. For accurate hair follicle location identification and quantitative structural evaluations, we use the image segmentation method, sliding window algorithm, and image texture analysis methods together to process the MMPD parameter δ and θ images. Moreover, we also try to extract the size information of hair follicles after identifying their locations. Comparisons between manual size measurement results and calculation results through Mueller matrix-derived parameters are carried out. The preliminary results shown in this study suggest that although more studies are still needed, the technique based on Mueller matrix microscopy can realize hair follicle identification, detection, and quantitative evaluation. Combined with image segmentation, sliding window algorithm, and image texture analysis methods, it has great potential in skin structure-related studies and clinical dermatological applications. Recently, the transmission Mueller matrix microscopy has been prevalently used for structural detection of various thin tissue samples [15–25]. The observation of histological tissue slices stained with a certain dye, which is the gold standard of pathological diagnosis, can help us extract groups of Mueller matrix parameters associated with microstructural features of skin hair follicles. Also, a link between the transmission and backward Mueller matrix parameters has been developed in our previous study [32]. Specifically, it is found that the conclusions drawn from transmission Mueller matrix microscopic imaging based on retardance can also be helpful in guiding the in situ backscattering Mueller matrix detection. Hence, based on the transmission Mueller matrix parameter analysis in this study, we can then apply the method and algorithm directly to in vivo backscattering skin polarimetric detection, such as dermoscopy.
We used the dual rotating retarder polarimeter to measure the Mueller matrix in this study [33]. Here, a commercial transmission microscope (L2050, Liss Optical Instrument Factory, Guangzhou, China) was upgraded to a Mueller matrix microscope, whose schematic and photo are shown in Figure 1. We added a polarization state generator (PSG) and a polarization state analyzer (PSA) to the optical path [14]. The key components of PSG and PSA are the fixed polarizers (P1 and P2, extinction ratio 1000:1, Daheng Optics, China) whose axes are placed along the horizontal direction and the rotatable quarter-wave plates (R1 and R2, Daheng Optics, China). An LED lamp (3W, 633 nm, Δλ = 20 nm, Cree, China) was adopted as the illuminant for the microscope. The PSG generates light with different polarization states to transmit through the tissue section and objective lens (Lens, Olympus, Japan). After modulated by the tissue sample, the polarization states of transmitted light are analyzed by the PSA, and the results are received and imaged by a CMOS camera (MVCA023-10UM, 1920 × 1200 pixels, Hikvision, China).
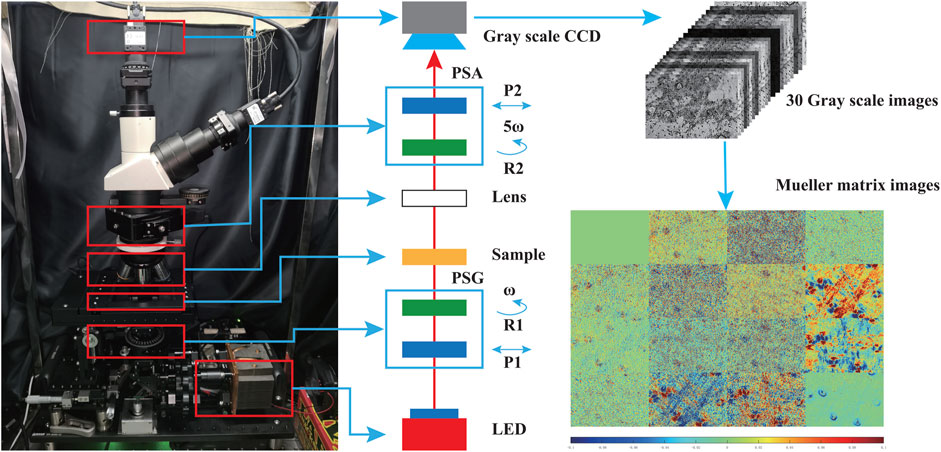
FIGURE 1. Photo and schematic of the Mueller matrix microscope; lens: objective lens; P1 and P2: polarizers; R1 and R2: quarter-wave plates; PSA: polarization state analyzer; PSG: polarization state generator. During the measurement, the two quarter-wave plates rotate with constant rates (ω for R1 and 5ω for R2).
Before the Mueller matrix measurement, we calibrated the microscope using the model based on Ref. [34] and the eigenvalue calibration method to ensure the maximum errors of the measured Mueller matrix elements are less than 1%. We used polarizers and quarter-wave plates in different directions of 0°, 45°, 90°, and 135° as the reference samples for measurement and calibrations. More details of the calibration procedure and results can be found in Ref. [35].
During the measurement, as shown in Figure 1, the two retarders (R1 and R2) rotate at constant rates, and the rotation of R2 is five times faster than that of R1. In this configuration, the two retarders are rotated harmonically and obtain 30 intensity images at discrete intervals in rotation angle. The images can be expanded in the Fourier series shown in Eq. 1, where I is the light intensity captured by the CCD each time, αn and βn are the Fourier coefficients, and ω is the rotating angle rate and set to 6° in our experiment [36]. As the rotation ratio is set to be 5:1, the Fourier expansion series are limited to 12 harmonics. There is a coefficient of 2 before nω in Eq. 1 because of the repetition of polarization elements during one complete revolution.
After getting the Fourier coefficients, the Mueller matrix elements of the sample can be obtained through the detailed procedure described in Ref. [34].
The Mueller matrix is a comprehensive description of polarization properties of turbid media and an important tool for revealing the microstructural and even nanostructural information of biomedical samples [37–40]. However, the Mueller matrix elements can be affected by multiple structures simultaneously. Thus, the physical meaning and associations with certain structural information of individual Mueller matrix elements are unclear [11–13,28]. To deal with this problem, several Mueller matrix analyzing methods have been proposed to derive groups of polarization parameters, which can reflect the specific structural characteristics of tissues. Among those methods, the Mueller matrix polar decomposition (MMPD) proposed by Lu and Chipman is widely acknowledged [23,29,41,42], while the Mueller matrix transformation (MMT) method has also shown broad biomedical application prospects [30,41,42].
Previous studies demonstrated that the MMPD and corresponding MMT parameters have a good correlation [43–45]. Thus, they can be used to reveal characteristic structural features, especially linear birefringent structures of tissue samples [25,27,28]. In this study, for quantitative analysis of skin tissue samples, we used the MMPD technique, whose basic idea is to decompose a Mueller matrix into the product of three basic 4 × 4 matrices to represent basic light-medium interaction processes, namely, depolarization (Δ), retardance (R,) and diattenuation (D) shown in Eq. 2 [29]. In Eq. 2, MD represents the diattenuation submatrix, MR represents the retardance submatrix, and MΔ represents the depolarization submatrix. In addition, D in submatrix MD is a 3 × 1 vector and can be calculated directly from the Mueller matrix: D1 equals M12, D2 equals M13, and D3 equals M14 (Di is the element of D vector, Mij is the element in i row j column of Mueller matrix). mD is 2 × 2 submatrix of MD, mR is 2 × 2 submatrix of MR and mΔ is 2 × 2 submatrix of MΔ. 0 is the 3 × 1 zero vector and PΔ is a 3 × 1 vector in MΔ. More detailed calculation processes can be referred to in [29].
Considering that the main polarization property induced by skin follicle structures is linear birefringence, we adopt the linear retardance parameter δ and its orientation parameter θ for further analysis. The two parameters can be calculated from the total retardance MR matrix as shown in Eq. 3, where a1 and a2 are the vectorial elements of retardance [31]. mR is the lower right 3 × 3 sub-matrix of MR, εijk is the Levi-Civita permutation symbol, and MR(i,j) are the elements of MR.
In a grayscale image, the regular gray value distributions of all pixels compose the image texture. Each pixel has some correlation with other pixels with a certain distance. Due to grayscale discrepancy, the spatial correlation characteristics between pixels are generated. We can obtain a series of image texture characteristic values by analyzing the discrepancy of grayscale values among the pixels. By combining the sliding window method and some prevalent image texture analysis techniques, such as the Gray Level Co-occurrence Matrix (GLCM) [46], we can obtain texture information from the Mueller matrix parameter images. Specifically, we use a sliding window with certain size on the Mueller matrix-derived parameter images to calculate the image texture parameter images, which retain both the position and image texture information [47]. The sliding window method is similar to convolution at a conceptual level. By sliding the image with a certain length and width core, we can turn the image into a series of small units for further processing. For instance, the GLCM is a square matrix, but the images are usually rectangular arrays. The sliding window method can transfer the rectangular image into a series of square images with changeable size and step size for further texture analysis.
The GLCM method proposed by Haralick et al has been widely used for texture feature extraction and image texture analysis [46,48–50]. The texture of a grayscale map is formed by repeated occurrence of different grayscale values in a certain pattern. Thus, there is a certain gray relationship between the two pixels that are separated by a distance in the image space, which is the spatial correlation between the gray values in the image. The GLCM describes texture features by calculating the spatial correlation of the image gray level. We select four representative parameters, namely, contrast, energy, correlation, and inverse different moment (IDM) for follicle structure detection.
(1) Contrast is defined as Eq. 4:
in which Ng is the pixel number of one side of the square image, p (i, j) is the relative probability of two pixels with grayscale i, j appearing on the image. The contrast parameter reflects the depth of the image texture groove.
(2) Energy is defined as Eq. 5:
The energy parameter can be obtained by summing the square values of each element in the gray level co-occurrence moment. The parameter reflects the image's gray distribution uniformity and texture fineness. If the texture in the original image changes equably, that is, the gray scale changes equably, the calculated energy has a large value.
(3) Correlation is defined as Eq. 6:
The correlation reflects the consistency of the image texture and the gray correlation between pixels. When the grayscale difference between pixels is small, the calculated correlation value is large. On the contrary, if the gray values of adjacent elements have a huge difference, the calculated correlation value is small.
(4) IDM is defined as Eq. 7:
The IDM reflects the degree of local texture change. When the gray values between pixels are equal, the minimum value of the denominator in the formula mentioned above is 1, and the calculated inverse moment is large. Therefore, a small IDM value means a large change in the image texture, while a large value shows a small change in the image's local texture.
Another image texture analysis method used in this study is the Tamura Image Processing Method (TIPM) proposed by Tamura [51]. Compared with the GLCM, the Tamura texture features are more in line with human texture visual perception. The TIPM mainly includes six texture features: coarseness, contrast, directionality, line-likeness, regularity, and roughness. Here, we mainly used the contrast feature, whose calculation procedure is shown in Eq. 8, where μ4 is the fourth-order moment about the mean and σ2 is the variance.
The skin tissue samples used in this study are the 6 μm thick, dewaxed, unstained common, and healthy mouse dorsal skin tissue sections provided by the Experimental Research Center, China Academy of Chinese Medical Sciences. We selected sagittal section samples of mouse skin tissue to obtain complete skin hair follicle information. The sagittal section surface is parallel to the skin surface, enabling better visualization of the hair follicle structure. We prepared three groups of mouse skin tissue samples as shown in Figure 2. Before Mueller matrix imaging, the skin tissue sections were evaluated by an experienced pathologist, and the locations of hair follicles were identified. The study was approved by the Ethics Committee of the China Academy of Chinese Medical Sciences.
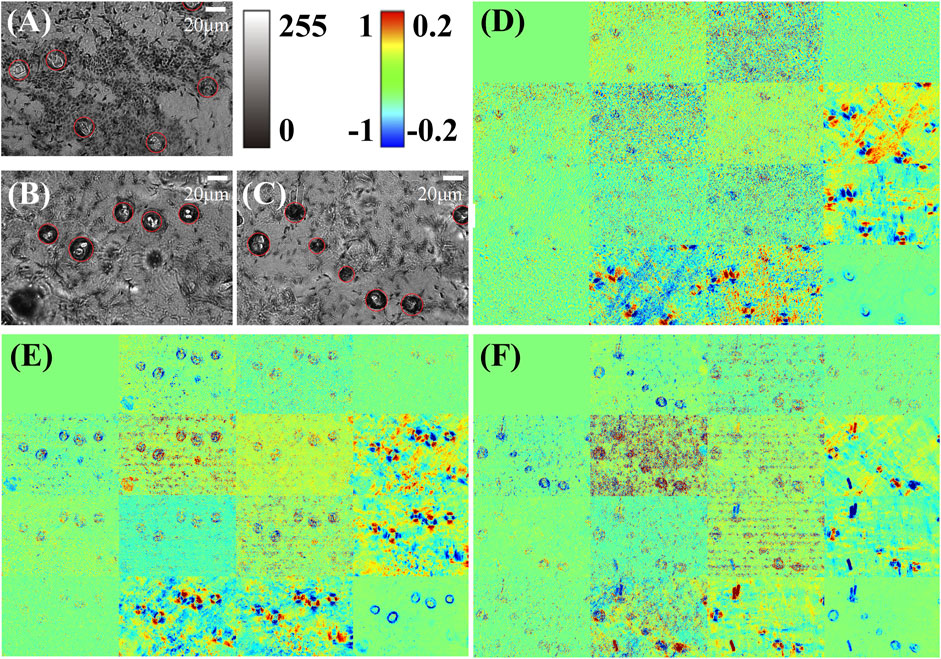
FIGURE 2. Mueller matrix microscopic imaging results of three mouse skin tissue sections and the original grayscale intensity images. (A–C) are the microscopic grayscale images of the three samples, in which the hair follicles are identified and marked by red circles. (D–F) are the Mueller matrix microscopic imaging results corresponding to (A–C). The color bar for diagonal elements is [0,1] and for other elements is [-0.2, 0.2]. All the elements are normalized by m11. Here, we obtained three tissue slices from different mice as the samples.
Figure 2 shows the imaging results of three mouse skin tissue samples. We can observe from Figures 2A–C of grayscale light-intensity images that the skin hair follicles have annulus structures as marked by the red circles. However, there are some other structures and dust that may also show similar imaging results to those of the hair follicles, for instance, in the lower left corner of (B), which can hardly be distinguished using the unpolarized intensity images, whereas it can be noticed from Figures 2D–F that the Mueller matrix elements, especially the lower right 3 × 3 elements, show characteristic intensity changes in the areas of hair follicles, suggesting the prominent linear retardance generated by the hair follicle micro- and nanostructures in the skin tissues [23,37,41].
To observe the birefringent hair follicle structures, we then calculated the MMPD parameters δ and θ of the three mouse skin tissue sections as shown in Figure 3 to represent the magnitude and orientation distribution of the linear birefringence of the sample, respectively [31]. Specifically, the MMPD δ parameter images shown in Figures 3A–C demonstrate that the hair follicles have circularly aligned structures around the center with larger linear retardance values than other skin structures. It should be mentioned that, as shown in Figure 3C, the hairs also represent strong linear retardance properties. Meanwhile, in the MMPD θ parameter images shown in Figures 3D–F, the hair follicles represent periodically changed colors, confirming the continuous orientation variations of the birefringent structures around the center of skin hair follicles. These periodic birefringent structures encircle the center of the follicle in circular distribution, and each periodicity is filled with a whole circle. Figures 3G–J also provide the zoom-in images of parameters δ and θ of two selected hair follicle regions, marked by the white squares in (A) and (B). Obviously, the values and distribution behaviors of the linear retardance induced by the characteristic microstructures can be used for hair follicle location identification. In addition, we can see that the structural integrity also contributes to retardance values, indicating that the MMPD parameters can be used as indicators for quantitative hair follicle health evaluations.
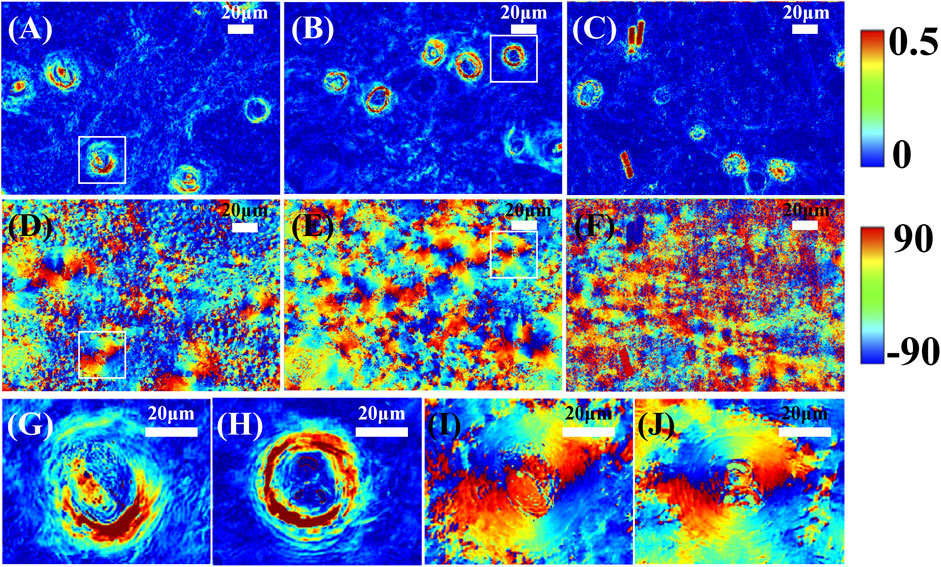
FIGURE 3. MMPD parameter θ and δ images of three mouse skin tissue sections. (A–C) are the parameter δ results. (D–F) are the corresponding parameter θ results. (G,H) show the zoom-in images of parameters δ, and (I,J) show the zoom-in images of parameter θ of two selected hair follicle regions marked by the white squares in (A,B), respectively. All the scale bars in subfigures represent 20 μm.
In Polarization staining images of skin hair follicles, we showed that the location and structure integrity information can be obtained by the MMPD parameter δ and θ images. Previously, we proposed a polarization staining method to combine different polarization parameter images into a single one to provide multi-dimensional information conveniently [52]. Here, in this study, the parameters δ and θ are projected into the HSV color space to generate polarization staining images shown in Figure 4, in which the brightness intensity encoded by parameter δ describes the linear retardance value, and the hue encoded by parameter θ shows the fast axis orientation of the linear birefringent structures. We can see from the results of all three samples shown in Figures 4A–C that the skin hair follicle's locations are clearly revealed: The larger the value of linear birefringence, the brighter the polarization staining images. Compared to the parameter θ images as Figure 3 shows, the hue weighted with the intensity images can more clearly represent the circularly distributed orientation of the hair follicles as shown in Figure 4. The results confirm that we can observe the structural features more directly using polarization staining images.
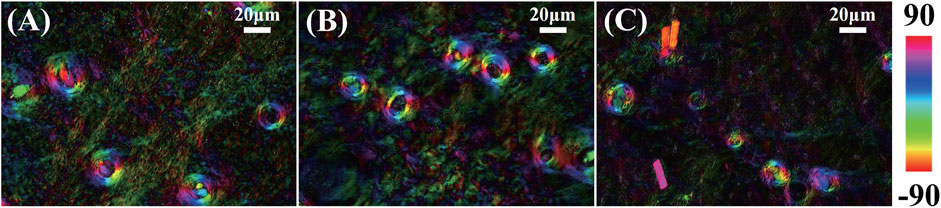
FIGURE 4. Polarization staining image of three mouse skin tissue samples, (A) sample 1, (B) sample 2, and (C) sample 3. Here, the intensity encoded by parameter δ describes the linear retardance value, and the hue encoded by parameter θ shows the fast axis orientation of the linear birefringent structures.
In previous sections, we first demonstrated that the MMPD parameter δ and θ images can be used to characterize the mouse skin hair follicle microstructures, and then we visualized hair follicle structural features by the polarization staining images based on MMPD parameters. In this section, for hair follicle location identification and quantitative structural evaluations, we apply the image segmentation method, sliding window algorithm, GLCM, and TIPM parameters [46,51] to process and analyze the polarization images.
To identify the hair follicle locations, we extract their structural features based on polarization parameter images first. Using the traditional image segmentation method of double-down sampling–binarization–etching–expanding–closing–hole filling, we can obtain the corresponding hair follicle area from the MMPD δ parameter image as Figure 5 shows. Figure 5 (D1)–(F1) are the segmentation results using original MMPD δ parameter images of three mouse skin samples shown as Figure 5 (A1)–(C1) at the reduction rate of four-fold down-sampling. The white areas are the segmented hair follicle regions whose pixel values are 1, while other regions are with pixel values of 0. We can notice that by eliminating the influence of the background noise in the polarization parameter images using a relatively high reduction rate, the location and number of the skin hair follicles can be identified using the image segmentation method. More specifically, it is expected that the size and number of the continuous areas in the images can be used to locate and count the hair follicles in the skin tissue.
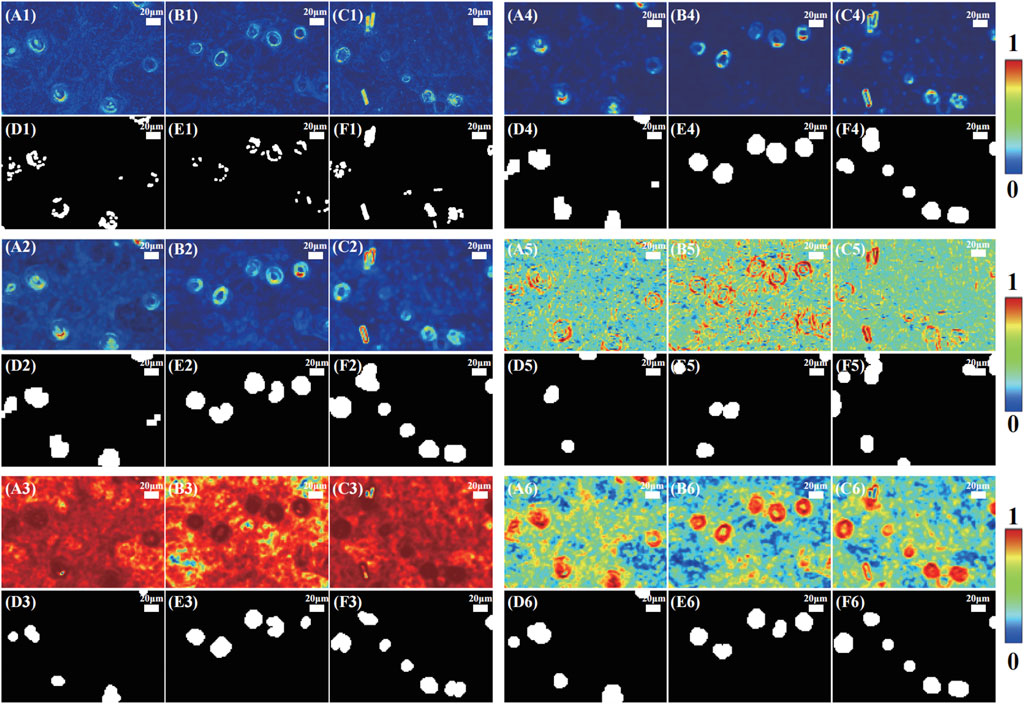
FIGURE 5. Hair follicle region segmentation results of three mouse skin tissue samples. (A1,C1) are the original MMPD δ parameter images, (D1,F1) are the corresponding segmentation results at the reduction rates of four times; (A2,C2) are the sliding window images of TIPM contrast, (D2,F2) are the corresponding segmentation results; (A3,C3) are the sliding window images of GLCM 1-energy, (D3,F3) are the corresponding segmentation results; (A4,C4) are the sliding window images of GLCM contrast, (D4,F4) are the corresponding segmentation results; (A5,C5) are the sliding window images of GLCM correlation, (D5,F5) are the corresponding segmentation results; (A6,C6) are the sliding window images of GLCM 1-IDM, (D6,F6) are the corresponding segmentation results. All the scale bars in subfigures represent 20 μm.
For better identification results, here, we also use the sliding window method proposed in our previous study to show the local texture feature of the polarization parameter images [47]. We select TIPM and GLCM parameters as introduced in Polarization staining images of skin hair follicles, which present prominent differences between hair follicles and surrounding structures in MMPD δ and θ images, as the typical texture feature parameters to show the sliding window method results. The sliding window size was set to 30 × 30 pixels, and the step size was 10 pixels. Figure 5 shows the sliding window images of TIPM contrast (A2)–(C2), GLCM 1-energy (A3)–(C3), GLCM contrast (A4)–(C4), GLCM correlation (A5)–(C5), GLCM 1-IDM (A6)–(C6), and their corresponding segmentation results after etching–expanding–closing–hole filling processes. The sliding window method used here is based on a threshold of 0.5. As shown in Figure 5, the textural parameter values in each local region were calculated to build a new 2D image according to their original spatial position. It can be noticed that compared to the segmentation results using original MMPD δ parameter images shown in Figure 5D1, F1), the sliding window method based on different textual images can help suppress the influence of background noise. Thus, the locations of hair follicle regions can be more accurately identified as shown in Figure 5. From Figure 5D1, F1, we can see that the segmentation results based on the original MMPD δ parameter images are not suitable for hair follicle location, counting, and size calculating. It is supposed that since the contrast of the original MMPD δ parameter images is low, it does not fit the threshold. Thus, using different texture analysis methods to extract image features and improve image contrast is necessary. More specifically, among all the textural parameters, the segmentation results based on TIPM contrast (A2)–(C2), GLCM 1-energy (A3)–(C3), GLCM contrast (A4)–(C4), and GLCM 1-IDM (A6)–(C6) show good identifications, and all the hair follicles can be correctly recognized through these parameters, while those based on GLCM correlation (A5)–(C5) have low accuracy. It is supposed that the GLCM correlation is too sensitive to the texture changes; thus, the results mixed with noise are unrelated to hair follicles. This leads to lower accuracy here.
After obtaining the regions of hair follicles in the mouse skin tissue samples using polarization texture parameter image segmentation, we can then quantitatively evaluate the size of the follicle structures. In this section, all the hair follicles in the original images were confirmed and manually measured by experienced researchers from China Academy of Chinese Medical Sciences. It should be pointed out that, in this study, we are trying to provide an automatic polarimetric method for the researchers, who currently use manual measurement to detect and evaluate skin hair follicles, as a screening tool. Hence, here we compare our method to that of the experienced researchers’ measurement as the reference. Figure 6 shows the comparison between manual size measurement (long axis diameter) and calculation based on different polarization texture images of 23 randomly selected hair follicles via correlation scatter plots. Here, we chose the TIPM Contrast, GLCM Contrast, GLCM 1-DIM, and GLCM 1-Energy, which show good structure identification abilities in Figure 5, to acquire the size information (long axis diameter) for hair follicle structures. Specifically, in Figure 6, the manually measured hair follicle size values were obtained from the original unpolarized intensity images, and the calculated size values were extracted based on the segmentation results of corresponding sliding window polarization texture parameter images. Figure 6 also gives the coefficient of determination (R2) and the p value between the manually measured and calculated values for each polarization parameter. From Figure 6, we can observe that the sliding window images of TIPM Contrast and GLCM 1-IDM based on the MMPD δ parameter can provide relatively accurate size estimation results, whose R2 are more than 0.25, which means their Pearson’s correlation coefficients are larger than 0.5, showing moderate correlation. Also, the p values of TIPM Contrast and GLCM 1-IDM are less than 0.01, which strengthens the correlation significance. However, the results derived from sliding window images of GLCM Contrast and GLCM 1-Energy can reach a determination coefficient of less than 0.2, indicating they may not be precise size indicators. The relatively low R2 values may have resulted from the manual measurement. In the manual measurement process, the artificial experience has a prominent impact on the final measured values. The error resulting from manual measurement would cause the measured values of hair follicles of similar size to be distributed in a large range, while the calculated values from the algorithm are relatively stable. Thus, the results obtained from TIPM Contrast and GLCM 1-IDM based on the MMPD δ parameter have a lower standard deviation than those of the measured value. This can also be seen in Figure 6 as the data points seem to be aligned along horizontal lines. Moreover, in the case of a large distribution difference, there is still a moderate correlation between measured values and calculated TIPM Contrast values and GLCM 1-IDM values, which shows the effectiveness of the two methods.
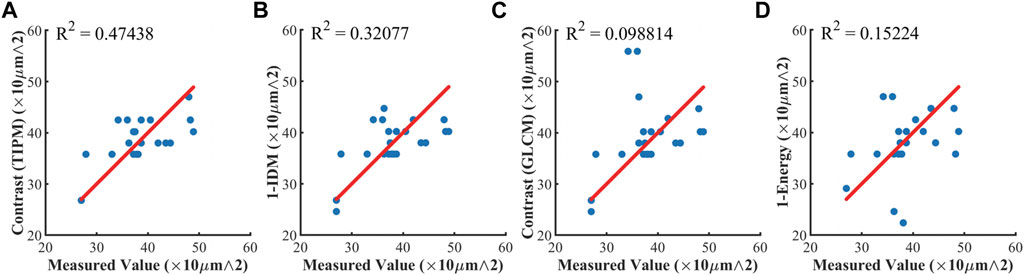
FIGURE 6. Correlation scatter plots between manually measured size value and calculated size value of 23 hair follicles for different polarization texture images. (A) TIPM contrast with p < 0.01; (B) GLCM 1-IDM with p < 0.01; (C) GLCM contrast with p > 0.05; (D) GLCM 1-Energy with p > 0.05. The red line in subfigures shows y = x, and the deviation of points from the line represents the error. The standard deviation of the measured value is 6.09. The standard deviation of TIPM contrast is 4.63. The standard deviation of GLCM 1-IDM is 4.92. The standard deviation of GLCM Contrast is 7.28. The standard deviation of GLCM 1-Energy is 6.37.
Table 1 provides the mean relative error between manually measured size and calculated size values of 23 hair follicles for polarization texture parameters TIPM Contrast, GLCM Contrast, GLCM 1-DIM, and GLCM 1-Energy. The average relative error can be used to determine accurate parameters for segmentation and quantitative evaluation of hair follicle structure. The values shown in Table 1 confirm that among the four parameters, the TIPM Contrast and GLCM 1-DIM parameters have better performance than GLCM Contrast and GLCM 1-Energy, whose mean relative errors are 25 and 24.2%, respectively. It should be noted that to achieve good hair follicle structure identification and evaluation using the TIPM or GLCM parameters, the Mueller matrix microscope should be calibrated and samples should be prepared carefully. The results provided in Table 1; Figure 6 indicate that the Mueller matrix imaging method combined with polarization image segmentation, texture analysis, and calculation is expected to realize automatically hair follicle identification, detection, and quantitative evaluation. The information provided by Mueller matrix polarimetry shows great potential in dermatological studies and applications.
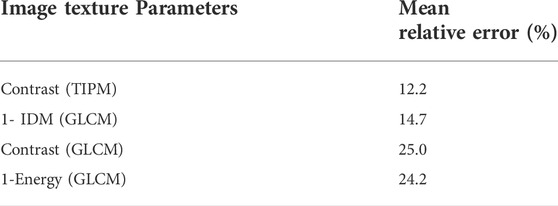
TABLE 1. Mean relative error between manually measured size value and calculated size value of 23 hair follicles for different polarization texture images.
Previously, we found that the conclusions drawn from transmission Mueller matrix microscopic imaging based on retardance parameters can also be helpful in guiding the in situ backscattering Mueller matrix detection. Hence, based on the transmission Mueller matrix parameter analysis of skin hair follicles in this study, we can next apply the method and algorithm directly to in vivo backscattering skin polarimetric detection, including the evaluation of hair follicle structures.
In this study, we proposed a quantitative technique to analyze and evaluate microstructures of skin hair follicles based on Mueller matrix transmission microscopy. First, we measured the microscopic Mueller matrices of mouse skin tissue sections and then derived the MMPD parameter δ and θ images to reveal the characteristic linear birefringence distribution induced by skin hair follicles. The results indicated that the MMPD parameters can be used to reveal the location and structural integrity of hair follicles. Then, to more clearly show the structural features of hair follicles, we applied the polarization staining method to combine δ and θ parameter images into a single one to provide multi-dimensional information. Third, for accurate hair follicle location identification and quantitative structural evaluations, we used the image segmentation method, sliding window algorithm, GLCM, and TIPM parameters together to process the Mueller matrix-derived images. It has been demonstrated that compared to the segmentation results using original MMPD δ parameter images, the sliding window method based on different textual images can help suppress the influence of background noise. Here, the parameters are chosen to achieve good and stable analyzing results. Thus, the hair follicle regions can be more correctly recognized and their locations can be more accurately identified based on the parameters. Last, for quantitative evaluation of the follicle structure sizes, we compared manual size measurement results and calculation results based on TIPM Contrast, GLCM Contrast, GLCM Contrast, and GLCM 1-Energy parameter images of mouse skin hair follicles. It was confirmed that the TIPM Contrast and GLCM 1-DIM parameters have good performance for follicle size estimation. The results shown in this study suggest that, although more studies are still needed, the technique based on Mueller matrix microscopy can realize automatically hair follicle identification, detection, and quantitative evaluation. Based on the analysis presented in this study, we believe that the backscattering Mueller matrix polarimetry combined with dermoscopy has the potential to be used for detection of hair follicle size with good accuracy. This method can also show some details of hair follicles as shown in Figure 3. Under the promotion of both, we suppose that the method proposed in this study can be used for hair follicle identification with more than 80% accuracy in real in vivo and non-contact applications. It has great potential in skin structure-related studies and clinical dermatological applications.
The raw data supporting the conclusion of this article will be made available by the authors, without undue reservation.
The animal study was reviewed and approved by the Ethics Committee of the China Academy of Chinese Medical Sciences.
YS: methodology, software, formal analysis, and writing—original draft. YSun: methodology, investigation, validation, and writing—original draft. RH: methodology, software, and formal analysis. YZ: methodology and investigation. HZ: methodology and formal analysis. ZF: investigation and formal analysis. ZO: methodology and resources. PH: methodology and resources. HH: conceptualization, methodology, writing—review and editing, and supervision. CH: conceptualization, methodology, writing—review and editing, and supervision. YW: conceptualization, methodology, resources, writing—review and editing, and supervision. HM: supervision.
This work was funded by the Fundamental Research Funds for the Central Public Welfare Research Institutes (Nos. JBGS2021007 and XTCX2021002), Shenzhen Key Fundamental Research Project (No. JCYJ20210324120012035), and the Overseas Research Cooperation Project of Tsinghua Shenzhen International Graduate School (No. HW2018005).
CH would like to thank the support of the John Fell Fund from University of Oxford, and the Junior Research Fellowship from St John's College, University of Oxford.
Author YZ was employed by Shenzhen Maidu Technology Co., Ltd.
The remaining authors declare that the research was conducted in the absence of any commercial or financial relationships that could be construed as a potential conflict of interest.
All claims expressed in this article are solely those of the authors and do not necessarily represent those of their affiliated organizations, or those of the publisher, the editors, and the reviewers. Any product that may be evaluated in this article, or claim that may be made by its manufacturer, is not guaranteed or endorsed by the publisher.
1. Kim J, Lee CW, Kim EK, Lee SJ, Park NH, Kim HS, et al. Inhibition effect of Gynura procumbens extract on UV-B-induced matrix-metalloproteinase expression in human dermal fibroblasts. J Ethnopharmacology (2011) 137:427–33. doi:10.1016/j.jep.2011.04.072
2. Shindo Y, Witt E, Han D, Epstein W, Packer L. Enzymic and non-enzymic antioxidants in epidermis and dermis of human skin. J Invest Dermatol (1994) 102:122–4. doi:10.1111/1523-1747.ep12371744
3. Gambichler T, Boms S, Stucker M, Moussa G, Kreuter A, Sand M, et al. Acute skin alterations following ultraviolet radiation investigated by optical coherence tomography and histology. Arch Dermatol Res (2005) 297:218–25. doi:10.1007/s00403-005-0604-6
4. Neerken S, Lucassen GW, Bisschop MA, Lenderink E, Nuijs TAM. Characterization of age-related effects in human skin: A comparative study that applies confocal laser scanning microscopy and optical coherence tomography. J Biomed Opt (2004) 9:274–81. doi:10.1117/1.1645795
5. Inui S, Nakajima T, Nakagawa K, Itami S. Clinical significance of dermoscopy in alopecia areata: Analysis of 300 cases. Int J Dermatol (2008) 47:688–93. doi:10.1111/j.1365-4632.2008.03692.x
6. Tosti A, Torres F. Dermoscopy in the diagnosis of hair and scalp disorders. Actas Dermo-Sifiliograficas (2009) 100:114–9. doi:10.1016/s0001-7310(09)73176-x
7. Tosti A, Whiting D, Iorizzo M, Pazzaglia M, Misciali C, Vincenzi C, et al. The role of scalp dermoscopy in the diagnosis of alopecia areata incognita. J Am Acad Dermatol (2008) 59:64–7. doi:10.1016/j.jaad.2008.03.031
8. Deloche C, de Lacharriere O, Misciali C, Piraccini BM, Vincenzi C, Bastien P, et al. Histological features of peripilar signs associated with androgenetic alopecia. Arch Dermatol Res (2004) 295:422–8. doi:10.1007/s00403-003-0447-y
9. Sun Q, Lee W, Mohri Y, Takeo M, Lim CH, Xu X, et al. A novel mouse model demonstrates that oncogenic melanocyte stem cells engender melanoma resembling human disease. Nat Commun (2019) 10:5023. doi:10.1038/s41467-019-12733-1
10. Hussain R, Jávorfi T, Siligardi GCD. CD imaging at high spatial resolution at diamond B23 beamline: Evolution and applications. Front Chem (2021) 9:616928. doi:10.3389/fchem.2021.616928
11. Ghosh N, Vitkin IA. Tissue polarimetry: Concepts, challenges, applications, and outlook. J Biomed Opt (2011) 16:110801. doi:10.1117/1.3652896
12. Qi J, Elson DS. Mueller polarimetric imaging for surgical and diagnostic applications: A review. J Biophotonics (2017) 10:950–82. doi:10.1002/jbio.201600152
13. Tuchin VV. Polarized light interaction with tissues. J Biomed Opt (2016) 21:071114. doi:10.1117/1.Jbo.21.7.071114
14. Wang Y, He H, Chang J, Zeng N, Liu S, Li M, et al. Differentiating characteristic microstructural features of cancerous tissues using Mueller matrix microscope. Micron (2015) 79:8–15. doi:10.1016/j.micron.2015.07.014
15. Du E, He H, Zeng N, Sun M, Guo Y, Wu J, et al. Mueller matrix polarimetry for differentiating characteristic features of cancerous tissues. J Biomed Opt (2014) 19:076013. doi:10.1117/1.Jbo.19.7.076013
16. Dubreuil M, Babilotte P, Martin L, Sevrain D, Rivet S, Le Grand Y, et al. Mueller matrix polarimetry for improved liver fibrosis diagnosis. Opt Lett (2012) 37:1061–3. doi:10.1364/ol.37.001061
17. Wang Y, He H, Chang J, He C, Liu S, Li M, et al. Mueller matrix microscope: A quantitative tool to facilitate detections and fibrosis scorings of liver cirrhosis and cancer tissues. J Biomed Opt (2016) 21:071112. doi:10.1117/1.Jbo.21.7.071112
18. Chue-Sang J, Bai Y, Stoff S, Straton D, Ramaswamy S, Ramella-Roman JC. Use of combined polarization-sensitive optical coherence tomography and Mueller matrix imaging for the polarimetric characterization of excised biological tissue. J Biomed Opt (2016) 21:071109. doi:10.1117/1.Jbo.21.7.071109
19. Pierangelo A, Nazac A, Benali A, Validire P, Cohen H, Novikova T, et al. Polarimetric imaging of uterine cervix: A case study. Opt Express (2013) 21:14120–30. doi:10.1364/oe.21.014120
20. Rehbinder J, Haddad H, Deby S, Teig B, Nazac A, Novikova T, et al. Ex vivo mueller polarimetric imaging of the uterine cervix: A first statistical evaluation. J Biomed Opt (2016) 21:071113. doi:10.1117/1.Jbo.21.7.071113
21. Ivanov D, Dremin V, Genova T, Bykov A, Novikova T, Ossikovski R, et al. Polarization-based histopathology classification of ex vivo colon samples supported by machine learning. Front Phys (2022) 9:814787. doi:10.3389/fphy.2021.814787
22. He C, Chang J, Hu Q, Wang J, Antonello J, He H, et al. Complex vectorial optics through gradient index lens cascades. Nat Commun (2019) 10:4264. doi:10.1038/s41467-019-12286-3
23. Dong Y, Qi J, He H, He C, Liu S, Wu J, et al. Quantitatively characterizing the microstructural features of breast ductal carcinoma tissues in different progression stages by Mueller matrix microscope. Biomed Opt Express (2017) 8:3643–55. doi:10.1364/boe.8.003643
24. Dong Y, Wan J, Si L, Meng Y, Liu S, Dong YM, He HH, et al. Deriving polarimetry feature parameters to characterize microstructural features in histological sections of breast tissues. IEEE Trans Biomed Eng (2021) 68:881–92. doi:10.1109/tbme.2020.3019755
25. Liu T, Lu M, Chen B, Zhong Q, Li J, He H, et al. Distinguishing structural features between Crohn's disease and gastrointestinal luminal tuberculosis using Mueller matrix derived parameters. J Biophotonics (2019) 12:201900151. doi:10.1002/jbio.201900151
26. Borovkova M, Bykov A, Popov A, Pierangelo A, Novikova T, Pahnke J, et al. Evaluating beta-amyloidosis progression in Alzheimer's disease with Mueller polarimetry. Biomed Opt Express (2020) 11:4509–19. doi:10.1364/boe.396294
27. Novikova T, Meglinski I, Ramella-Roman JC, Tuchin VV. Special section guest editorial: Polarized light for biomedical applications. J Biomed Opt (2016) 21:071001. doi:10.1117/1.Jbo.21.7.071001
28. Ramella-Roman JC, Saytashev I, Piccini M. A review of polarization-based imaging technologies for clinical and preclinical applications. J Opt (2020) 22:123001. doi:10.1088/2040-8986/abbf8a
29. Lu SY, Chipman RA. Interpretation of Mueller matrices based on polar decomposition. J Opt Soc Am A (1996) 13:1106–13. doi:10.1364/josaa.13.001106
30. He H, Zeng N, Du E, Guo Y, Li D, Liao R, et al. A possible quantitative Mueller matrix transformation technique for anisotropic scattering media/Eine mögliche quantitative Müller-Matrix-Transformations-Technik für anisotrope streuende Medien. Photon Lasers Med (2013) 2:129–37. doi:10.1515/plm-2012-0052
31. Ghosh N, Wood MFG, Vitkin IA. Mueller matrix decomposition for extraction of individual polarization parameters from complex turbid media exhibiting multiple scattering, optical activity, and linear birefringence. J Biomed Opt (2008) 13:044036. doi:10.1117/1.2960934
32. Liu T, Sun T, He H, Liu S, Dong Y, Wu J. Comparative study of the imaging contrasts of Mueller matrix derived parameters between transmission and backscattering polarimetry. Biomed Opt Express (2018) 9:4413–28. doi:10.1364/boe.9.004413
33. Goldstein DH. Mueller matrix dual-rotating retarder polarimeter. Appl Opt (1992) 31:6676–83. doi:10.1364/ao.31.006676
34. Goldstein DH, Chipman RA. Error analysis of a Mueller matrix polarimeter. J Opt Soc Am A (1990) 7:693–700. doi:10.1364/josaa.7.000693
35. Zhou J, He H, Chen Z, Wang Y, Ma H. Modulus design multiwavelength polarization microscope for transmission Mueller matrix imaging. J Biomed Opt (2018) 23:1. doi:10.1117/1.Jbo.23.1.016007
36. Azzam RMA. Photopolarimetric measurement of the Mueller matrix by Fourier analysis of a single detected signal. Opt Lett (1978) 2:148–50. doi:10.1364/ol.2.000148
37. Sun M, He H, Zeng N, Du E, Guo Y, Liu S, et al. Characterizing the microstructures of biological tissues using Mueller matrix and transformed polarization parameters. Biomed Opt Express (2014) 5:4223–34. doi:10.1364/boe.5.004223
38. He C, He H, Chang J, Dong Y, Liu S, Zeng N, et al. Characterizing microstructures of cancerous tissues using multispectral transformed Mueller matrix polarization parameters. Biomed Opt Express (2015) 6:2934–45. doi:10.1364/boe.6.002934
39. Chen D, Zeng N, Xie Q, He H, Tuchin VV, Ma H. Mueller matrix polarimetry for characterizing microstructural variation of nude mouse skin during tissue optical clearing. Biomed Opt Express (2017) 8:3559–70. doi:10.1364/boe.8.003559
40. Cruz CAV, Shaban HA, Kress A, Bertaux N, Monneret S, Mavrakis M, et al. Quantitative nanoscale imaging of orientational order in biological filaments by polarized superresolution microscopy. Proc Natl Acad Sci U S A (2016) 113:E820–8. doi:10.1073/pnas.1516811113
41. He H, Liao R, Zeng N, Li P, Chen Z, Liu X, et al. Mueller matrix polarimetry-an emerging new tool for characterizing the microstructural feature of complex biological specimen. J Lightwave Technol (2019) 37:2534–48. doi:10.1109/jlt.2018.2868845
42. He C, He H, Chang J, Chen B, Ma H, Booth MJ. Polarisation optics for biomedical and clinical applications: A review. Light Sci Appl (2021) 10:194. doi:10.1038/s41377-021-00639-x
43. Iqbal M, Ahmad I, Khaliq A, Khan S. Comparative study of Mueller matrix transformation and polar decomposition for optical characterization of turbid media. Optik (2020) 224:165508. doi:10.1016/j.ijleo.2020.165508
44. Chen B, Lan Y, Zhai H, Deng L, He H, Mao H, et al. Comparative study of modified Mueller matrix transformation and polar decomposition parameters for transmission and backscattering tissue polarimetries. Appl Sci (Basel) (2021) 11:10416. doi:10.3390/app112110416
45. Khaliq A, Ashraf S, Gul B, Ahmad I. Comparative study of 3 x 3 Mueller matrix transformation and polar decomposition. Opt Commun (2021) 485:126756. doi:10.1016/j.optcom.2021.126756
46. Haralick RM, Shanmugam K, Dinstein I. Textural features for image classification. IEEE Trans Syst Man Cybernetics SMC3 (1973) 1973:610–21. doi:10.1109/tsmc.1973.4309314
47. Shen Y, Huang R, He H, Liu S, Dong Y, Wu J, et al. Comparative study of the influence of imaging resolution on linear retardance parameters derived from the Mueller matrix. Biomed Opt Express (2021) 12:211–25. doi:10.1364/boe.410989
48. Haralick RM. Statistical and structural approaches to texture. Proc IEEE (1979) 67:786–804. doi:10.1109/proc.1979.11328
49. Carpenter AE, Jones TR, Lamprecht MR, Clarke C, Kang I, Friman O, et al. CellProfiler: Image analysis software for identifying and quantifying cell phenotypes. Genome Biol (2006) 7:R100–11. doi:10.1186/gb-2006-7-10-r100
50. Yilmaz A, Javed O, Shah M. Object tracking: A survey. ACM Comput Surv (2006) 38:13. doi:10.1145/1177352.1177355
51. Tamura H, Mori S, Yamawaki T. Textural features corresponding to visual perception. IEEE Trans Syst Man Cybern (1978) 8:460–73. doi:10.1109/tsmc.1978.4309999
Keywords: Mueller matrix, polarization imaging, polarization staining, hair follicle, image texture
Citation: Shi Y, Sun Y, Huang R, Zhou Y, Zhai H, Fan Z, Ou Z, Huang P, He H, He C, Wang Y and Ma H (2022) A quantitative technique to analyze and evaluate microstructures of skin hair follicles based on mueller matrix polarimetry. Front. Phys. 10:847656. doi: 10.3389/fphy.2022.847656
Received: 05 January 2022; Accepted: 01 September 2022;
Published: 23 September 2022.
Edited by:
Bodo Wilts, University of Salzburg, AustriaReviewed by:
Nirmal Mazumder, Manipal Academy of Higher Education, IndiaCopyright © 2022 Shi, Sun, Huang, Zhou, Zhai, Fan, Ou, Huang, He, He, Wang and Ma. This is an open-access article distributed under the terms of the Creative Commons Attribution License (CC BY). The use, distribution or reproduction in other forums is permitted, provided the original author(s) and the copyright owner(s) are credited and that the original publication in this journal is cited, in accordance with accepted academic practice. No use, distribution or reproduction is permitted which does not comply with these terms.
*Correspondence: Honghui He, aGUuaG9uZ2h1aUBzei50c2luZ2h1YS5lZHUuY24=; Chao He, Y2hhby5oZUBlbmcub3guYWMudWs=; Yi Wang, cHJvZi53YW5neWlAZm94bWFpbC5jb20=
†These authors have contributed equally to this work
Disclaimer: All claims expressed in this article are solely those of the authors and do not necessarily represent those of their affiliated organizations, or those of the publisher, the editors and the reviewers. Any product that may be evaluated in this article or claim that may be made by its manufacturer is not guaranteed or endorsed by the publisher.
Research integrity at Frontiers
Learn more about the work of our research integrity team to safeguard the quality of each article we publish.