- 1State Key Laboratory of Quantum Optics and Quantum Optics Devices, Institute of Laser Spectroscopy, Shanxi University, Taiyuan, China
- 2Collaborative Innovation Center of Extreme Optics, Shanxi University, Taiyuan, China
We report a scheme for enhancing microwave electric field measurement by cavity-assisted Rydberg electromagnetically induced transparency in the 87Rb coherent atomic system. The vacuum Rabi splitting appears when the probe field is strongly coupled with intracavity atoms. The cavity-assisted electromagnetically induced transparency with dual-peak profile is observed as a strong coupling laser is further introduced into the optical ring cavity. The optimal atomic density, resulting in an appropriate vacuum Rabi splitting interval and cavity-assisted electromagnetically induced transparency amplitude, is determined for the coupling effect criterion of the probe field and intracavity atoms. Finally, the cavity-assisted electromagnetically induced transparency is employed to accurately measure the microwave electric field strength, and a measurement sensitivity factor of about 2 is improved owing to an enhanced photon–atom interaction. This study is beneficial for the development of compact, broadband, and self-calibrating microwave receivers.
1 Introduction
Atom-based measurement serves as a calibration standard for measuring time, length, and other physical quantities [1–3] owing to its advantages of reproducibility, accuracy, and stability [4–6]. Rydberg atoms [7], as a perfect candidate with large transition dipole moments and strong interatomic interactions, tend to be used for field sensors in microwave measurement [3, 8], terahertz communication [9–11], and terahertz imaging [12, 13]. The sensitivity of microwave electric field (E-field) measurement based on the Rydberg atoms is an ongoing pursuit in recent years [3, 8, 14–17].
The microwave E-field measurement based on Rydberg atoms is realized by an electromagnetically induced transparency (EIT) scheme [18], coupling the ground state to the Rydberg state with an intermediate state. In these cases, the frequency interval of the Autler–Townes (AT) splitting indicates the strength of the microwave E-field, which drives the adjacent Rydberg levels [3]. Several mechanisms are proposed to improve the measurement sensitivity. The spectral resolution is improved by appropriate microwave frequency detuning [15], the optimal geometry structure of vapor cell [16], and adding an auxiliary field [17, 19]. The spectral signal-to-noise ratio (SNR) is also effectively improved by modulation technology [10, 20] and heterodyne detection [18].
In an alternative way, the optical ring cavity can effectively enhance the interaction between atoms and photons through multiple oscillations of the photons in the cavity, which provides a better platform for atom-based measurement [21–24]. Strong interaction plays an important role when intracavity atoms are collectively coupled with the probe field, which leads to the splitting of the normal cavity mode, and referred as vacuum Rabi splitting (VRS) [25]. Noted that the strong coupling effect between intracavity atoms and the probe field is usually used to study the normal mode splitting of low excite state atoms [26–28], while Rydberg atoms are less involved. Intracavity Rydberg atoms, whose collective effect is greatly enhanced, are considered as a candidate for microwave E-field measurement. The enhanced detection sensitivity of weak microwave E-field with intracavity Rydberg atoms has been investigated in theory [29–31]. Both the effects of intracavity Rydberg EIT, intracavity anomalous dispersion and the collective Rabi splitting are calculated and simulated for the microwave E-field measurement, which can greatly improve the measurement sensitivity, while there are no reports of measuring the weak microwave E-field by intracavity Rydberg atoms in experiment to our best knowledge.
In this study, we performed the microwave E-field measurement by the cavity-assisted electro magnetically induced transparency (CAEIT) method in a 87Rb atomic system. The intracavity atoms are strongly coupled with the probe field, which results in a VRS. CAEIT with a dual-peak profile is induced in the optical ring cavity with a strong coupling laser field. The effects of the atomic density on the VRS splitting and CAEIT amplitude are discussed in detail, which are used for the coupling effect criterion of the probe field and intracavity atoms. To evaluate the influence of the coupling laser, the amplitude and FWHM of the CAEIT peak are investigated by changing the coupling laser power. Finally, the CAEIT method is employed to accurately measure the microwave E-field strength. This study paves the way for building a high sensitivity portable sensor and offers a platform for achieving a compact receiver.
2 Experimental Setup
The relevant atomic energy levels configuration employed in this experiment is shown in Figure 1A. A weak probe field (red) cyclically oscillates in the optical ring cavity to drive the transition from the ground state 5S1/2 to the excited state 5P3/2, and a strong coupling field (blue) couples the excited state 5P3/2 to the Rydberg state 56D5/2. Then the ladder-type three-level EIT is dressed by a microwave field, which drives the adjacent Rydberg transition of 56D5/2–57P3/2.
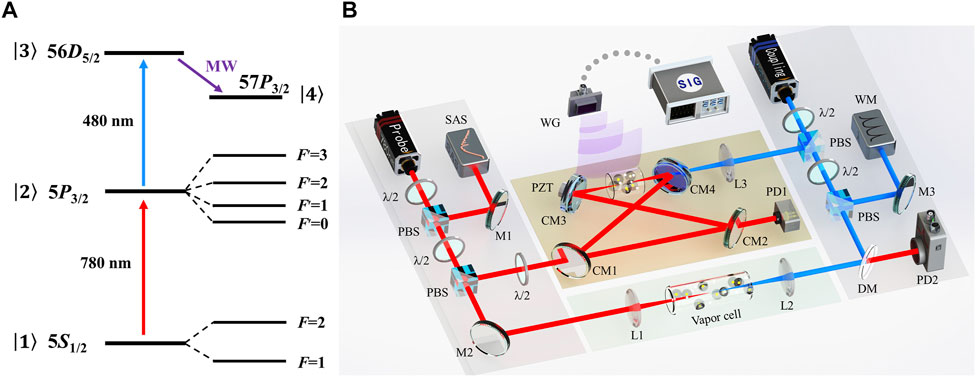
FIGURE 1. (A) Relevant energy levels of 87Rb atoms. (B) Experimental setup. λ/2, half-wave plate; M, mirror; CM, cavity mirror; DM, dichroic mirror; L, lens; AOM, acousto-optic modulator; PD, photodiode; SAS, saturation absorption spectroscopy; WM, wavemeter; SIG, signal generator; PZT, piezo-electric transducer; PBS, polarization beam splitter; WG, waveguide.
Figure 1B shows the sketch of the experimental setup. The probe laser is provided by a diode laser (DL pro, Toptica), and the frequency is scanned over the 87Rb 5S1/2(F = 2) - 5P3/2 transition, which is divided by the combinations of half-wave plates and polarization beam splitters. A weak beam is used to obtain the saturation absorption spectroscopy for the frequency reference. The main beam is injected into the optical ring cavity via CM1 and circulates in the cavity as the enhanced-probe field. The coupling laser is provided by a frequency-doubled amplified diode laser (DLC TA-SHG pro, Toptica) at 480 nm, which is tuned to excite the atoms from 5P3/2 to 56D5/2 transition. The coupling beam is also divided by other combinations of half-wave plates and polarization beam splitters. The main beam is focused by L3 with a focal length of 200 mm and injected into the cavity through CM4. A wavemeter (WS-7, HighFinesse) is used to monitor the laser frequency through a weak beam. A reference spectrum recorded by PD2 is also constructed by the interaction of an additional probe and coupling beams in another rubidium vapor cell to ensure the laser fields frequencies meet the two-photon resonance condition.
The optical ring cavity is composed of four cavity mirrors, including two flat mirrors (CM1 and CM2) and two planoconcave mirrors (CM3 and CM4) with a 100 mm radius of curvature. The transmissivity of the input (CM1) and output (CM2) mirrors are all about 1.5% at 780 nm. CM3 and CM4 have high reflectivity at 780 nm, and the transmissivity of CM4 is about 90% at 480 nm. Mirrors CM3 and CM4 are separated by approximately 105 mm. The total cavity length is approximately 500 mm and precisely adjusted by a piezo-electric transducer (PZT) mounted on the CM3. The corresponding free spectral range is about 0.6 GHz. A weak beam leaked from CM2 recorded by PD1 is used to monitor the cavity mode when the probe beam is injected into the optical ring cavity. The finesse of the empty cavity is about 130. It is reduced to about 30 due to surface reflection losses when a cylindrical Rb vapor cell (a length of 50 mm and a diameter of 25 mm) is placed at the center of CM3 and CM4.
The microwave field with 12.007 GHz, corresponding to the Rydberg transition from 56D5/2 to 57P3/2, is provided by a signal source (Rohde & Schwarz, SMB100A), and then it irradiates to the vapor cell through a rectangular waveguide. The rectangular waveguide is beneficial for the weak field and near-field measurement owing to the simple structure and a small radiation range. It is placed 3 cm away from the vapor cell to reduce the influence of stray fields, and the propagation direction is perpendicular to those of the probe and coupling beams. The probe laser, coupling laser, and the microwave field are all linear polarization.
3 Results and Discussion
The cavity transmission of the probe laser is obtained by scanning the probe laser frequency as shown in Figure 2. Among them, Figure 2A is the cavity transmission signal when the vapor cell is introduced into the optical ring cavity at room temperature; the asymmetry of the cavity transmission is due to the depolarization effect of the vapor cell. The incident probe laser power before M1 is fixed at 190 μW, and the power at the entrance of the vapor cell is about 2.8 μW due to the low transmissivity of the cavity mirrors. The FWHM of cavity transmission is about 22 MHz. As the atomic density increases, the VRS of cavity transition appears. To obtain the symmetrical VRS, the cavity length is precisely adjusted by the PZT-mounted mirror to match the atomic resonant frequency of 5S1/2(F = 2)–5P3/2(F′ = 3) hyperfine transition, which is shown in Figure 2B. The VRS interval is determined by coupling strength g (g =
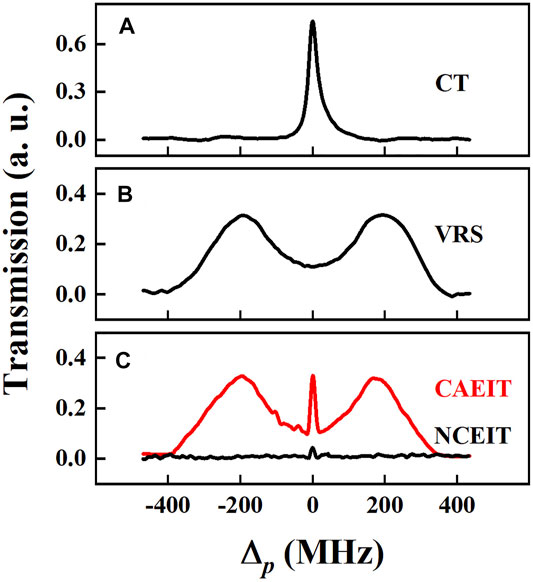
FIGURE 2. (A) Cavity transmission (CT) as a function of the probe frequency detuning (Δp) from the 87Rb 5S1/2(F = 2)–5P3/2(F′ = 3) resonant transition when the vapor cell is placed into the optical ring cavity. (B) VRS without coupling laser. (C) Non-resonant cavity EIT (NCEIT) (black) and CAEIT (red) under consistent experimental parameters. The curve lines of VRS, CAEIT, and NCEIT are all expanded by 12 times to give a clear visual contrast.
The atomic absorption and dispersion have a great influence on the transmission properties of the optical cavity, which is reflected in the VRS interval (blue diamonds) and CAEIT amplitude (black dots), as shown in Figure 3. The powers of the probe and coupling lasers at each end of the optical cavity are 190 μW and 25 mW, respectively. It can be seen that the VRS interval increases as atomic density increases, which is precisely controlled by changing the temperature of vapor. The VRS interval (ΔVRS) can be expressed as ΔVRS = 2
where T and R are the transmissivity and reflectivity of the cavity mirrors, respectively; κ = exp(-ωplIm[χ]/c) is the intracavity absorption; L and l are the length of optical ring cavity and vapor cell, respectively; Δ is the detuning of the input probe field from the cavity resonance; and χ is the atomic susceptibility obtained by solving density-matrix equations in the steady-state condition, as follows:
where ρ0 is the atomic density; γij is the decay of atomic state; ℏ is the Planck’s constant; Δp and Δc are frequency detunings of the probe and coupling lasers from their resonant frequencies, respectively; and Ωc is the Rabi frequency of the coupling field. The red lines are the corresponding theoretical fittings by Eq. 1, which are in good agreement with the experimental results. Therefore, the atomic density of ∽ 1.97 × 1011 cm−3 is selected as an ideal condition to balance the VRS interval and CAEIT amplitude.
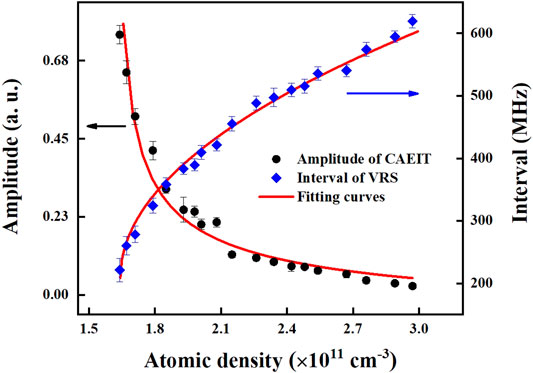
FIGURE 3. VRS interval and CAEIT amplitude versus atomic density. The blue diamonds represent the interval of VRS, the black dots are the amplitude of CAEIT, and the red lines are the results of theoretical fitting.
Coupling laser power also plays an important role in CAEIT, which is studied in Figure 4. The inset is the contour plots of the CAEIT as a function of Δp with different Pc. The white dot lines are the trajectories of two VRS peaks and the black arrow represents the transmission peak of 5S1/2–56D5/2 transition. It can be found that the frequency interval of VRS becomes larger as coupling laser power increases [23]. The relationship between the VRS interval (ΔVRS) and coupling laser Rabi frequency (Ωc) is ΔVRS = 2
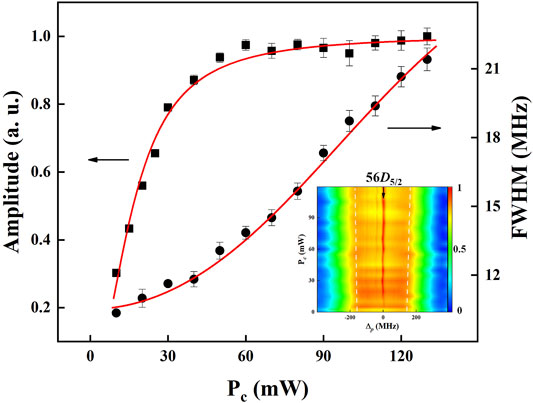
FIGURE 4. Dependences of the amplitude (squares) and the FWHM (dots) of CAEIT on the coupling laser power (Pc). The red lines are the results of theoretical fitting. The inset is the contour plots of the corresponding CAEIT as a function of Δp with different Pc. The red area pointed by the black arrow in the inset represents the peak position of 5S1/2–56D5/2 transition, and the white lines are the trajectory of the two VRS peaks.
The microwave E-field (E) measurement based on the Rydberg atoms is carried out by measuring the AT splitting interval (Δf) of EIT when the microwave field is applied, which can be expressed as Δf =
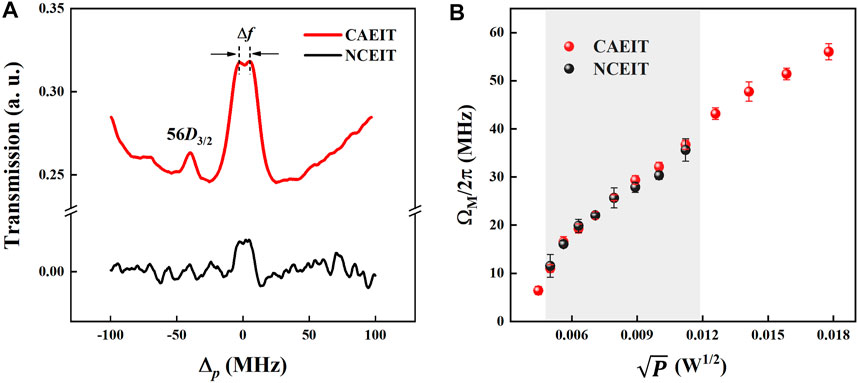
FIGURE 5. (A) NCEIT (black) and CAEIT (red) when the square root of microwave field power
When the microwave field with 12.007 GHz is applied to the atomic system, the AT splitting interval of NCEIT (black) and CAEIT (red) with different
4 Conclusion
In conclusion, we propose a method of enhanced microwave E-field measurement via CAEIT. The VRS is observed by the strong coupling between intracavity atoms and the probe field. CAEIT with a dual-peak profile is induced when a strong coupling laser is further introduced into the optical ring cavity. The effects of the atomic density on VRS interval and CAEIT peaks’ intensities are studied for the coupling effect criterion of intracavity atoms and the probe field. The amplitude and FWHM of CAEIT are also investigated by changing the coupling laser power to evaluate the influence of coupling laser. Finally, the CAEIT method is used to measure the microwave E-field, the measurement sensitivity is improved about 2 times compared with the NCEIT method. This study is helpful for enhancing the interaction of atoms and photons, and contributes to design the compact and portable microwave sensor.
Data Availability Statement
The original contributions presented in the study are included in the article/Supplementary Material; further inquiries can be directed to the corresponding authors.
Author Contributions
SL was the main author and responsible for the first draft of the manuscript. JY and LW explained the results and provided suggestions to improve the manuscript. JY, LW, LX, and SJ have provided support with the experimental setup, analysis, and interpretation of results. All authors provided review and comment on the subsequent versions of the manuscript, and approved the final manuscript.
Funding
This work was supported by the NSFC (Grants Nos. 61 875 112, 62 075 121), the Program for Sanjin Scholars of Shanxi Province, Key Research and Development Program of Shanxi Province for International Cooperation (Grant No. 201803D421034), Research Project Supported by Shanxi Scholarship Council of China (Grant No. 2020-073), and the Fund for Shanxi “1331 Project”.
Conflict of Interest
The authors declare that the research was conducted in the absence of any commercial or financial relationships that could be construed as a potential conflict of interest.
Publisher’s Note
All claims expressed in this article are solely those of the authors and do not necessarily represent those of their affiliated organizations, or those of the publisher, the editors, and the reviewers. Any product that may be evaluated in this article, or claim that may be made by its manufacturer, is not guaranteed or endorsed by the publisher.
References
1. Ludlow AD, Boyd MM, Ye J, Peik E, Schmidt PO Optical Atomic Clocks. Rev Mod Phys (2015) 87:637–701. doi:10.1103/RevModPhys.87.637
2. Parker RH, Yu C, Zhong W, Estey B, Müller H Measurement of the fine-structure Constant as a Test of the Standard Model. Science (2018) 360:191–5. doi:10.1126/science.aap7706
3. Sedlacek JA, Schwettmann A, Kübler H, Löw R, Pfau T, Shaffer JP Microwave Electrometry with Rydberg Atoms in a Vapour Cell Using Bright Atomic Resonances. Nat Phys (2012) 8:819–24. doi:10.1038/nphys2423
4. Yuan J, Zhang H, Wu C, Wang L, Xiao L, Jia S Tunable Optical Vortex Array in a Two-Dimensional Electromagnetically Induced Atomic Lattice. Opt Lett (2021) 46:4184–7. doi:10.1364/OL.432036
5. Huang P-W, Tang B, Chen X, Zhong J-Q, Xiong Z-Y, Zhou L, et al. Accuracy and Stability Evaluation of the 85Rb Atom Gravimeter WAG-H5-1 at the 2017 International Comparison of Absolute Gravimeters. Metrologia (2019) 56:045012. doi:10.1088/1681-7575/ab2f01
6. Geiger R, Landragin A, Merlet S, Pereira Dos Santos F High-accuracy Inertial Measurements with Cold-Atom Sensors. AVS Quan Sci. (2020) 2:024702. doi:10.1116/5.0009093
7. Gallagher TF. Rydberg Atoms. In: Cambridge Monographs on Atomic, Molecular and Chemical Physics. Cambridge: Cambridge University Press (1994). doi:10.1017/CBO9780511524530
8. Holloway CL, Simons MT, Kautz MD, Haddab AH, Gordon JA, Crowley TP A Quantum-Based Power Standard: Using Rydberg Atoms for a SI-Traceable Radio-Frequency Power Measurement Technique in Rectangular Waveguides. Appl Phys Lett (2018) 113:094101. doi:10.1063/1.5045212
9. Song Z, Liu H, Liu X, Zhang W, Zou H, Zhang J, et al. Rydberg-atom-based Digital Communication Using a Continuously Tunable Radio-Frequency Carrier. Opt Express (2019) 27:8848–57. doi:10.1364/OE.27.008848
10. Meyer DH, Cox KC, Fatemi FK, Kunz PD Digital Communication with Rydberg Atoms and Amplitude-Modulated Microwave fields. Appl Phys Lett (2018) 112:211108. doi:10.1063/1.5028357
11. An W, Wang H, Luo Y Dual-band Antenna Integrated with Solar Cells for Wlan Applications. Front Phys (2021) 9:775214. doi:10.3389/fphy.2021.775214
12. Fan HQ, Kumar S, Daschner R, Kübler H, Shaffer JP Subwavelength Microwave Electric-Field Imaging Using Rydberg Atoms inside Atomic Vapor Cells. Opt Lett (2014) 39:3030–3. doi:10.1364/OL.39.003030
13. Yuan J, Dong S, Wu C, Wang L, Xiao L, Jia S Optically Tunable Grating in a V+Ξ Configuration Involving a Rydberg State. Opt Express (2020) 28:23820–8. doi:10.1364/OE.400618
14. Simons MT, Gordon JA, Holloway CL, Anderson DA, Miller SA, Raithel G Using Frequency Detuning to Improve the Sensitivity of Electric Field Measurements via Electromagnetically Induced Transparency and Autler-Townes Splitting in Rydberg Atoms. Appl Phys Lett (2016) 108:174101. doi:10.1063/1.4947231
15. Fan HQ, Kumar S, Kübler H, Shaffer JP Dispersive Radio Frequency Electrometry Using Rydberg Atoms in a Prism-Shaped Atomic Vapor Cell. J Phys B: Mol Opt Phys (2016) 49:104004. doi:10.1088/0953-4075/49/10/104004
16. Kumar S, Fan H, Kübler H, Sheng J, Shaffer JP Atom-based Sensing of Weak Radio Frequency Electric fields Using Homodyne Readout. Sci Rep (2017) 7:42981. doi:10.1038/srep42981
17. Jing M, Hu Y, Ma J, Zhang H, Zhang L, Xiao L, et al. Atomic Superheterodyne Receiver Based on Microwave-Dressed Rydberg Spectroscopy. Nat Phys (2020) 16:911–5. doi:10.1038/s41567-020-0918-5
18. Deng L, Cong L, Chen A-X Electromagnetically Induced Transparency in Rydberg Atomic Medium. IOP Conf Ser Mater Sci Eng (2018) 322:022008. doi:10.1088/1757-899x/322/2/022008
19. Jia F-D, Liu X-B, Mei J, Yu Y-H, Zhang H-Y, Lin Z-Q, et al. Span Shift and Extension of Quantum Microwave Electrometry with Rydberg Atoms Dressed by an Auxiliary Microwave Field. Phys Rev A (2021) 103:063113. doi:10.1103/PhysRevA.103.063113
20. Kumar S, Fan H, Kübler H, Jahangiri AJ, Shaffer JP Rydberg-atom Based Radio-Frequency Electrometry Using Frequency Modulation Spectroscopy in Room Temperature Vapor Cells. Opt Express (2017) 25:8625–37. doi:10.1364/OE.25.008625
21. Lukin MD, Fleischhauer M, Scully MO, Velichansky VL Intracavity Electromagnetically Induced Transparency. Opt Lett (1998) 23:295–7. doi:10.1364/OL.23.000295
22. Wang H, Goorskey DJ, Burkett WH, Xiao M Cavity-linewidth Narrowing by Means of Electromagnetically Induced Transparency. Opt Lett (2000) 25:1732–4. doi:10.1364/OL.25.001732
23. Wu H, Xiao M Cavity Linewidth Narrowing and Broadening Due to Competing Linear and Nonlinear Dispersions. Opt Lett (2007) 32:3122–4. doi:10.1364/OL.32.003122
24. Carlesso F, Vieira LEA, Berni LA, Savonov GS Design, Implementation and Characterization of Cavity for Absolute Radiometer. Front Phys (2021) 9:598490. doi:10.3389/fphy.2021.598490
25. Hernandez G, Zhang J, Zhu Y Vacuum Rabi Splitting and Intracavity Dark State in a Cavity-Atom System. Phys Rev A (2007) 76:053814. doi:10.1103/PhysRevA.76.053814
26. Wu H, Gea-Banacloche J, Xiao M Observation of Intracavity Electromagnetically Induced Transparency and Polariton Resonances in a Doppler-Broadened Medium. Phys Rev Lett (2008) 100:173602. doi:10.1103/PhysRevLett.100.173602
27. Sheng J, Wu H, Mumba M, Gea-Banacloche J, Xiao M Understanding Cavity Resonances with Intracavity Dispersion Properties. Phys Rev A (2011) 83:023829. doi:10.1103/PhysRevA.83.023829
28. Sheng J, Chao Y, Kumar S, Fan H, Sedlacek J, Shaffer JP Intracavity Rydberg-Atom Electromagnetically Induced Transparency Using a High-Finesse Optical Cavity. Phys Rev A (2017) 96:033813. doi:10.1103/PhysRevA.96.033813
29. Peng Y, Wang J, Yang A, Jia Z, Li D, Chen B Cavity-enhanced Microwave Electric Field Measurement Using Rydberg Atoms. J Opt Soc Am B (2018) 35:2272–7. doi:10.1364/JOSAB.35.002272
30. Peng YD, Wang JL, Li C, Lu X, Qi YH, Yang AH, et al. Enhanced Microwave Electrometry with Intracavity Anomalous Dispersion in Rydberg Atoms. Opt Quant Electron (2020) 52:120. doi:10.1007/s11082-020-2242-9
31. Yang A, Zhou W, Zhao S, Xu Y, Jelezko F, Li Y, et al. Enhanced Measurement of Microwave Electric fields with Collective Rabi Splitting. J Opt Soc Am B (2020) 37:1664–9. doi:10.1364/JOSAB.388154
32. Pedrotti FL, Pedrotti LM, Pedrotti LS Introduction to Optics. 3 edn Cambridge: Cambridge University Press (2017). doi:10.1017/9781108552493
33. Li T, Zhou HT, Li ZH, Bai YF, Li Y, Gao JR, et al. Enhanced Vacuum Rabi Splitting and Double Dark States in a Composite Atom-Cavity System. Front Phys China (2009) 4:209–13. doi:10.1007/s11467-009-0055-l
34. Gordon JA, Simons MT, Haddab AH, Holloway CL Weak Electric-Field Detection with Sub-1 Hz Resolution at Radio Frequencies Using a Rydberg Atom-Based Mixer. AIP Adv (2019) 9:045030. doi:10.1063/1.5095633
Keywords: Rydberg atoms, optical ring cavity, vacuum Rabi splitting, cavity-assisted EIT, microwave electric field measurement
Citation: Li S, Yuan J, Wang L, Xiao L and Jia S (2022) Enhanced Microwave Electric Field Measurement With Cavity-Assisted Rydberg Electromagnetically Induced Transparency. Front. Phys. 10:846687. doi: 10.3389/fphy.2022.846687
Received: 31 December 2021; Accepted: 27 January 2022;
Published: 24 February 2022.
Edited by:
Huadan Zheng, Jinan University, ChinaReviewed by:
Xiaohong Zheng, Hefei Institutes of Physical Science (CAS), ChinaJietai Jing, East China Normal University, China
Yueping Niu, East China University of Science and Technology, China
Copyright © 2022 Li, Yuan, Wang, Xiao and Jia. This is an open-access article distributed under the terms of the Creative Commons Attribution License (CC BY). The use, distribution or reproduction in other forums is permitted, provided the original author(s) and the copyright owner(s) are credited and that the original publication in this journal is cited, in accordance with accepted academic practice. No use, distribution or reproduction is permitted which does not comply with these terms.
*Correspondence: Jinpeng Yuan, eWpwQHN4dS5lZHUuY24=; Lirong Wang, d2xyQHN4dS5lZHUuY24=
 Shaohua Li
 Jinpeng Yuan1,2*
 Lirong Wang