- 1School of Automation Engineering, University of Electronic Science and Technology of China, Chengdu, China
- 2School of Computer Science, Sichuan Normal University, Chengdu, China
- 3Chengdu Research Base of Giant Panda Breeding, Sichuan Key Laboratory of Conservation Biology for Endangered Wildlife, Chengdu, China
By analyzing the voiceprint characteristics of giant panda’s voice, this study proposes a giant panda individual recognition method based on the characteristics of the composite Mel composite frequency cepstral coefficient (CMFCC) and proves that the characteristic sequence of the CMFCC has long-range dependent characteristics. First, the MFCC (Mel composite frequency cepstral coefficient) with a low frequency resolution is obtained by the Mel filter bank; then, the inverse Mel frequency cepstral coefficient (IMFCC) features of giant panda calls are extracted. The CMFCC characteristic sequence of giant panda voice composed of the MFCC and IMFCC improves the resolution of high- and low-frequency resolution characteristics of giant panda voice. Finally, the first-order difference characteristic parameters of the MFCC are integrated to obtain the difference characteristics between frames. Through experiments, the improvement of the system recognition effect is verified, and the recognition accuracy meets the theoretical expectation.
1 Introduction
Voiceprint is a collection of various common acoustic feature maps. It is a sound feature measured by special acoustic instruments. The core of voiceprint recognition is to extract its unique speech features from the collected speech information. The feature template is formed after recognition training. During recognition, the speech used is matched with the data in the template library, and the score is calculated to judge the speaker’s identity [1]. Since 1930, there has been a basic research study on speaker recognition [2]. In 1962, the term “voiceprint” officially appeared as a sound texture feature [3]. After that, S. Pruzansky proposed a matching method based on probability value estimation and correlation calculation [4]. At the same time, the focus of recognition has become to select and extract the corresponding feature recognition parameters. Since 1970, voiceprint features such as the short-term average energy feature, linear prediction cepstral coefficient LPC (linear prediction coefficient), and Mel frequency cepstral coefficients MFCC (Mel frequency cepstral coefficients) have emerged. At the same time, some methods have also been used to extract feature parameters by using cepstral coefficients or introducing first- and second-order dynamic differences [5]. After the 1980s, characteristic parameters such as time domain decomposition, frequency domain decomposition, and wavelet packet node energy also gradually appeared and were widely used [6]. Jinxi Guo et al. studied the recognition system in the noise environment [7] and made some achievements and progress.
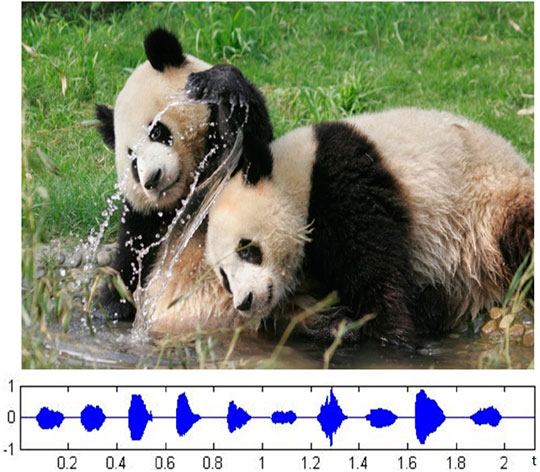
Voiceprint feature is a key link in human voiceprint recognition technology and related applications. Considering the similarity of the way of sound production between giant pandas and humans, as well as the universality and wide application of voiceprint recognition technology, the voice of giant pandas can be analyzed and studied. At present, there is no case of research on individual recognition of giant pandas based on voiceprint features, especially because of the precious voice data of giant pandas, and the giant pandas and their call waveforms are shown in Figure 1.
Voiceprint feature extraction algorithms mainly include the following [5]: the strong representation ability of the speech signal, good recognition effect, good self-specificity and feature exclusivity, simple operation, and convenient calculation.
In 2021, Li Ming proposed the mmfGn (modified multifractional Gaussian noise) theorem of long-range dependence (LRD) and short-range dependence and used the time-varying Hurst parameter to describe the time-varying sea level of LRD [8]. A new generalized fractional Gaussian noise (gfGn) is introduced. The study uses gfGn to model the actual traffic trace exhibition. The gfGn model is more accurate than the traditional fractional Gaussian noise (fGn) traffic modeling [9].
In 2021, Junyu used the Bayesian maximum entropy (BME) method to represent the internal spatiotemporal dependence of sea surface chlorophyll concentration (SSCC) distribution [10]. The Hurst index value of chlorophyll on the ocean surface ranges from 0.6757 to 0.8431. A high Hurst index value represents strong LRD, which may be a common phenomenon of daily sea surface chlorophyll [11].
This study focuses on the analysis and optimization of the Mel frequency cepstral coefficient of giant panda voice, discusses the long-range–dependent characteristics of feature sequence, analyzes the voiceprint feature sequence suitable for the giant panda individual recognition system, and realizes the individual recognition algorithm based on the giant panda voiceprint.
2 Mel Frequency Cepstral Coefficients
Mel frequency cepstral coefficients (MFCCs) are voiceprint features extracted by combining the auditory perception characteristics of human ears with the generation mechanism of speech [12]. The sensitivity of the human ear to sound is not linear, but it changes with the change in frequency. It is more sensitive to low-frequency sound than high-frequency sound. According to the perceptual characteristics of the human auditory system, the Mel cepstral coefficient is widely used in voiceprint recognition.
2.1 Mel Frequency Cepstral Coefficients of Giant Panda
The frequency corresponding to the MFCC is the Mel frequency, which is recorded as
The following is the extraction process of the Mel frequency cepstral coefficient:
1) First, the original speech signal
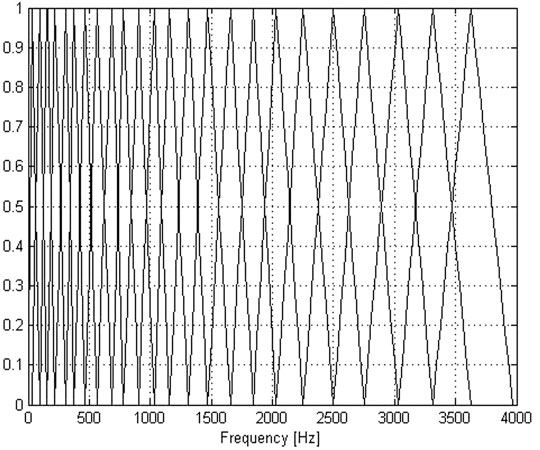
2) The Mel frequency filter bank composed of a group of triangular filters is used to filter the linear spectrum to obtain the Mel spectrum, and then, its logarithmic energy is calculated to obtain the logarithmic energy
A group of triangular bandpass filter combinations constitute Mel filter banks, where,
The transfer function of each bandpass filter is as follows:
The formula for obtaining the logarithmic spectrum
3) By substituting the above logarithmic energy into the discrete cosine transform (DCT), the Mel cepstral parameters
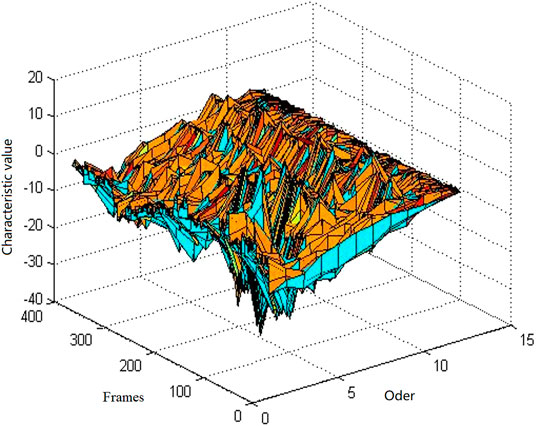
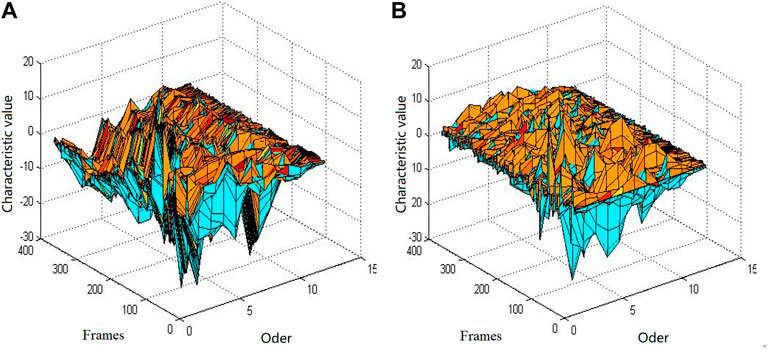
Figure 3 is a 12-order MFCC characteristic diagram of a giant panda voice, in which the X-axis represents the order of the MFCC coefficient, the Y-axis represents the number of frames of voice, and the Z-axis represents the corresponding cepstral parameter value.
2.2 First-Order Differential Mel Frequency Cepstral Coefficients of Giant Panda Sound
The standard MFCC parameters reflect the static characteristics within each frame of speech, while the difference of the MFCC reflects the dynamic characteristics. The Furui experiment shows that adding dynamic characteristics to the features can greatly improve the system performance [13]. The introduction of differential features has a wide range of applications and good results in the field of human voice recognition. Therefore, this method is also first used in the processing of giant panda voice.
After obtaining the MFCC parameters, use Eq. 2.5 to extract the MFCC first-order differential parameter
where
Figure 4 shows the characteristics of the MFCC of order 12 and ΔMFCC of order 12 of the same giant panda voice.
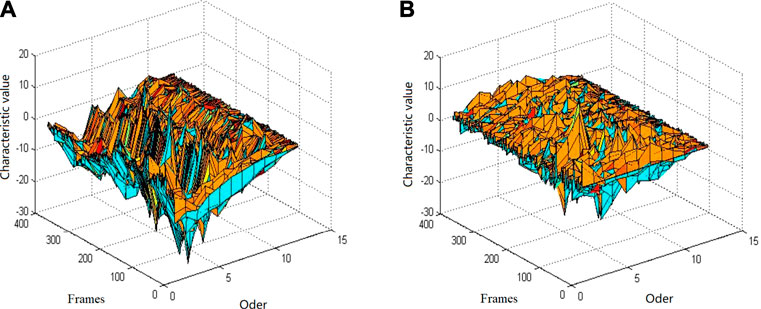
FIGURE 4. 12th order MFCC and its ΔMFCC characteristic diagram. (A) MFCC characteristic diagram and (B) ΔMFCC characteristic.
3 Compound Mel Frequency Cepstral Coefficient of Giant Panda Sound
3.1 The Inverse Mel Frequency Cepstral Coefficient
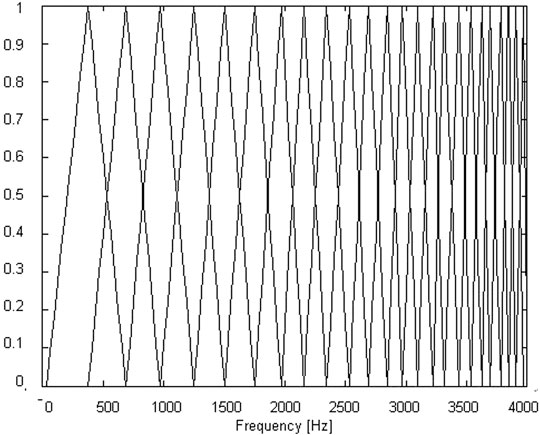
The IMFCC feature can compensate the high-frequency information and improve the system recognition rate through its integration with the traditional MFCC. The structure of the IMFCC filter bank is shown in Figure 5.
Corresponding to the Mel domain of the traditional filter structure, we call this domain as the inverted Mel domain, which is recorded as IMEL, and the corresponding frequency is recorded as
The inverted filter response becomes
where
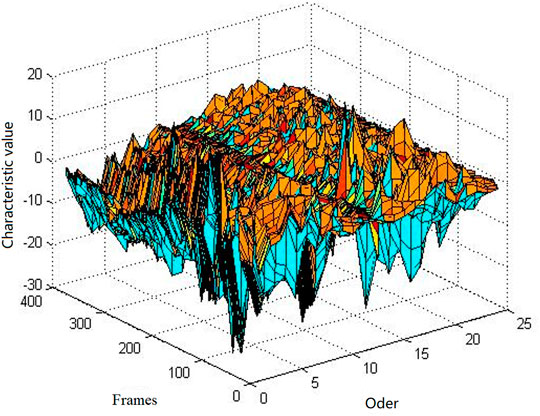
Figure 6 shows the 12th order MFCC and the 12th order IMFCC characteristic diagram of a giant panda sound, in which the X axis represents the order of the MFCC , the Y axis represents the number of voice frames, and the Z axis represents the corresponding cepstral parameter values.
3.2 Composite Mel Composite Frequency Cepstral Coefficient
MFCC characteristic parameters are obtained through the Mel filter bank and a series of operations. Accordingly, the characteristic coefficients obtained after a series of operations through the Mel filter bank and composite filter bank of the inverted Mel filter bank are called composite Mel frequency cepstral coefficients, which are recorded as the CMFCC (compound Mel frequency cepstral coefficient).
Therefore, we fuse the 12th order MFCC characteristic diagram and 12th order IMFCC characteristic diagram in Figure.7 to obtain the corresponding 24th order CMFCC characteristic parameter diagram, as shown in Figure 8.
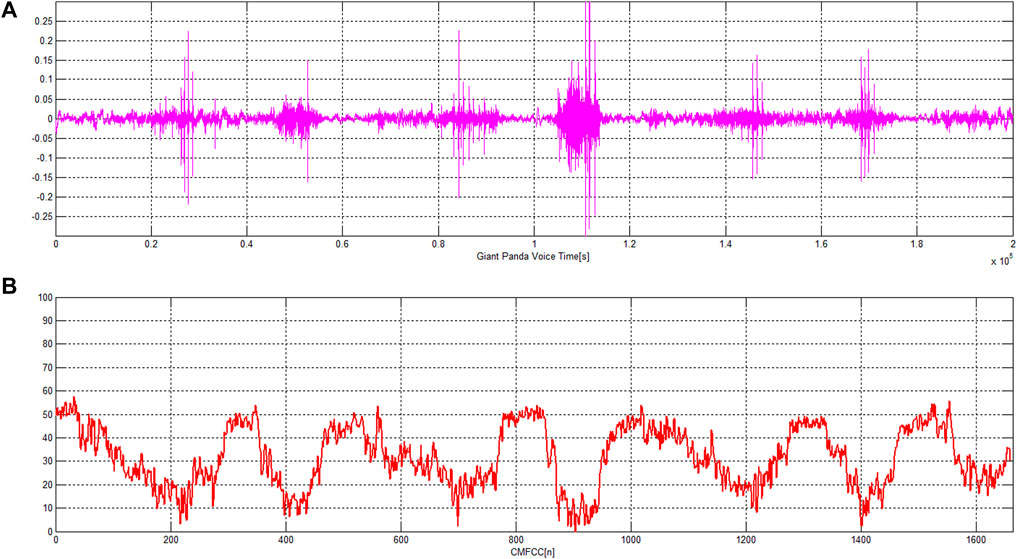
FIGURE 8. Original sound signal of the giant panda and the CMFCC characteristic sequence. (A) Original sound signal of the giant panda, (B) the CMFCC characteristic sequence extracted from the sound.
3.3 Hurst Exponent of the Composite Mel Composite Frequency Cepstral Coefficient Feature Sequence
Assuming that the sequence composed of CMFCC features satisfies the fractional Brownian motion distribution, we can calculate H according to the following method [13, 15, 16].
Let n be the number of data of CMFCC-modified multifractional Gaussian noise (mmfGn) [8, 9]. Let
Without loss of generality, we assume
where
Figure 8 shows the original sound signal of giant panda and the CMFCC characteristic sequence. Figure 9 shows the H-index distribution of two CMFCC characteristic sequences of the giant panda sound. In Figure 9A, the giant panda sound duration time
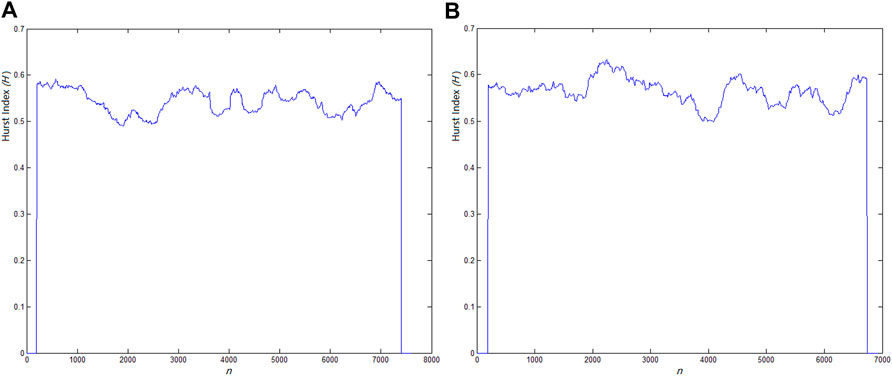
FIGURE 9. H-index distribution of two CMFCC characteristic sequences of giant panda sound, (A)
4 Discussion
We applied the CMFCC feature sequence with LRD to giant panda individual recognition. Considering that this feature is the feature information obtained within the speech frame, the △MFCC of the MFCC feature parameter is introduced. The two features of CMFCC and ΔMFCC are fused to obtain a new feature parameter.
There are 20 individual giant pandas. Each individual has 10s sounds, including 4s for training and 6s for testing. The ratio between the number of correctly recognized test sounds and the total number of test sounds is the correct recognition rate. The final result is the average of the recognition rates of the three experiments, as shown in Figure 10 and Table 1.
The order of CMFCC and MFCC features are 8, 12, 16, and 20, respectively, and the order of △MFCC also corresponds to 8, 12, 16, and 20. From Table 1, we can see that the higher the order of features, the higher is the recognition rate, indicating that the correlation of feature sequences is also stronger.
The final individual identification of giant panda is shown in Table 1. Figure 10 is a broken line diagram of three feature recognition results.
It can be seen from Figure 10 and Table 1 that the characteristic parameters obtained by flipping the Mel filter bank can improve the resolution of the high-frequency part. Therefore, after using CMFCC features, the recognition rate of giant panda individuals is higher than that under the MFCC. At the same time, this is because the ΔMFCC feature considers the difference between frames and improves the feature performance of the CMFCC. Therefore, the recognition rate of the CMFCC and ΔMFCC combination feature is better, and the theoretical results are consistent with the experimental expectations.
5 Conclusion
This study mainly presents the characteristics of the Mel composite cepstral coefficient of giant panda sound (CMFCC) for individual recognition. It is verified that the CMFCC feature sequence conforms to the distribution characteristics of fractional Brownian motion, which has long-range dependence. This feature sequence makes use of the memory characteristics of the giant panda voice in time and can obtain the characteristics of the giant panda sound in low- and high-frequency resolution at the same time. Through experimental verification, it has the best effect on individual recognition of the giant panda and improves the efficiency of the giant panda. The recognition rate has reached the expected effect of individual recognition of the giant panda.
Data Availability Statement
The original contributions presented in the study are included in the article/Supplementary Material, further inquiries can be directed to the corresponding author.
Author Contributions
All authors listed have made a substantial, direct, and intellectual contribution to the work and approved it for publication.
Funding
This research is supported by the Chengdu Research Base of Giant Panda Breeding (Nos. 2020CPB-C09 and CPB2018-01).
Conflict of Interest
The authors declare that the research was conducted in the absence of any commercial or financial relationships that could be construed as a potential conflict of interest.
Publisher’s Note
All claims expressed in this article are solely those of the authors and do not necessarily represent those of their affiliated organizations, or those of the publisher, the editors, and the reviewers. Any product that may be evaluated in this article, or claim that may be made by its manufacturer, is not guaranteed or endorsed by the publisher.
References
1. Li Y, Gu Z, Liu S. Voiceprint Authentication Technology. Water conservancy Sci Technol economy (2005) 11(6):384–6. doi:10.3969/j.issn.1006-7175.2005.06.034
2. Wu X. Voiceprint Recognition Auditory Recognition. Computer World (2001)(8). doi:10.15949/j.cnki.0371-0025.2001.03.011
4. Pruzansky S. Pattern‐Matching Procedure for Automatic Talker Recognition. The J Acoust Soc America (1963) 35(3):354–8. doi:10.1121/1.1918467
5. Arsikere H, Gupta HA, Alwan A. Speaker Recognition via Fusion of Subglottal Features and MFCCs. Interspeech (2014) 1106–10. doi:10.21437/Interspeech.2014-284
6. Gong C. Research on Speaker Recognition of Ear Speech Based on Joint Factor Analysis [D]. Suzhou, China: Suzhou University (2014).
7. Guo J, Yang R. Robust Speaker Identification via Fusion of Subglottal Resonances and Cepstral Features. IEEE Signal Process. (2015). doi:10.1121/1.4979841
8. Li M. Modified Multifractional Gaussian Noise and its Application. Physica Scripta 96(12):202112500212. doi:10.1088/1402-4896
9. Li M. Generalized Fractional Gaussian Noise and its Application to Traffic Modeling. Physica A 579(22):20211236137. doi:10.1016/j.physa.2021.126138
10. He J, George C, Wu J, Li M, Leng J. Spatiotemporal BME Characterization and Mapping of Sea Surface Chlorophyll in Chesapeake Bay (USA) Using Auxiliary Sea Surface Temperature Data. Sci Total Environ (2021) 794:148670. doi:10.1016/j.scitotenv.2021
11. He J. Application of Generalized Cauchy Process on Modeling the Long-Range Dependence and SelfSimilarity of Sea Surface Chlorophyll Using 23 Years of Remote Sensing Data. Front Phys (2021) 9:750347. doi:10.3389/fphy.2021.750347
12. Peltier RF, Levy-Vehel J. Multifractional Brownian Motion: Definition and Preliminaries Results. INRIA TR (1995) 2645:1995. doi:10.1007/978-1-4471-0873-3_2
13. Milner B. Inclusion of Temporal Information into Features for Speech Recognition. Proc ICSLP (1996) 96:256269. doi:10.1109/icslp.1996.607093
15. Li M. Fractal Time Series-A Tutorial Review. Math Probl Eng 2012 (2010). doi:10.1155/2010/157264
Keywords: MFCC, long-range dependent, individual recognition, voiceprint, Gaussian mixture model
Citation: Hu S, Liao Z, Hou R and Chen P (2022) Characteristic Sequence Analysis of Giant Panda Voiceprint. Front. Phys. 10:839699. doi: 10.3389/fphy.2022.839699
Received: 20 December 2021; Accepted: 14 January 2022;
Published: 21 February 2022.
Edited by:
Ming Li, Zhejiang University, ChinaReviewed by:
Jianwei Yang, Nanjing University of Information Science and Technology, ChinaJunyu He, Zhejiang University, China
Copyright © 2022 Hu, Liao, Hou and Chen. This is an open-access article distributed under the terms of the Creative Commons Attribution License (CC BY). The use, distribution or reproduction in other forums is permitted, provided the original author(s) and the copyright owner(s) are credited and that the original publication in this journal is cited, in accordance with accepted academic practice. No use, distribution or reproduction is permitted which does not comply with these terms.
*Correspondence: Peng Chen, Y2Fwcmljb3JuY3BAMTYzLmNvbQ==
 Shaoxiang Hu
 Zhiwu Liao
 Rong Hou
 Peng Chen